

April 29, 2022 by Shahriar Lahouti. Peer Reviewed By Mojtaba Chardoli.
CONTENT
- Preface
- Physiologic background
- Hypervolemia
- Approach to management of hypervolemia
- Volume removal from pleura and peritoneum
- Diuretics
- Diuretic resistance
- Management of diuretic-related complications
- Going further
- Appendix
- Media
Preface
Organ congestion is a mediator of adverse outcomes in critically ill patients and is inevitable during their course of treatment *. While both arterial (forward flow) and venous (organ outflow) limbs of the hemodynamic circuit are important for tissue perfusion, the venous side remains relatively under-explored. In this review, principles of volume status to hemodynamic assessment and decongestive treatment of critically ill patients with volume overload are explored.
Physiologic background
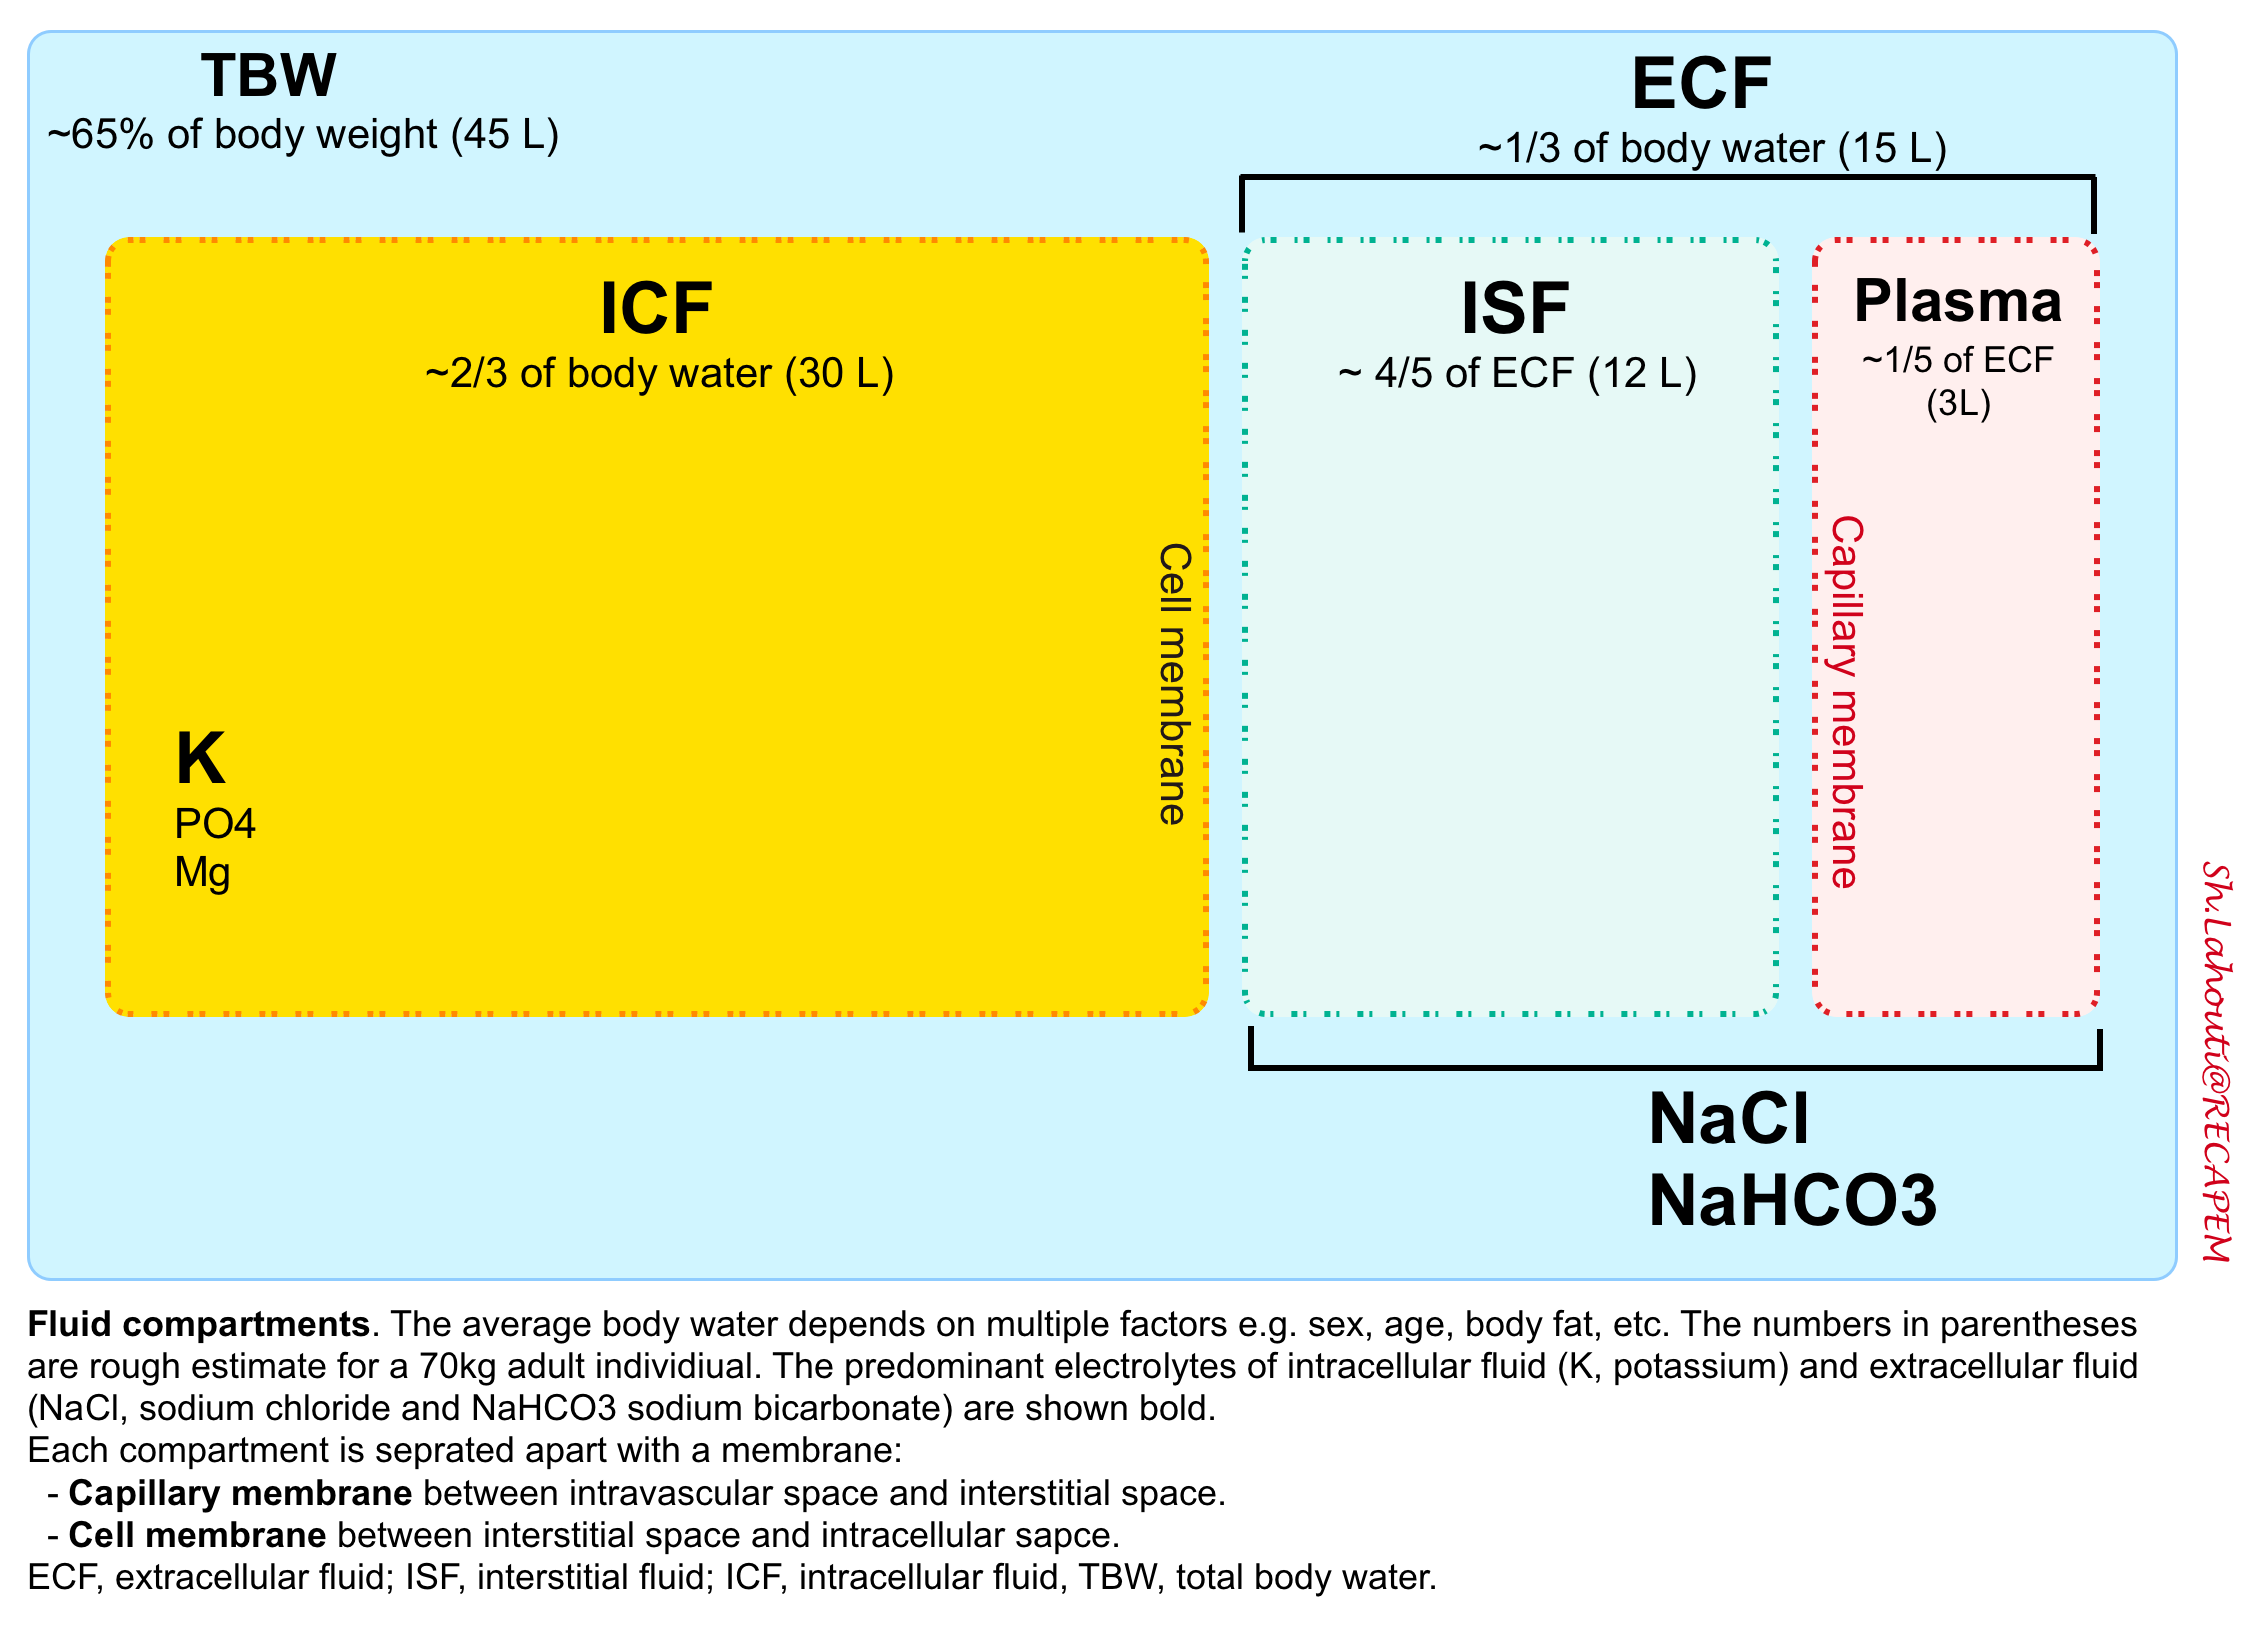
Life has evolved in saltwater, thus humans need constant access to water and salt. Approximately 65% of the average adult human weight is water. This water is contained in various fluid compartments in the body including intracellular (2/3 of total body water) and extracellular fluid compartments.
The extracellular fluid (ECF) is the fluid contained outside of the cells. These constitute almost 1/3 of total boy water (~15L in 70 kg adult) and include (figure below):
- Interstitial fluid (ISF): 4/5 of extracellular fluid (normal euvolemic humans store ~12L of saltwater in the interstitium of their bodies).
- Plasma: 1/5 of extracellular fluid (~3L).
- Transcellular fluid (a.k.a. third space, normally ignored in calculations) is contained inside organs such as peritoneal, cerebrospinal, and pleural fluids.
Regulation of intracellular fluid volume
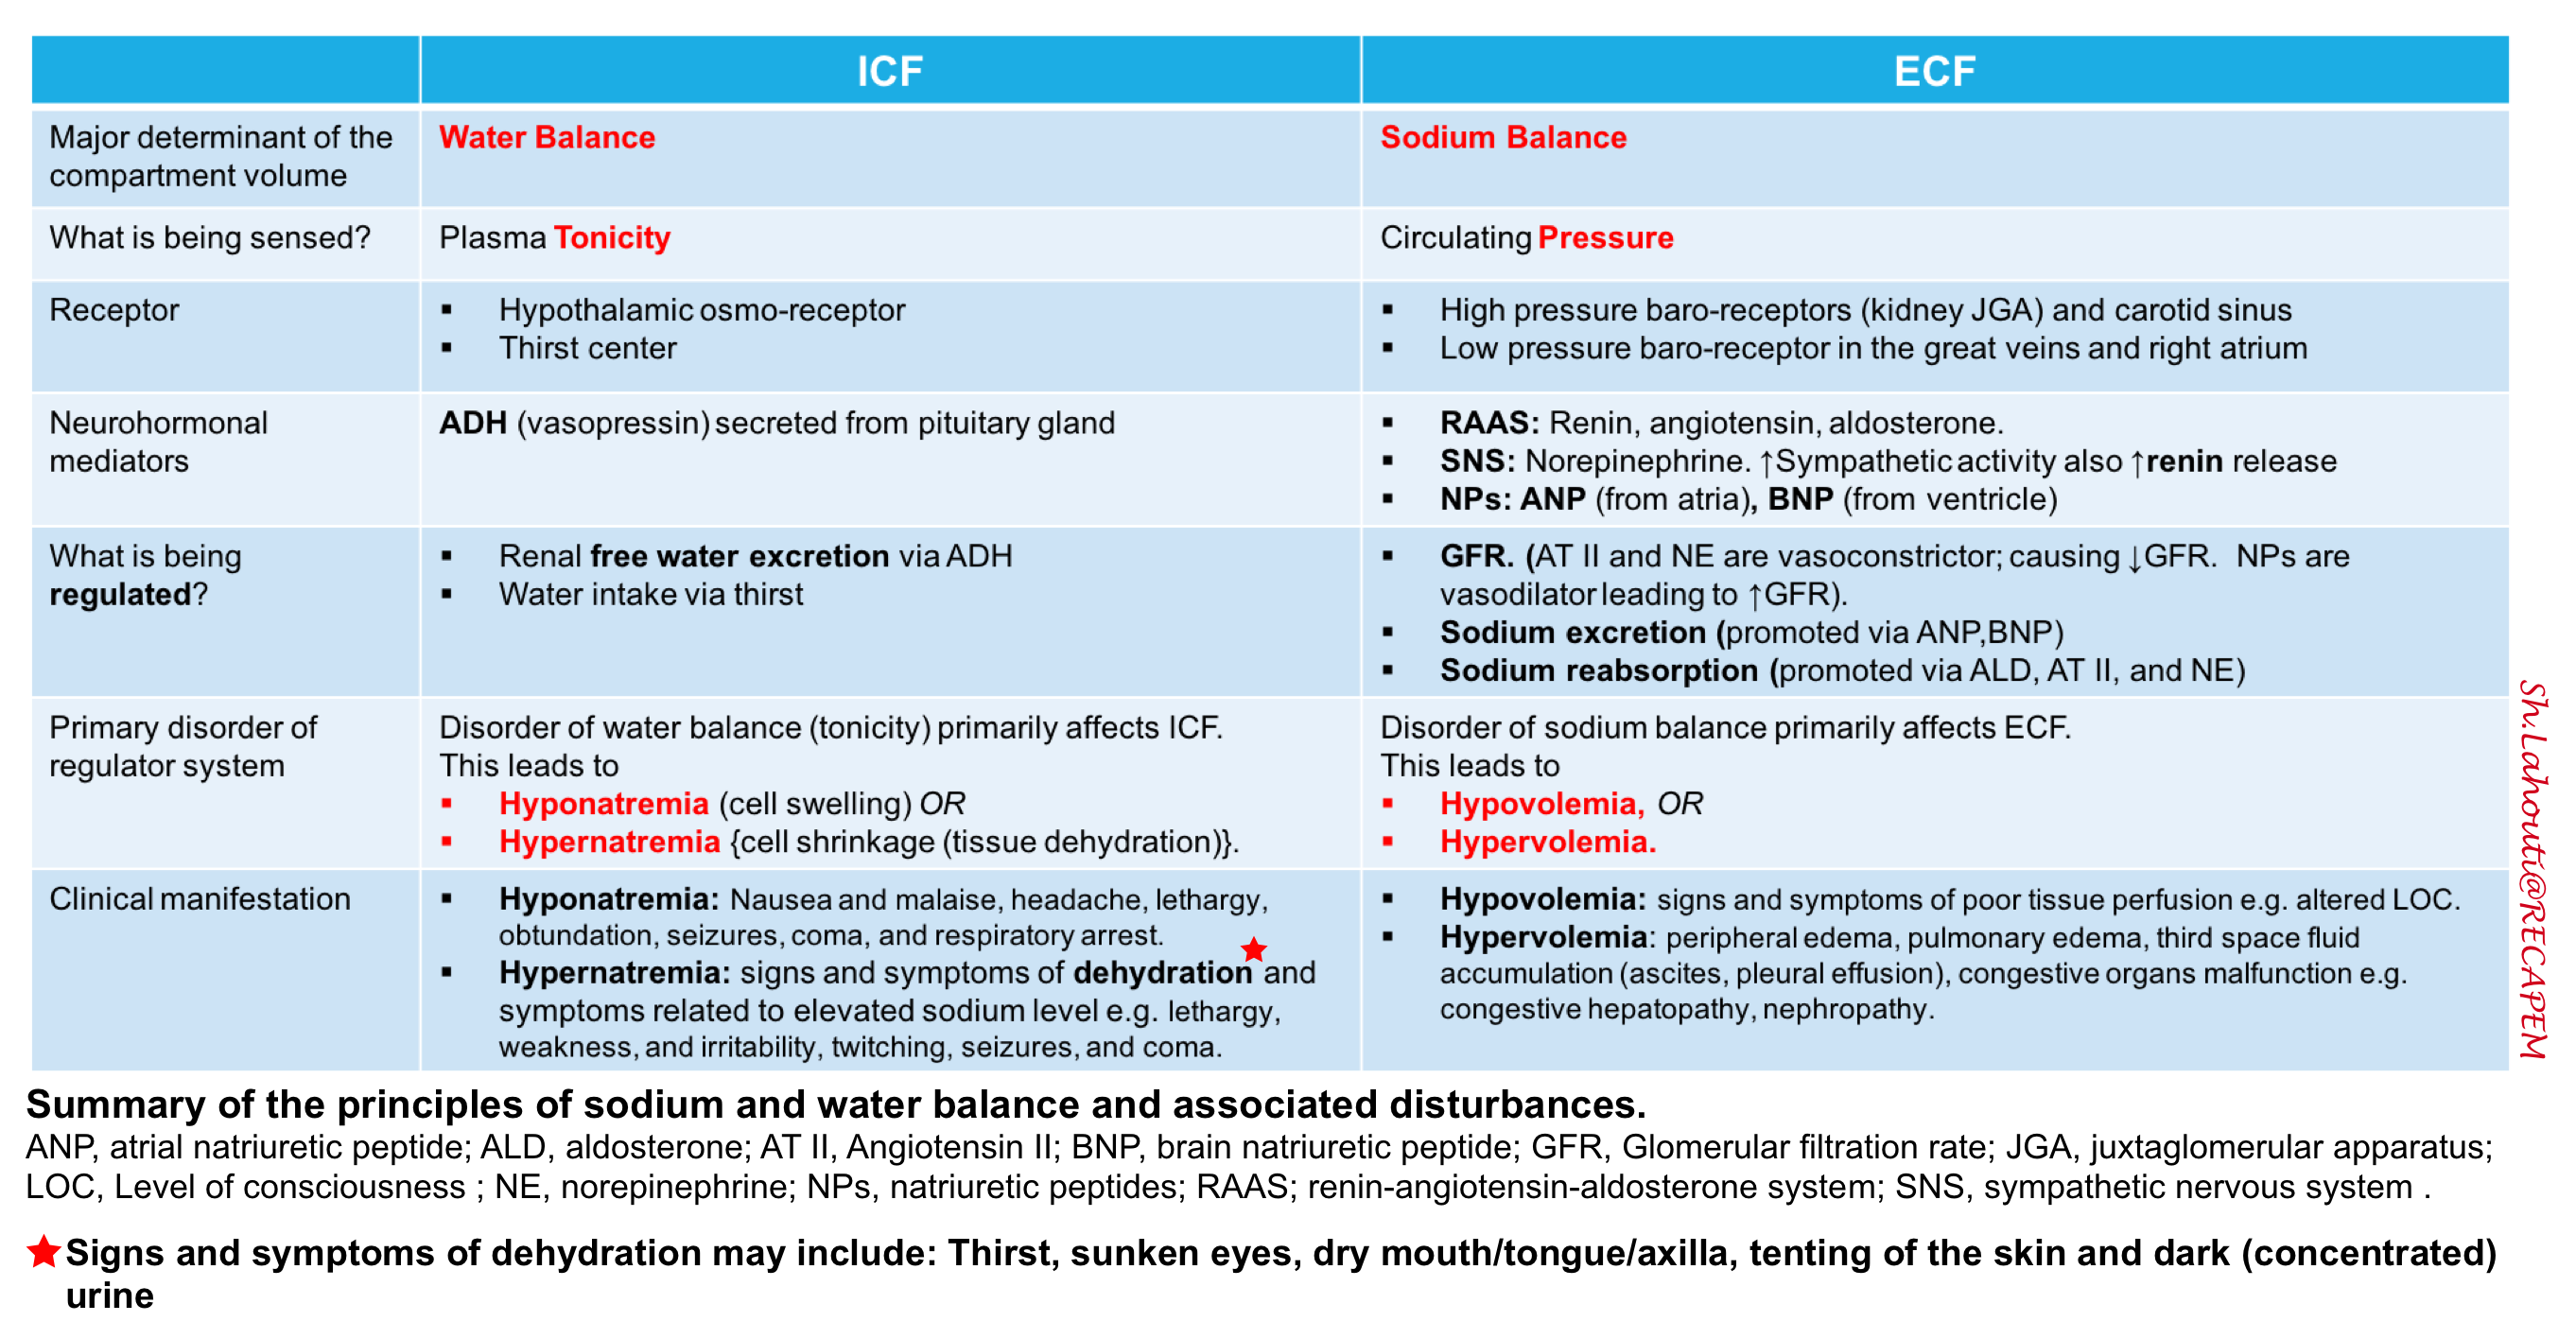
In normal adults, the intracellular fluid volume constitutes ~ 70% of the total body water. This volume is mainly regulated by plasma tonicity and water balance.
Plasma tonicity
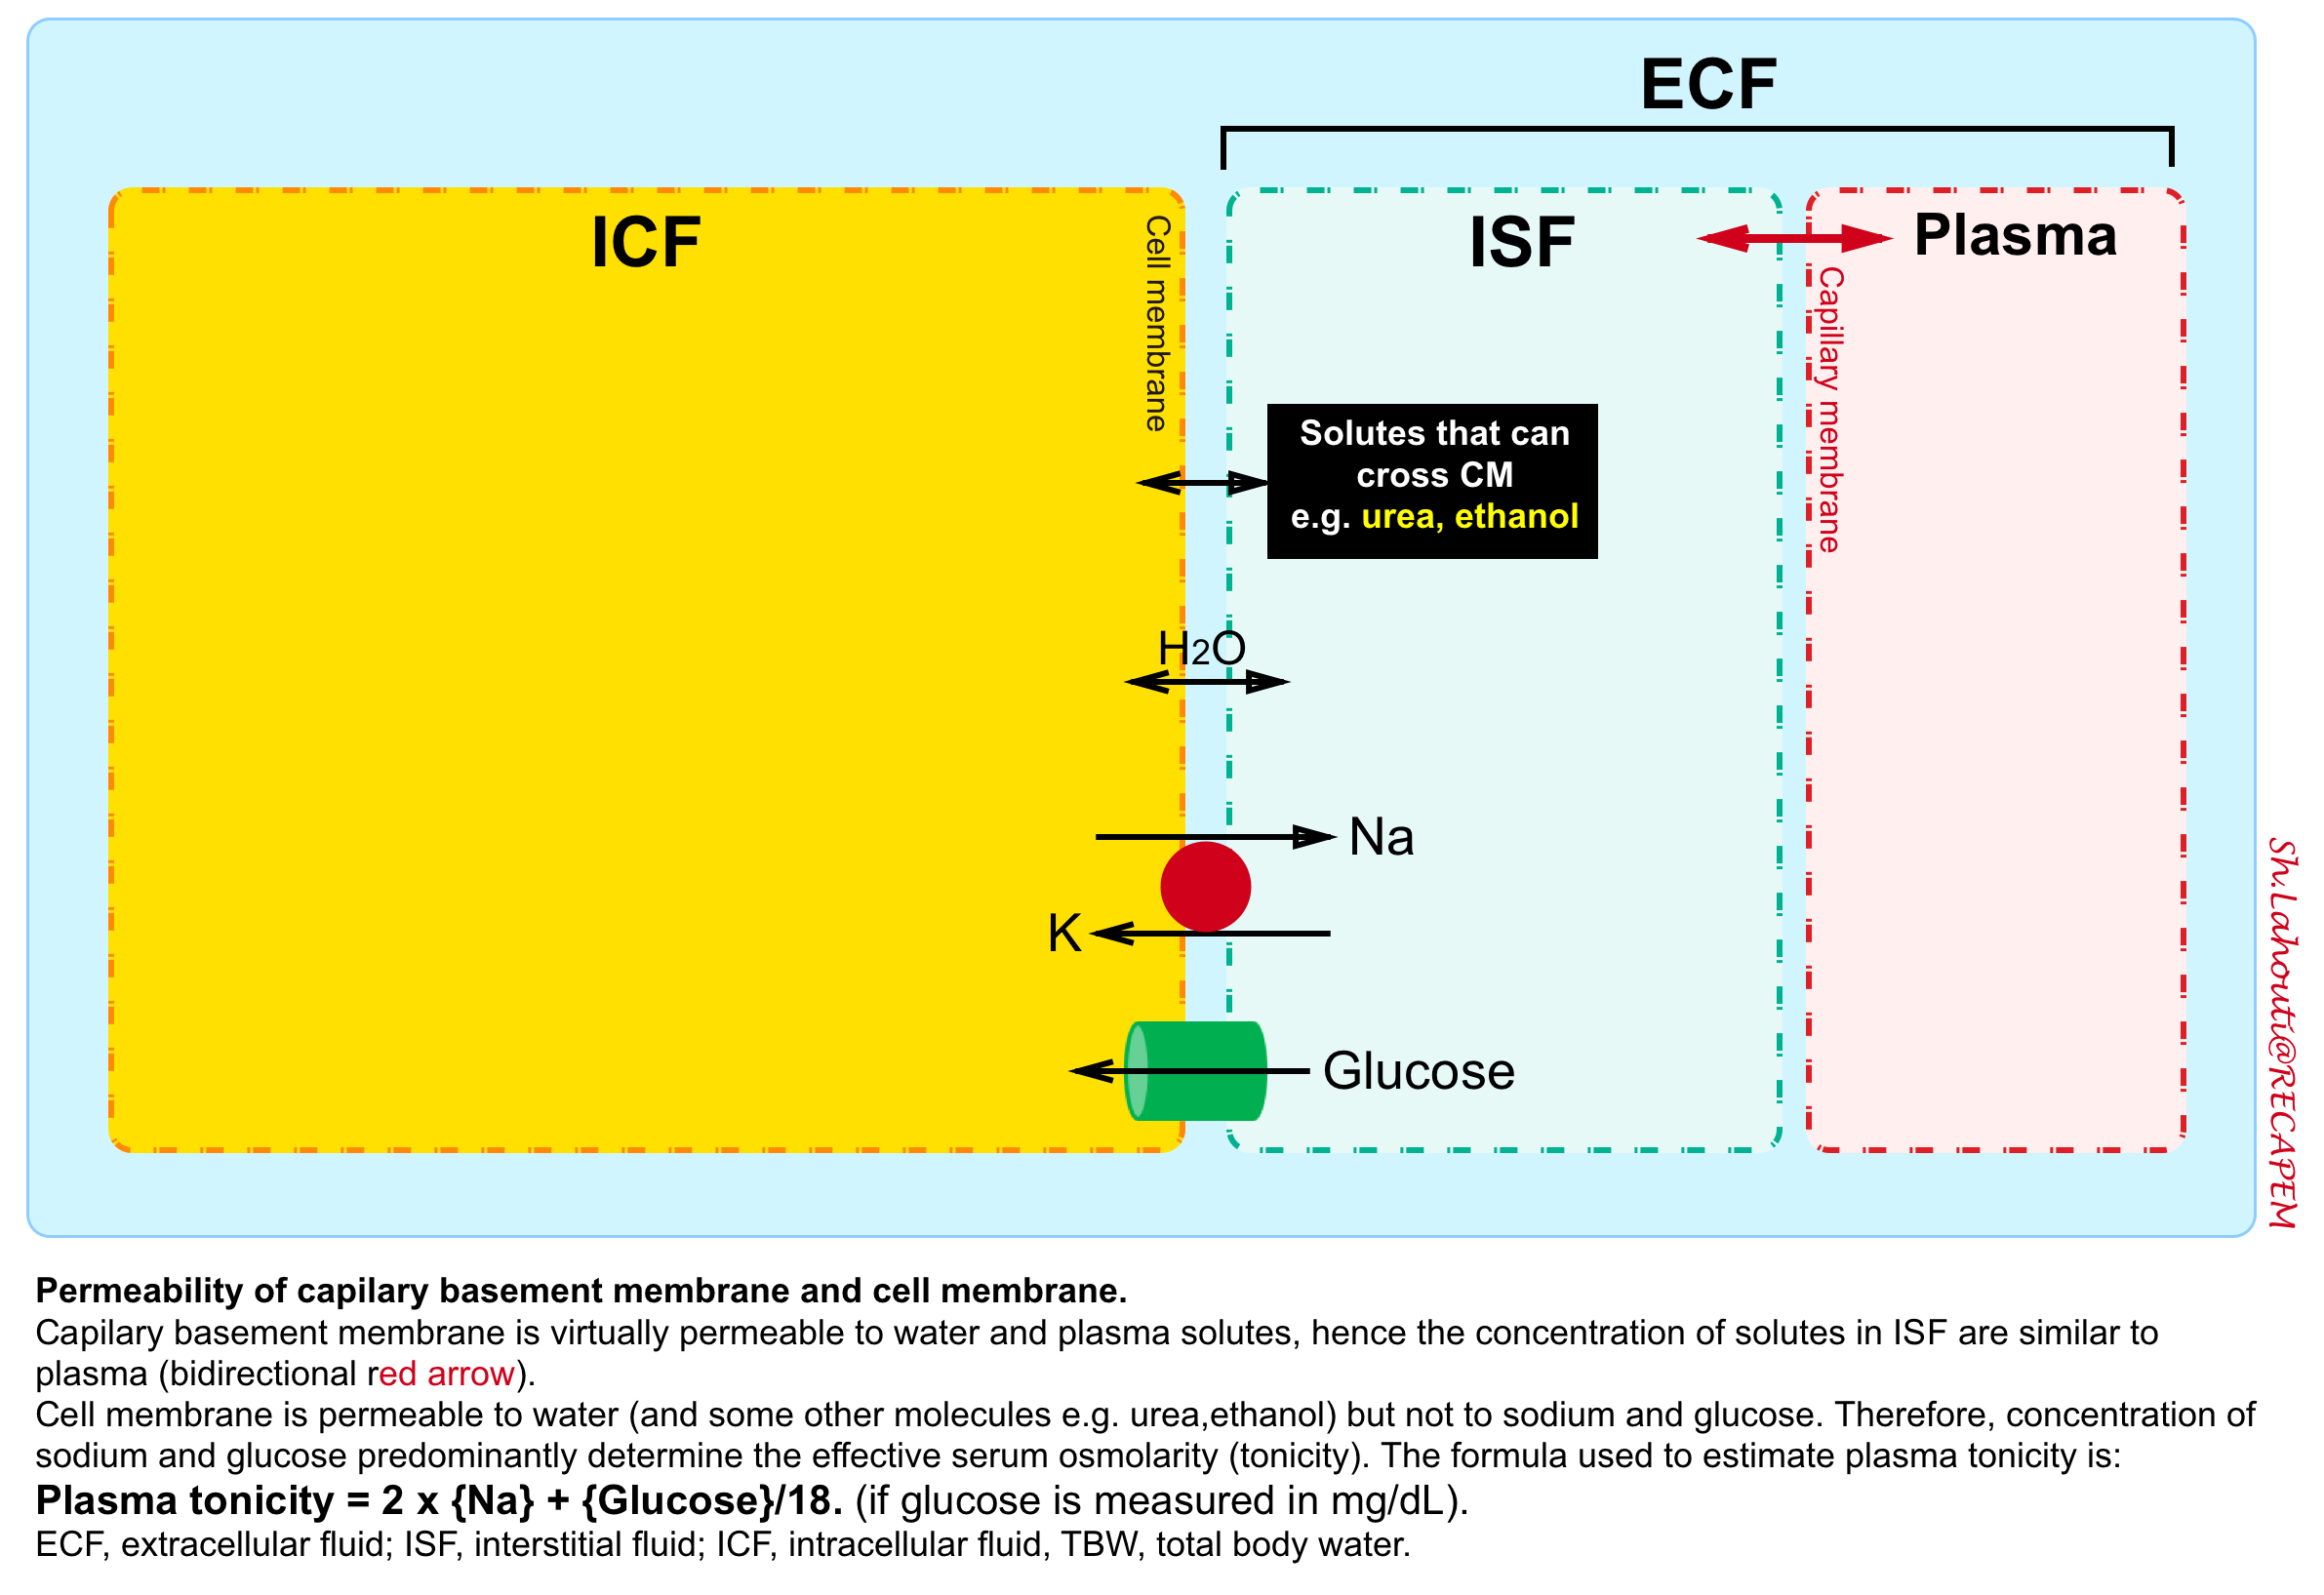
Each body fluid compartment is separated apart with a membrane; the capillary membrane between intravascular fluid and interstitial fluid and the cell membrane between intracellular fluid and interstitial fluid.
- The capillary membrane is permeable to water and major circulating solutes e.g. sodium, glucose, urea, etc.
- In contrast, the cell membrane is permeable to water but not to electrolytes and glucose.
When two solutions are separated by a membrane that is permeable only to water, water crosses into the compartment with the more concentrated solution to equalize the ion concentration in each. The force driving this movement is “osmotic pressure”.
- In human fluids, the substances that contribute the most to osmotic pressure in ECF are sodium and glucose. In physiology, this force is called effective osmolality or “tonicity”.
Regulation of tonicity and water balance
- Tonicity is dictated by water balance.
- The hypothalamus, pituitary (via anti-diuretic hormone [ADH] secretion and thirst), and kidneys (by adjusting water reabsorption, and responding to ADH) regulate tonicity by manipulating the amount of water or concentration of the urine.
- The corresponding physiology is explained as:
- Inadequate water intake leads to an increased serum sodium and thus increased tonicity, which is perceived by the hypothalamus. This creates thirst and activates ADH secretion from the pituitary, leading to:
- Increased water intake
- Increased water reabsorption in the collecting tubule (a concentrated urine {> 300 mOsm/kg}).
- Water excess leads to decreased serum sodium and thus decreased tonicity, which inhibits thirst (hypothalamus) and suppresses pituitary ADH secretion, leading to:
- Decreased water intake
- Decreased water reabsorption in the collecting tubule, increasing urine output (dilute urine {< 100 mOsm/kg}).
- Inadequate water intake leads to an increased serum sodium and thus increased tonicity, which is perceived by the hypothalamus. This creates thirst and activates ADH secretion from the pituitary, leading to:
- Disorders of water balance result in Hyper/hyponatremia.
- The plasma sodium concentration, or tonicity, leads to changes in cell volume.
- In the setting of hypotonic plasma, cells swell with water. Hypertonic plasma draws water out of the cell into the vasculature, causing cell shrinkage.
- Bottom line: Disorders of water balance result in hyper/hyponatremia, which primarily affects the ICF compartment.
- Dehydration is a state of inadequate body water, increased tonicity, and shrunken cells, ultimately causing central nervous system (CNS) dysfunction.
Regulation of extracellular fluid volume
In normal adults, the extracellular fluid volume constitutes ~30% of the total body water. This volume is principally regulated by alteration in serum sodium.
Regulation of sodium balance and volume status
- Maintenance of adequate circulating volume (sodium balance) is the body’s ultimate priority.
- Total body volume status is dictated by sodium balance.
- The kidneys regulate volume status by adjusting glomerular filtration rate (GFR) and sodium balance, manipulating the amount of urine sodium. The corresponding physiology is explained as:
- Hypovolemia (decreased circulating volume) is perceived by the kidney as a decreased renal blood flow, which causes a decreased GFR with subsequent activation of the renin-angiotensin-aldosterone system (RAAS), leading to:
- Decreased urine output
- Increased sodium reabsorption to conserve salt.
- Hypervolemia (increased circulating volume) is perceived by the kidney as increased renal blood flow, which leads to an increased GFR leading to sodium spillage “a.k.a. pressure natriuresis” and increased urine output.
- Hypovolemia (decreased circulating volume) is perceived by the kidney as a decreased renal blood flow, which causes a decreased GFR with subsequent activation of the renin-angiotensin-aldosterone system (RAAS), leading to:
- Disorder of sodium balance results in hypo/hypervolemia.
- Hypovolemia usually equals total body sodium depletion, implying no reserve saltwater in the interstitium, and no edema is anticipated.
- Hypervolemia often equals total body sodium overload, implying excessive saltwater in the interstitium, manifesting as peripheral edema.
- Bottom line: Disorder of sodium balance results in hypo/hypervolemia which primarily affects the ECF compartment.
- 👉Reemphasizing that volume overload is a problem of sodium balance, not water balance.
Summary Table
🚩Question: Is the term dehydration interchangeable with hypovolemia?
- Dehydration is defined as a loss in total body water which can occur through GI e.g. diarrhea; skin/respiratory tract or bleeding etc.
- True volume depletion (hypovolemia) is present when the volume loss is chemically similar to ECF (isotonic to ECF) and contains both sodium and water (saltwater).
- Hypovolemia refers to a decreased intravascular circulating volume, wherein mean systemic filling pressure (see below) is low and there is a net flux of water and electrolytes out of the interstitial and tissue spaces into the bloodstream (to defend intravascular volume).
- True volume depletion (hypovolemia) manifests with signs and symptoms of tissue hypoperfusion e.g. altered mental status, and organ malfunction. (see below)
- Dehydration: is present when the volume loss is chemically pure water e.g. diabetes insipidus.
- Since it is pure water loss, it causes hypernatremia (increased tonicity). Increased tonicity will drag water out of the cells. Therefore the fluid loss primarily affects the intracellular compartment, unless dehydration is severe (which may affect ECF as well).
- Signs and symptoms of dehydration include Thirst, fatigue, sunken eyes, dry mouth, tongue, axilla and tenting of the skin, and dark (concentrated urine).
- For example, adult patients with diabetes ketoacidosis are dehydrated due to urinary loss of water and glucose (osmotic diuresis), hence they have pure water loss. Such patients usually present with signs and symptoms of dehydration but not poor tissue perfusion. If an adult patient with DKA presents with signs and symptoms of poor tissue perfusion (shock state), investigate for underlying possible cause(s) of shock such as sepsis, GI bleeding, and severe acidosis.
Regulation of circulating volume
- Most of the intravascular blood volume sits in the venous system. In contrast to the arteries, the veins have a floppy wall with a tendency to collapse.
- Veins can initially be filled without changing their distending pressures (floppy veins as shown below) because they merely alter their conformation rather than stretch. The volume of blood sitting in these veins is called unstressed volume and accounts for 60-70% of total circulating blood volume.
- However, once these veins are filled beyond a certain volume, the conformational changes alone cannot accept more volume without requiring the vessel’s walls to stretch, the distending pressure will start to increase and flow will be established. This proportion of volume that is flowing is the actual amount of intravascular volume that has enough pressure to be driven up to the heart. This is called stressed volume (i.e. effective circulating volume).
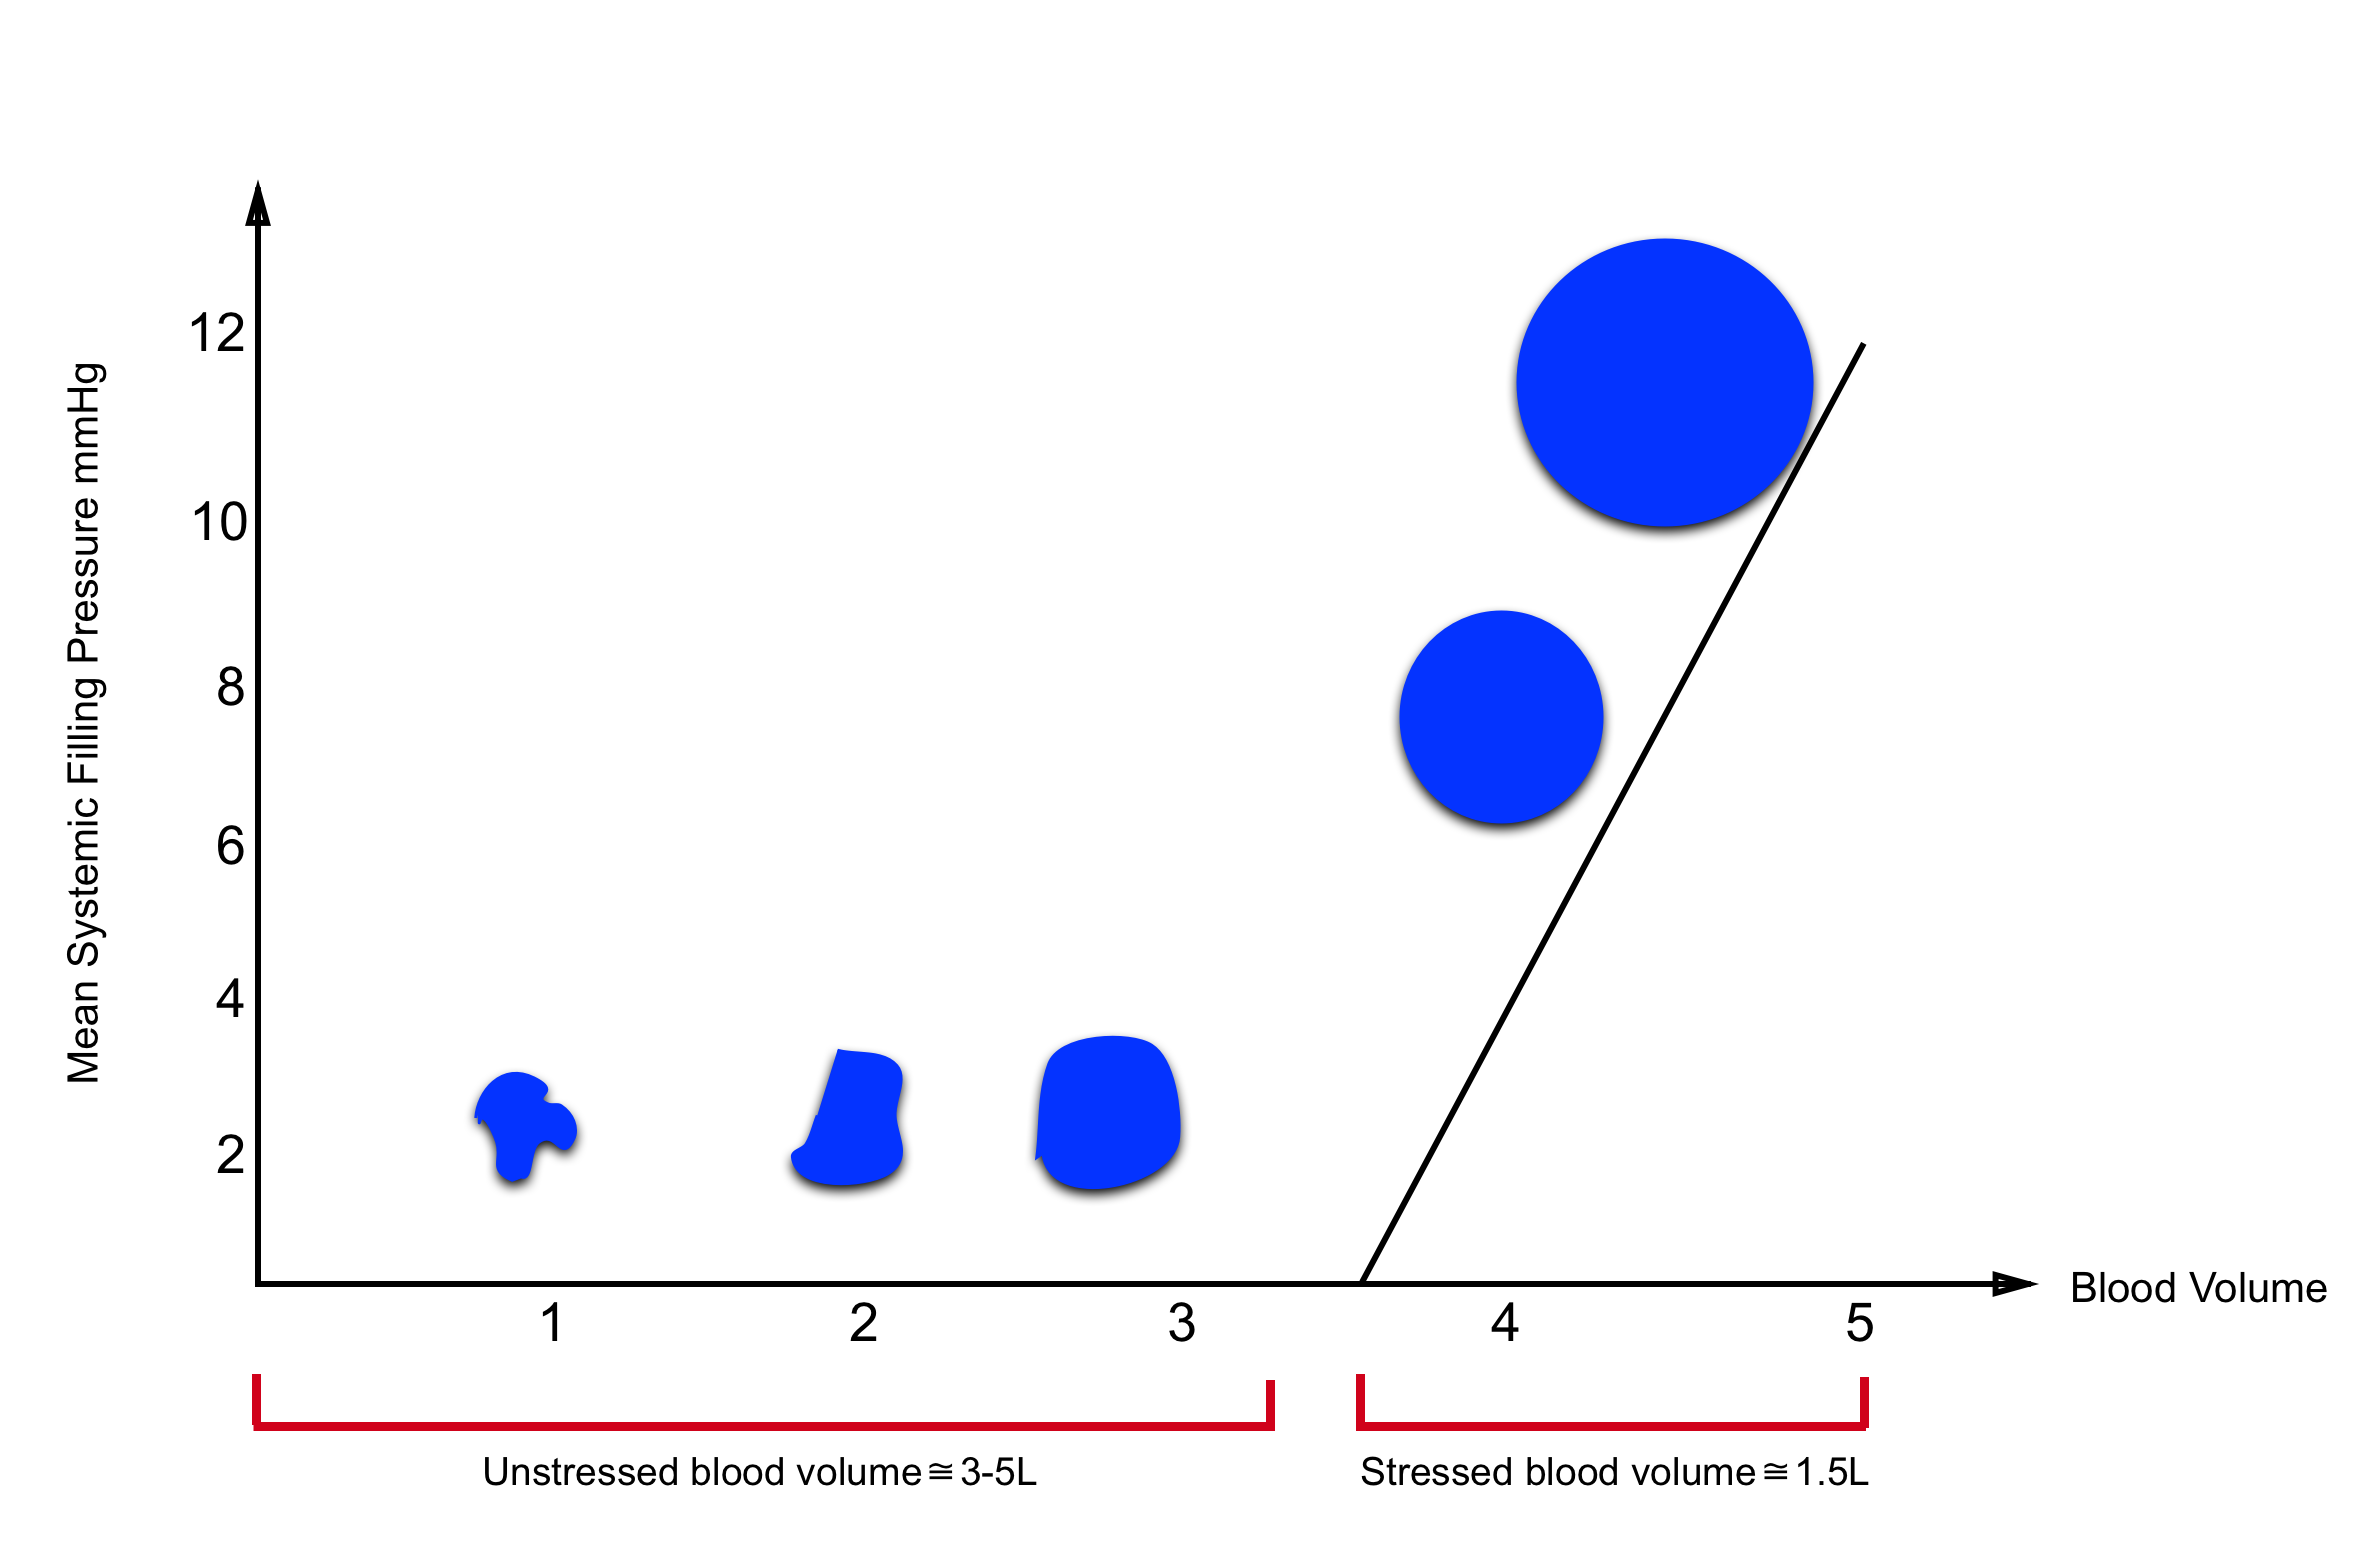
As illustrated in the figure below, the amount of unstressed volume can be rapidly and dynamically changed by changing blood flow distribution, increasing surrounding tissue pressure, or increasing venomotor tone.
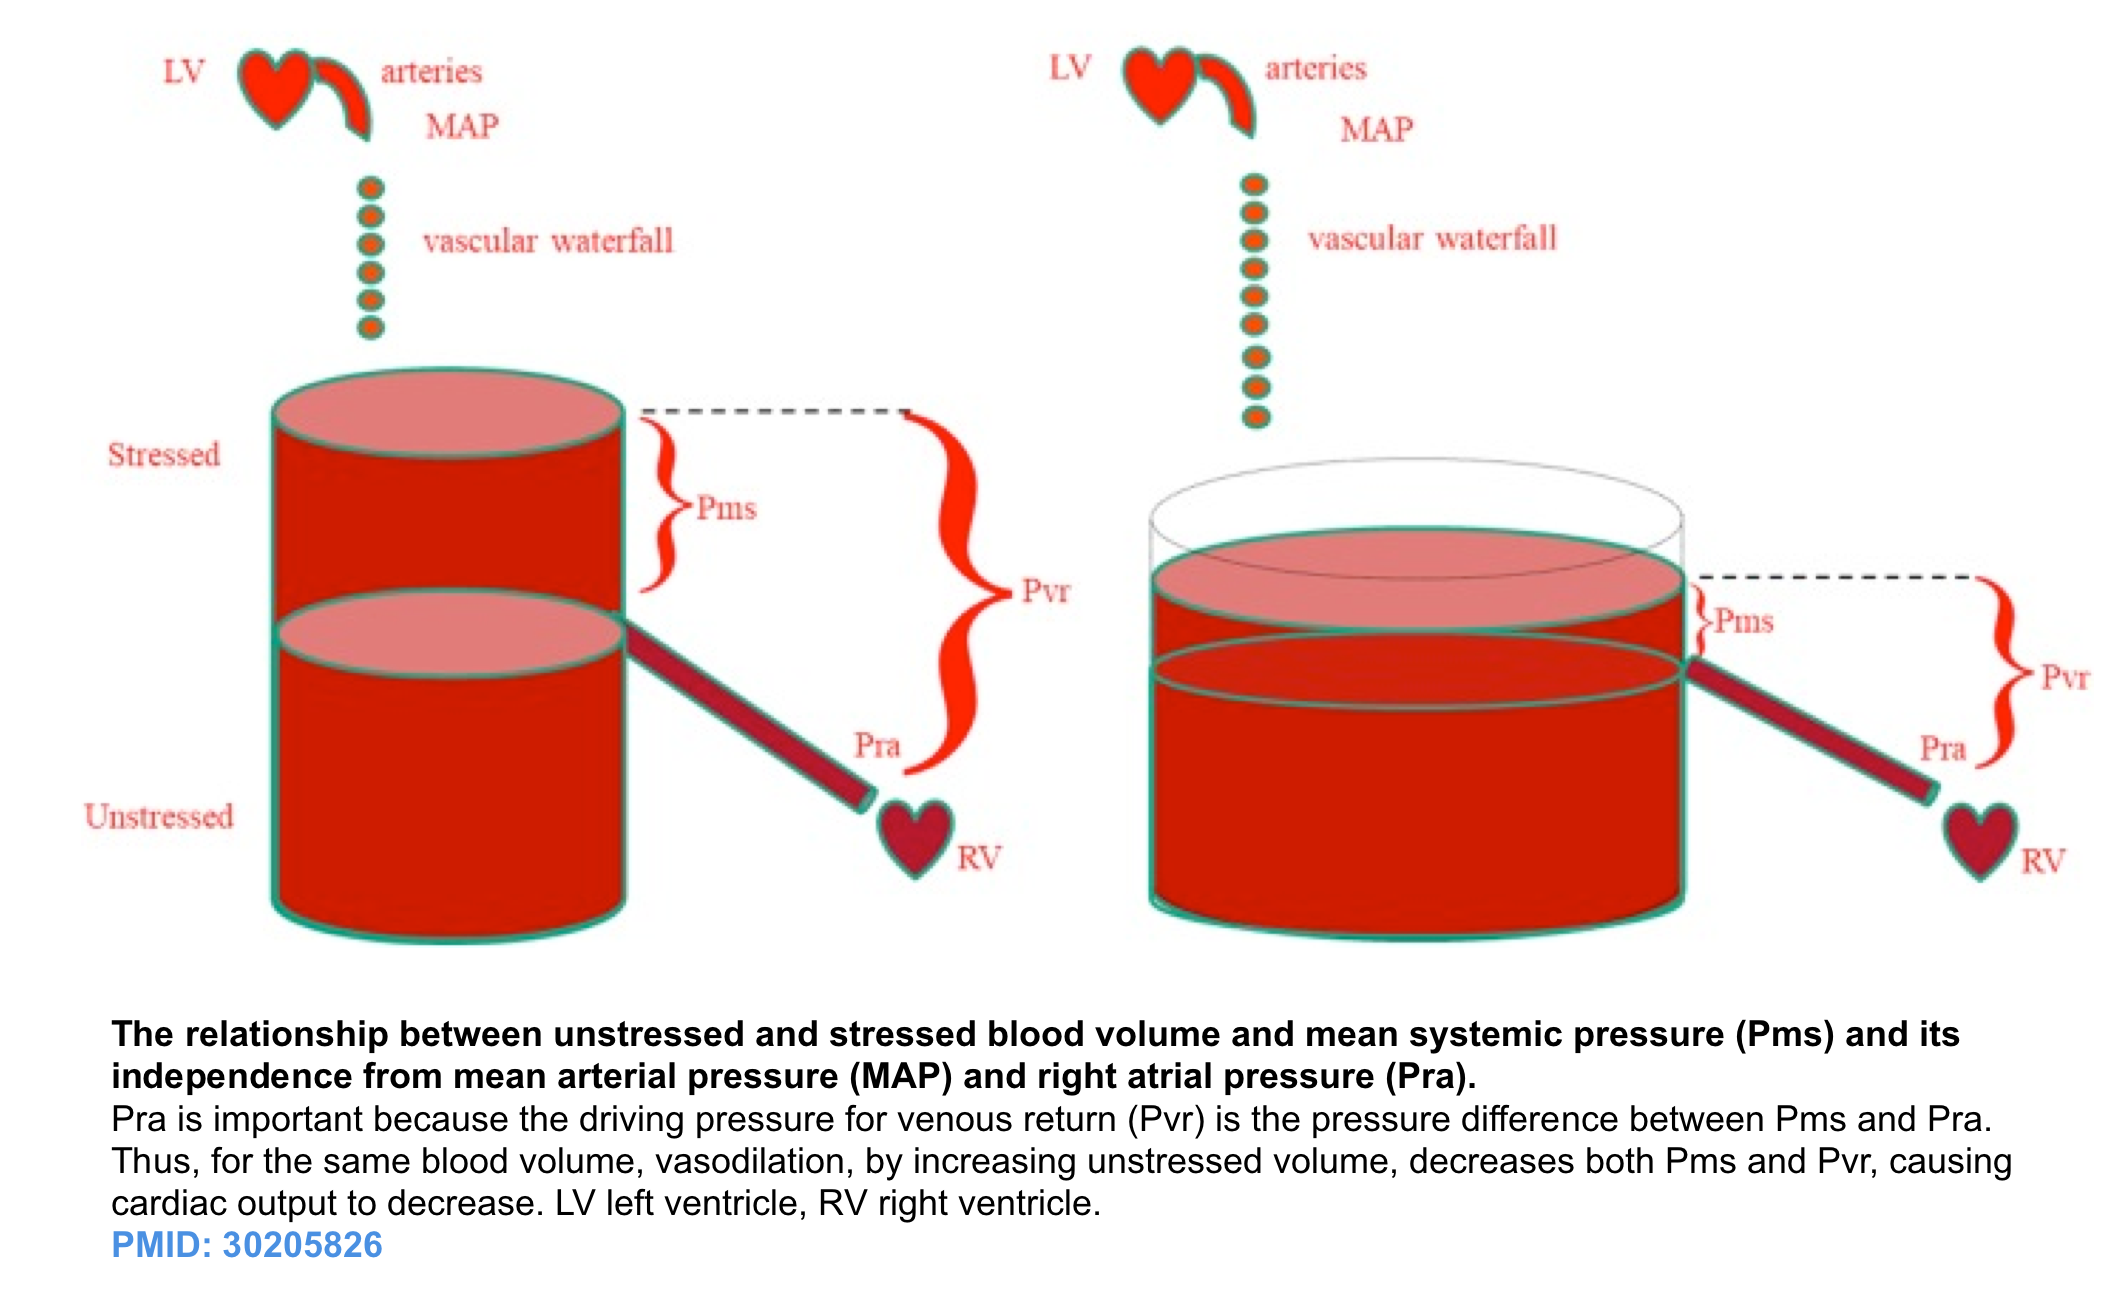
- The effective circulating blood volume (stressed volume) reflects the proportion of blood volume above the unstressed volume and is essentially independent of arterial pressure because arterial pressure is dissipated across the high resistance arterioles, analogous to a “vascular waterfall” *.
- The stressed blood volume relative to the venous compliance defines the mean systemic filling pressure (MSFP), which is the back pressure to venous flow from the body back to the right ventricle *.
The role of vascular integrity in maintaining vascular volume
In the classic “Starling model” of edema formation, a balance of pressure-driven plasma ultrafiltration across the capillary wall and a colloid-osmotic pressure–mediated plasma reabsorption were proposed mechanisms for edema formation.
In recent years, our understanding of vascular biology in edema formation has been changed with the recognition “glycocalyx” molecule.
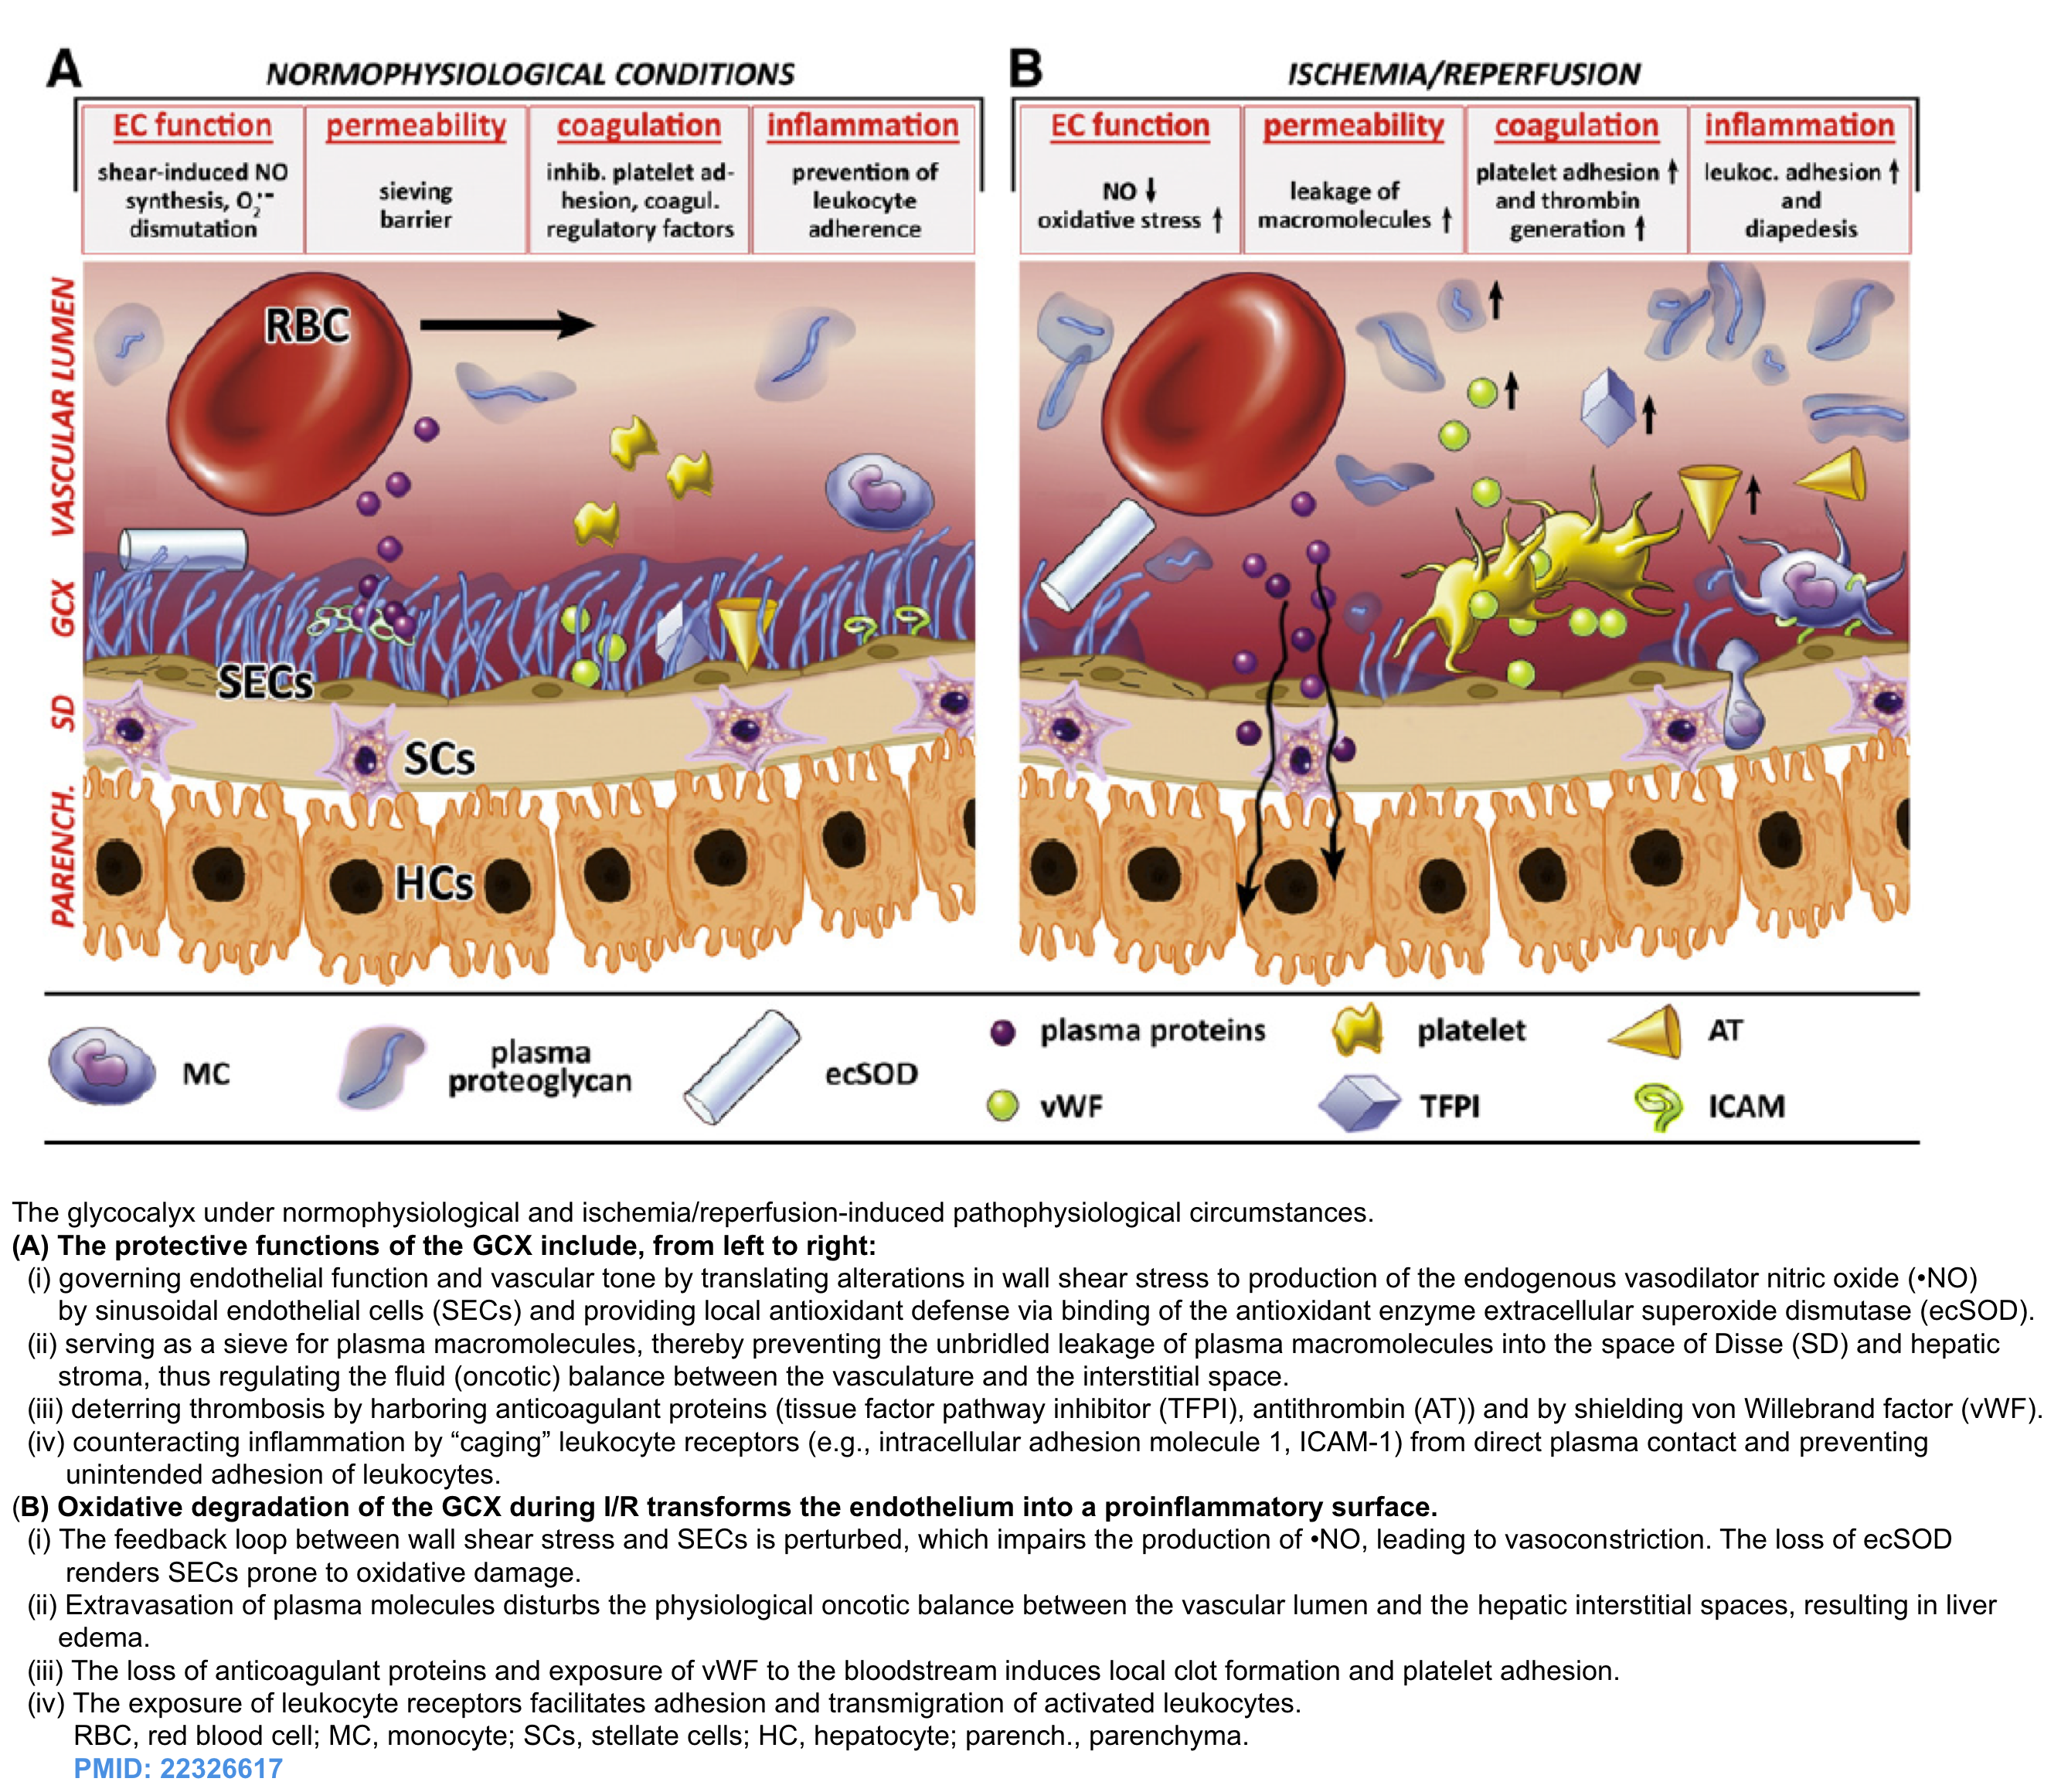
- The glycocalyx (GC) is a gel-like layer covering the luminal surface of the intact vascular endothelial cells. It has several physiologic functions including (figure below):
- Regulating vascular permeability.
- Storing a large proportion of noncirculating plasma volume.
- Modulating inflammation and hemostasis.
- An important functional role of the glycocalyx is to bind plasma proteins wherein a uniform oncotic gradient is established and it remains fairly constant along the capillary bed *. This gradient will oppose and attenuate pressure-mediated plasma water efflux without ever causing reabsorption of fluid from the interstitium, except in specialized vascular beds in the renal tubules and the intestines.
- The physiologic and clinical implications of these findings include:
- The rate of fluid loss from the capillaries is relatively not affected by plasma oncotic pressure.
- Hypoalbuminemia (in isolation) does not cause edema.
- The primary process of driving edema in nephrotic syndrome is salt and water retention and systemic inflammation involving TNFa rather than hypoalbuminemia.
- Raising plasma oncotic pressure will have NO role in the reabsorption of fluid in edematous states.
- For the same token, raising plasma oncotic pressure has NO role in preventing edema formation in sepsis.
- The rate of transcapillary fluxes of fluid is much smaller than previously predicted and is unidirectional. Almost all vascular refilling from the interstitium occurs via lymphatic channels.
- The edema formation in inflammatory states is related to the degradation of glycocalyx molecule and once the damage is made, it’s not rapidly reversible.
- Therefore every fluid administration should be carefully considered, as resolution of the resultant interstitial edema is likely to be very difficult, especially in critically ill patients.
- Loss of glycocalyx is associated with ongoing inflammatory response by exposure to endothelial cell adhesion molecules.
- Such mechanisms may mediate important pathologic events associated with interstitial edema, such as acute lung injury.
- The rate of fluid loss from the capillaries is relatively not affected by plasma oncotic pressure.
- Evidence of widespread alteration and breakdown of the endothelial glycocalyx has been demonstrated in several disease states such as *:
- Sepsis
- Post-ischemic states
- After major surgery and trauma
- Acute hyperglycemia
- Hypervolemia *.
- It has been shown that postoperative volume expansion mediates atrial natriuretic peptide (ANP) release and shedding of glycocalyx; raising the possibility that fluid therapy can indirectly compromise vascular integrity and worsen fluid shifts to the interstitium.
Bottom line: Rates of fluid loss from capillaries is determined by
- The integrity of glycocalyx. In fact, plasma oncotic pressure plays little or no role in the pathogenesis of edema formation.
- Capillary pressure (increased by increased venous pressure and the extent of precapillary arteriolar vasodilation, which transmits systemic pressure to the capillary bed).
🚩Question: Is hypervolemia interchangeable with volume overload?
- Volume (fluid) overload can be loosely referred to as a pathologic accumulation of water and salt in the body beyond that seen in healthy individuals *. This excess fluid accumulates as extracellular fluid in expandable interstitial compartments as interstitial edema and as gross fluid collections such as pleural effusions or ascites.
- Hypervolemia refers to an excessive blood volume, wherein mean systemic systemic pressure is high. This will cause a net fluid loss into the interstitium, resulting in some edema formation. This is seen in patients with renal failure, congestive heart failure, or liver failure, especially when these conditions are associated with overzealous fluid administration.
- Although hypervolemia is always associated with some edema, the reverse is not always true, i.e. edema (congestion) is not always associated with hypervolemia *.
- For example in patients with sepsis or other types of inflammatory responses (e.g. pancreatitis, burns), who often have altered capillary permeability; protein-rich fluid leaks from the intravascular to the interstitial space even when mean circulatory filling pressure is low, leading to combined hypovolemia and peripheral edema.
- In patients with acute decompensated heart failure, “redistribution of circulating volume” from the peripheral (e.g. low capacitance visceral veins) to the central (intra-thoracic major vessels) compartment can also contribute to the development of signs and symptoms of congestion *. It has been demonstrated that 54% of patients hospitalized for acute decompensation of heart failure gain ≤1 kg during the month prior to admission, suggesting that volume overload incompletely characterizes the pathophysiology of acute heart failure *.
- Although hypervolemia is always associated with some edema, the reverse is not always true, i.e. edema (congestion) is not always associated with hypervolemia *.
Hypervolemia
Causes
- Iatrogenic e.g. overresuscitation.
- Kidney retention of salt and water.
- Primary renal disease.
- Secondary kidney retention occurs when there is a reduction in effective circulating volume
- Congestive heart failure
- Cirrhosis
Pathogenesis
Hypervolemia is a state of elevated mean systemic filling pressure (MSFP). If the MSFP becomes sufficiently elevated by circulatory failure (e.g. RV failure) or fluid overload, the elevated venule pressure requires higher capillary pressures to maintain blood flow, and increased capillary pressure promotes fluid movement to the interstitial space.
At an organ level, tissue edema impedes capillary blood flow and lymphatic drainage, especially in encapsulated organs, such as the kidneys and liver, where additional volume cannot be accommodated without an increase in interstitial pressure, causing further impairment of organ perfusion and function *.
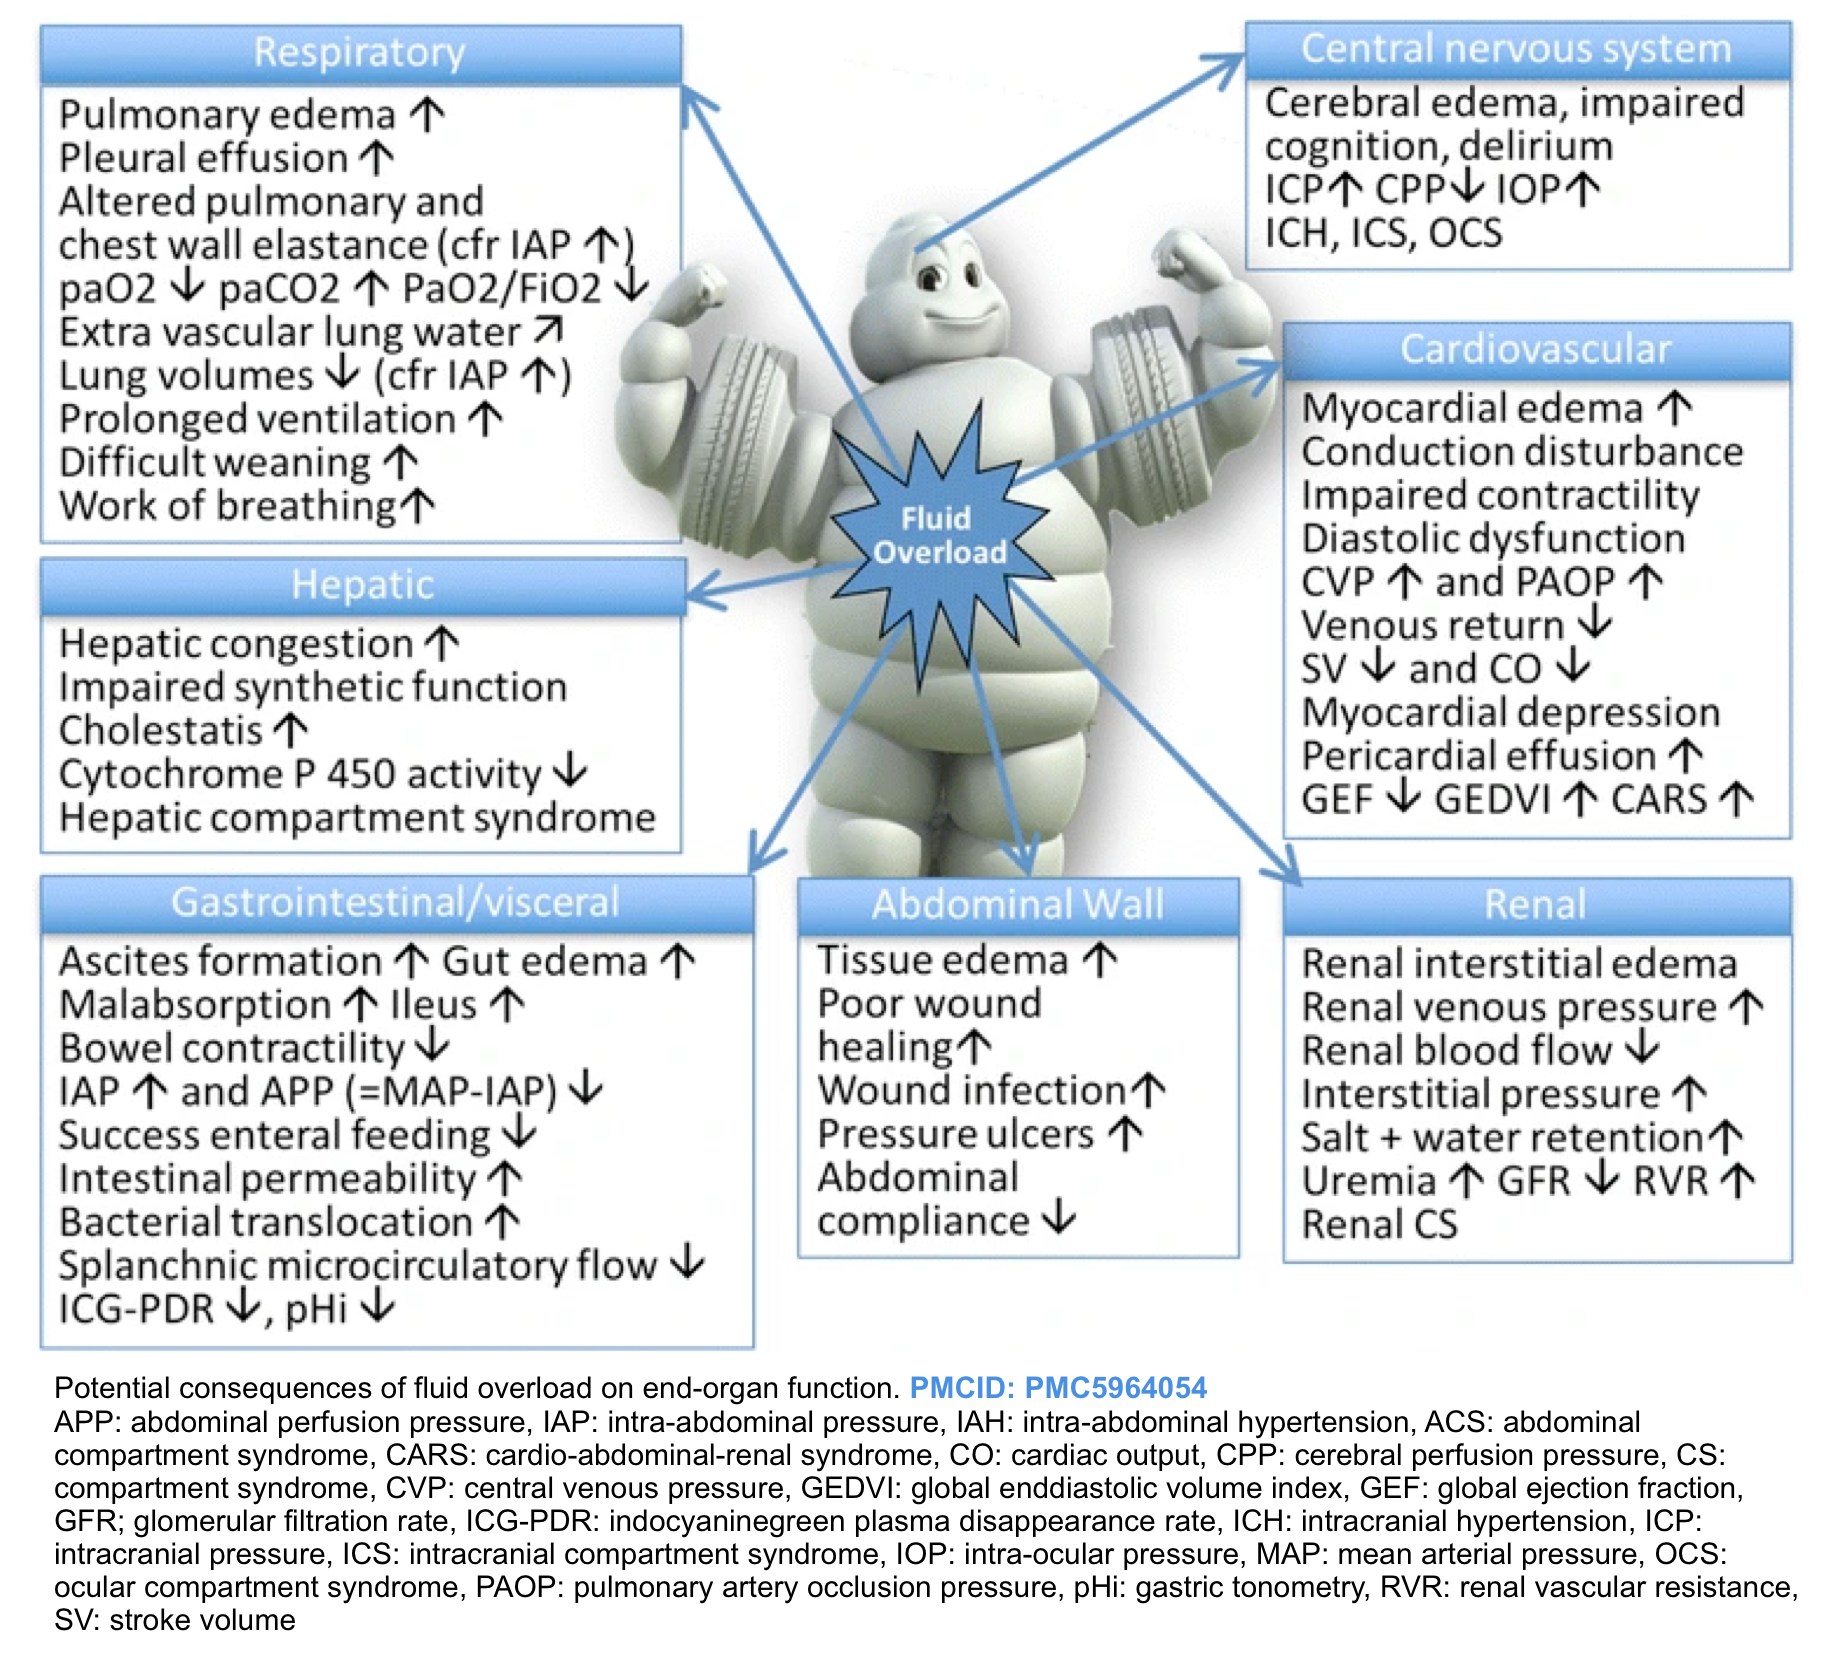
Evidence of the adverse effects of fluid overload can be found in almost all organ systems including the gastrointestinal tract, the liver, the cardiovascular system, the central nervous system, and skin and soft tissues (figure below). In particular, fluid overload and the resultant visceral edema are risk factors for intra-abdominal hypertension (IAH) *.
- In an ICU population, positive fluid balances have been associated with an increased risk of IAH, which in turn is strongly associated with the development of other organ dysfunction, particularly the development of AKI *,*.
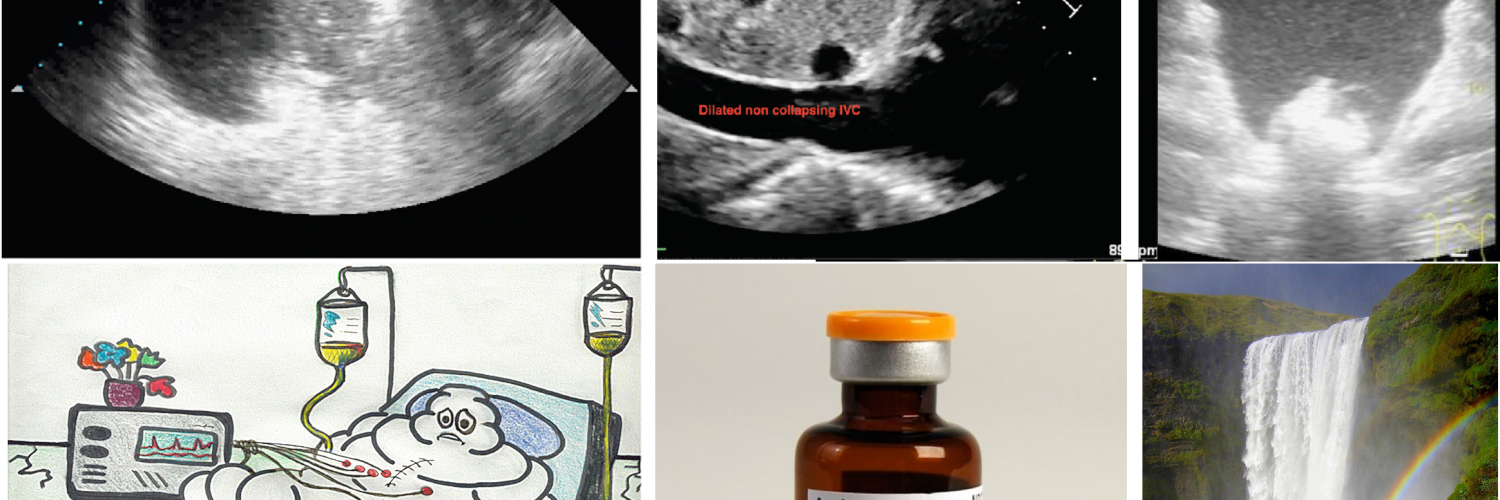
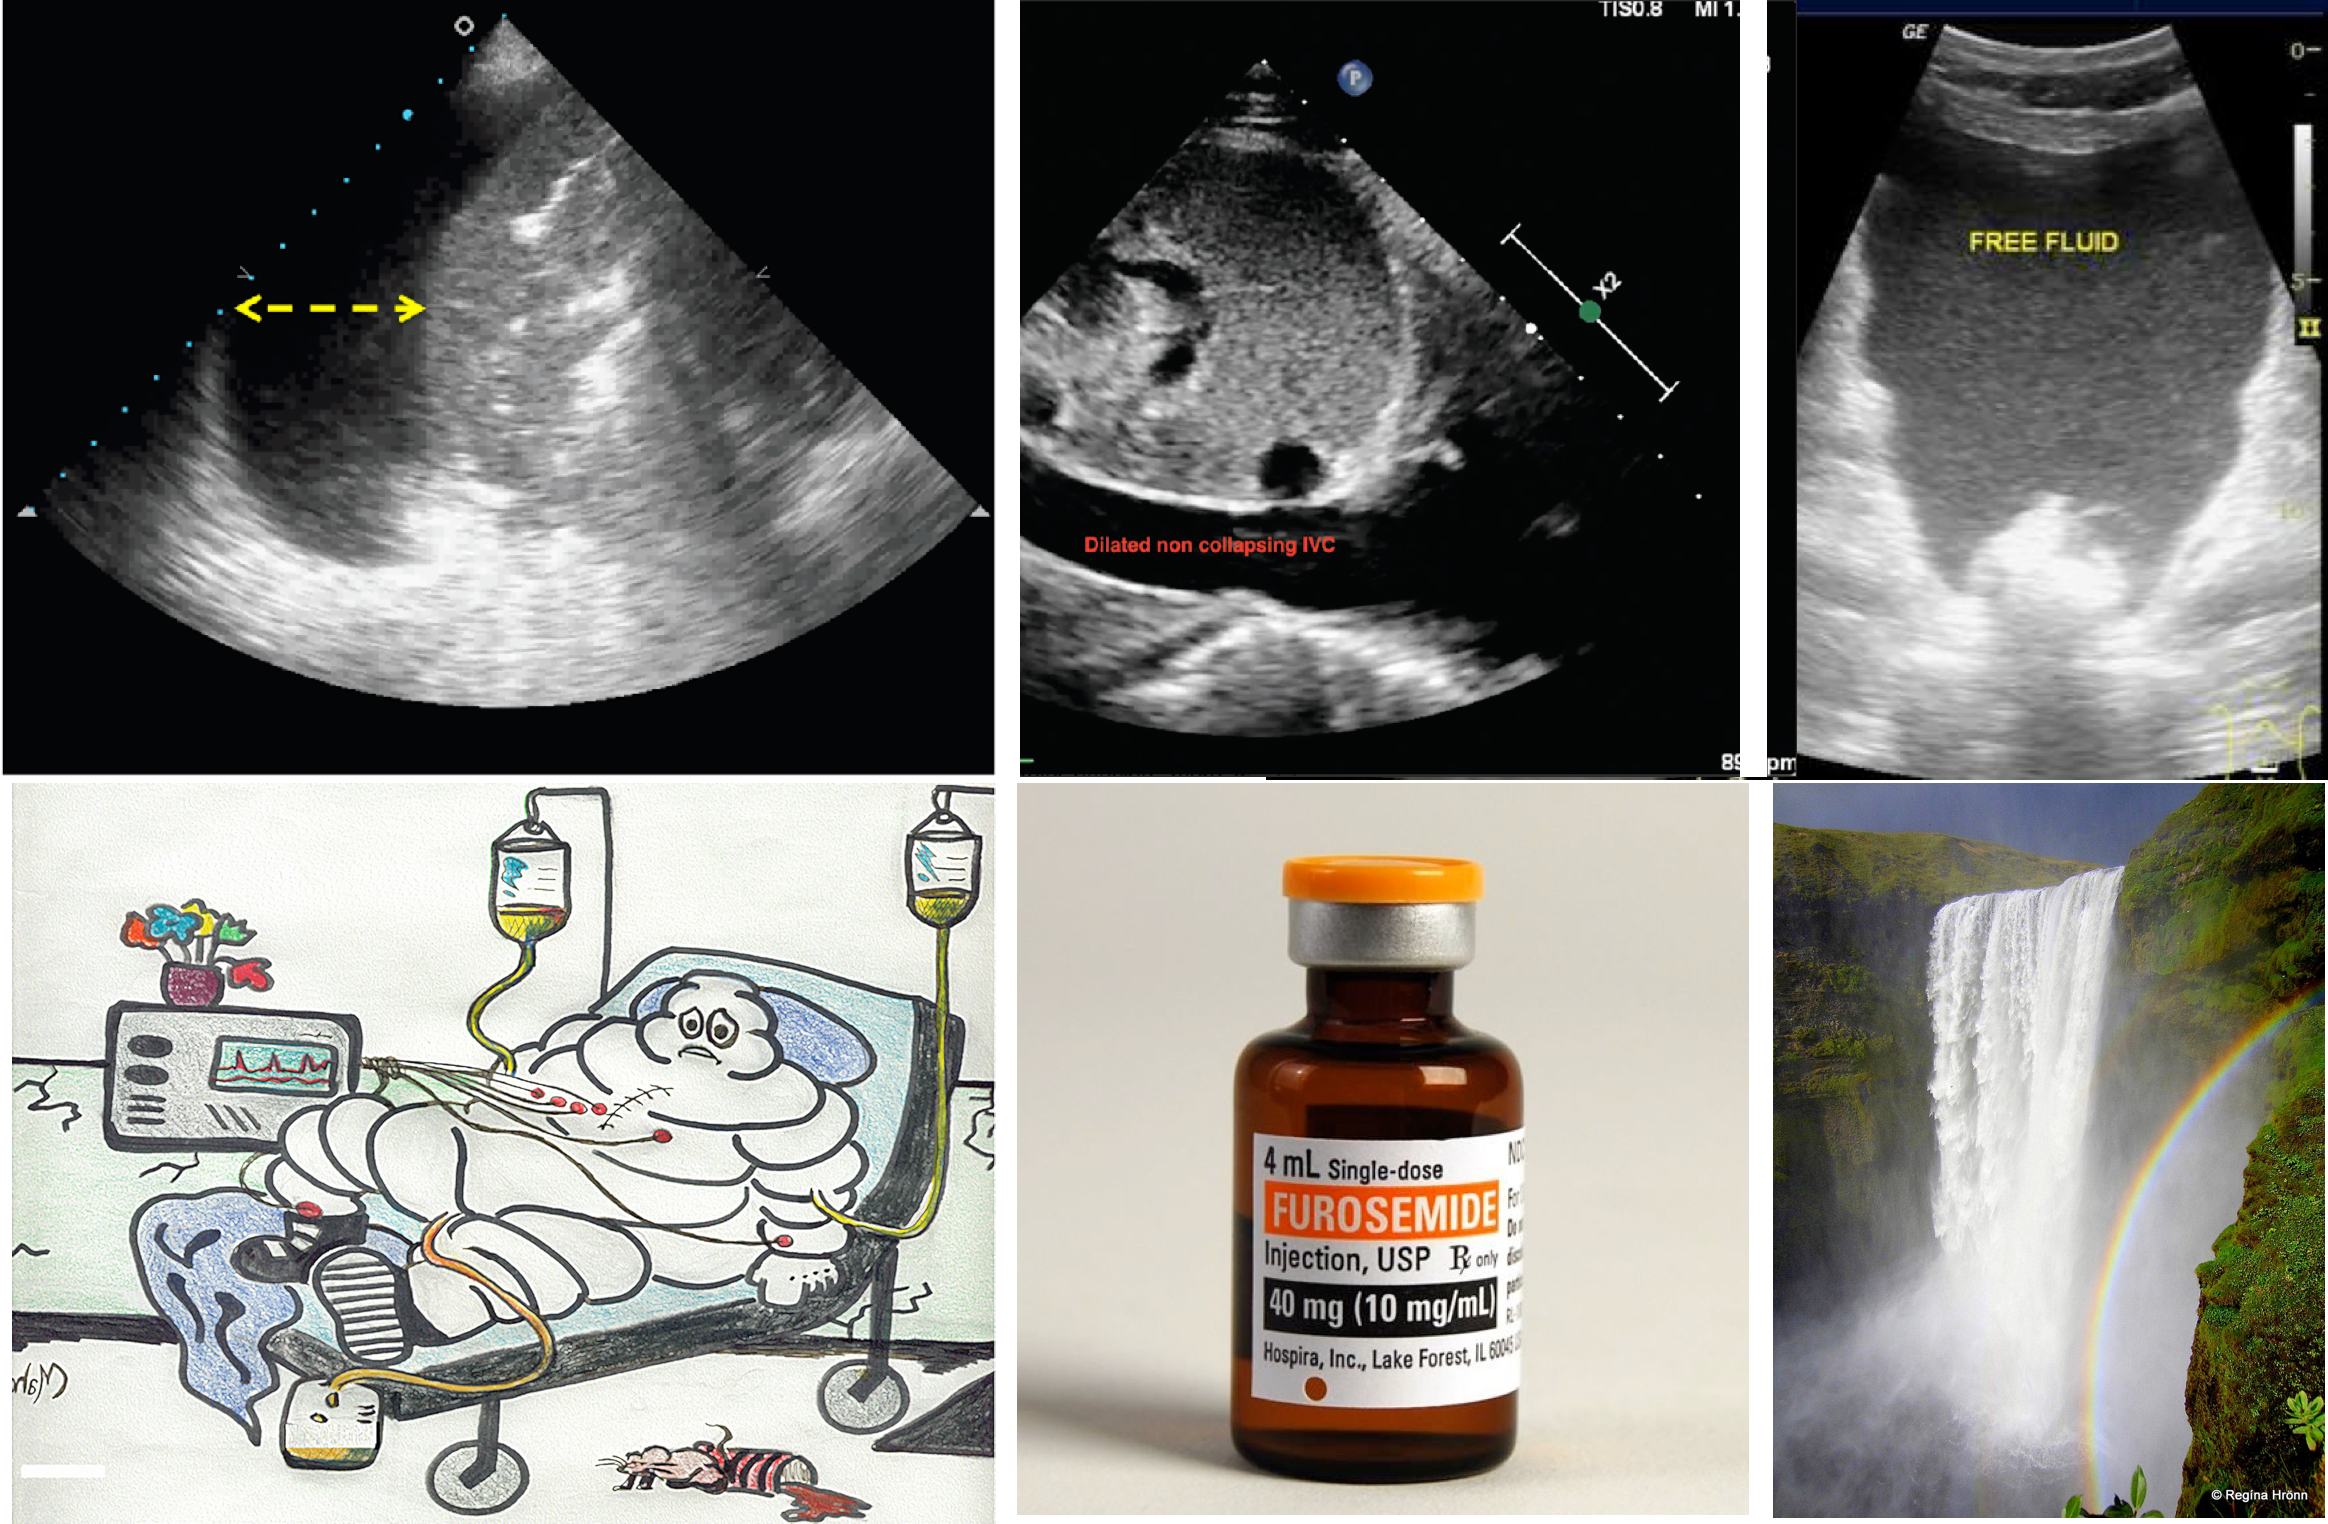
Fluid overload (sometimes termed “the Michelin man syndrome” ) with deleterious consequences on different organs is shown below.
Clinical manifestation
- Elevated left-sided filling pressures facilitate pulmonary congestion (i.e. interstitial and/or alveolar edema) leading to worsening respiratory status *.
- Increased right atrial pressure can be transmitted backward across the venous tree and lead to interstitial edema and congestive organ dysfunction manifested as:
- Pedal edema
- Delirium from congestive encephalopathy *, *
- Acute oliguric kidney injury with rising serum creatinine from congestive nephropathy *
- Right upper abdominal pain, transaminitis, and elevated total bilirubin from congestive hepatopathy *,*
- Gut edema resulting in increased endotoxemia (Leaky bowel syndrome) *, *
- Bowel wall edema may promote bacterial translocation and systemic inflammation, adding a component of vasodilatory shock.
- Ascites
- Pericardial effusion
- Pleural effusion
Evaluation
Assessment of hemodynamic status is fundamental to guide resuscitative efforts in a critically ill patient. A challenging aspect of a patient’s evaluation is determining what represents clinically significant hypervolemia.
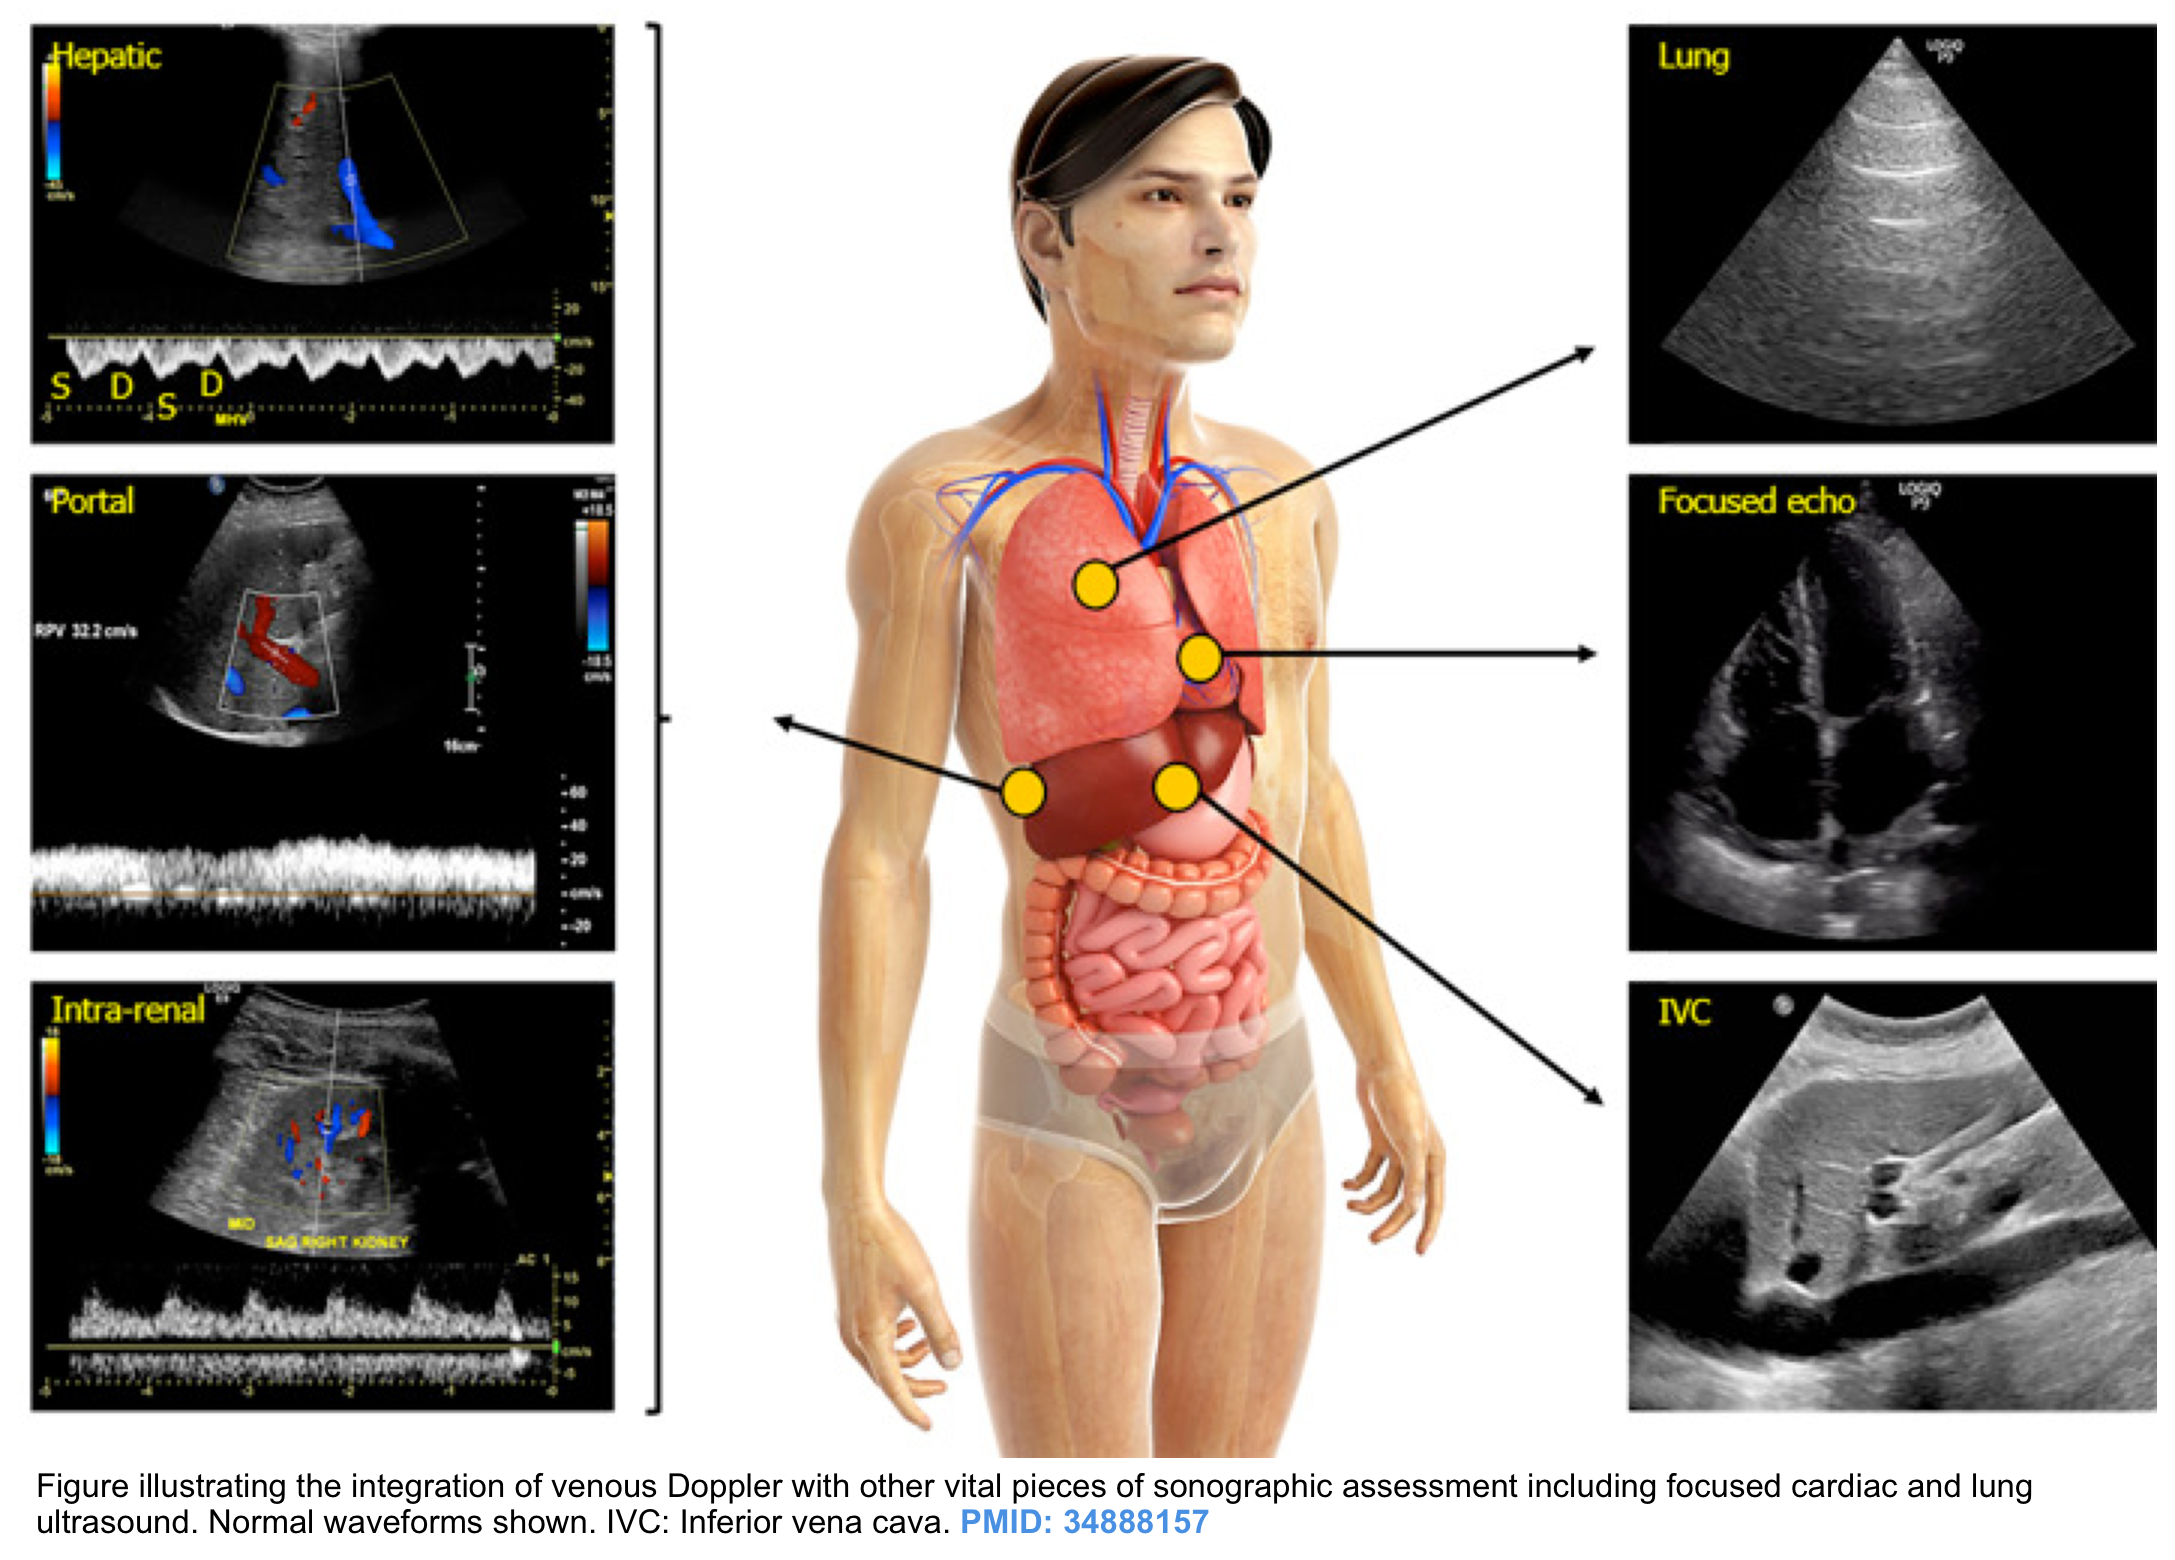
Different bedside methods have been employed for the assessment of hypervolemia but none of them are reliable alone. Rather, all relevant bedside ultrasonographic information should be integrated for the correct evaluation of the patient’s volume status * ( figure below).
- Performing a comprehensive hemodynamic assessment using POCUS in addition to conventional evaluation is vital in the management of critically ill patients as multiple hemodynamic alterations might be present simultaneously (the so-called pump, pipes, leaks strategy) *.
The limitations of some commonly used method for the evaluation of volume status is discussed here.
- Central venous pressure measurement:
- It is invasive and remains unclear what level of CVP is deleterious and may be considered a trigger for intervention *.
- Cumulative fluid balance, weight variations, and physical examination for peripheral edema:
- B-Lines on lung ultrasound:
- The presence of B-profile in critically ill patients is a rule rather than an exception!
- B-lines may not be a reliable sign of volume overload in the following conditions *
- Systemic inflammatory response syndrome for various reasons (e.g. infection, trauma, etc.) may result in B-profile irrespective of intravascular volume status.
- In patients with lower respiratory tract infection or those with interstitial lung disease such as idiopathic pulmonary fibrosis; B-profile is evident regardless of the patient’s volume status.
- B-profile as well as pericardial effusion are present in a patient who has undergone bypass surgery and this has nothing to do with the patient’s volume status.
- IVC diameter and dynamic measures of vena cava collapsibility
- How IVC ultrasound can be helpful?
- Assessment of IVC diameter and collapsibility can be helpful clinically if it is interpreted correctly!
- IVC indices are useful to eliminate either the possibility of “overt relative” intravascular hypervolemia or hypovolemia in a given patient *.
- A small IVC with CI > 50% suggests that overt hypervolemia is unlikely.
- A plethoric (> 20 mm) non-collapsible IVC (with CI <30%) suggests that overt hypovolemia is unlikely.
- How IVC ultrasound can mislead you?
- IVC ultrasound should always be performed as part of a comprehensive hemodynamic evaluation including bedside echocardiographic exam.
- A small IVC with CI > 50% is “Not Equal” to hypovolemia. Increased respiratory effort and abdominal compartment syndrome can cause highly collapsible IVC irrespective of volume status *.
- A plethoric non-collapsible IVC is “Not Equal” to hypervolemia. Upstream obstructive or cardiac pathologies can cause plethoric IVC regardless of volume status. These can include *
- Cardiac tamponade
- Chronic severe pulmonary hypertension
- Massive pulmonary embolism
- Severe valvular stenosis
- Right ventricle myocardial infarction
- Severe tricuspid regurgitation
- Constrictive pericarditis and restrictive cardiomyopathy
- Do Not target normalization of IVC diameter and collapsibility for all congestive states.
- Excessive volume removal in the above conditions is not recommended *, since elevated right atrial pressure (RAP) is required to maintain cardiac output (CO). On the other hand, progressive volume overload beyond what is needed to maintain CO will lead to an excessive increase in RAP, which can be transmitted to peripheral organs resulting in their dysfunction *.
- How IVC ultrasound can be helpful?
Doppler ultrasound of abdominal veins

- Recent studies have shown the usefulness of abdominal veins Doppler to quantify congestion at the organ level and the mechanism of organ injury*.
- A brief review of the principles of venous flow pattern is discussed here.
Background
- Veins are capacitance and floppy. In contrast to the arteries, they do not intrinsically show pulsating waveform on Doppler tracing. A useful framework for understanding the characteristics of spectral waveform patterns of veins is to classify the venous flow into 3 patterns:
- Central veins: These are close to the right atrium (IVC, IJV, and hepatic vein) so their spectral waveform reflects pressure changes in the right atrium. Hepatic vein tracing is described here as an example. The tracing is characterized as:
- Normal HV flow pattern consists of a positive (i.e. above the baseline) wave (A) that represents atrial systolic contraction, and two negative (i.e. below the baseline) systolic (S) and diastolic (D) waves.
- The right atrial pressure change is manifested as (a, S, and D wave on Doppler tracing, more on this here). Therefore this passive reflection of the right heart pressure changes produce a pulsating flow pattern.
- In a normal physiologic state, most of the venous return to the right atrium happens during ventricular systole; represented as S wave on tracing; (with only a minor fraction of venous return occurring during diastole, represented as D wave). This will account for the larger amplitude of the S wave than the D wave (i.e. S/D ratio ≧ 1).
- Respiratory variation of flow is present.
- Normal HV flow pattern consists of a positive (i.e. above the baseline) wave (A) that represents atrial systolic contraction, and two negative (i.e. below the baseline) systolic (S) and diastolic (D) waves.
- Peripheral veins: These vascular beds (e.g. intra-renal vein and upper/lower limb veins) are more distal to the heart and therefore the tracing will not directly reflect RAP variations (No a, S, and D waves) *.
- Waveform appears continuous and always above the baseline.
- Respiratory variation of flow is present.
- The velocity of the flow is lower relative to the larger central veins.
- Portal venous system
- The portal vein (PV) is part of a distinct venous system that is isolated from central veins by the hepatic sinusoids and from the arterial system by splanchnic capillaries. Therefore, the Doppler waveform of the normal PV will not reflect right atrial pressure variations.
- Waveform is characteristically continuous (or mildly pulsatile) and above the baseline.
- Central veins: These are close to the right atrium (IVC, IJV, and hepatic vein) so their spectral waveform reflects pressure changes in the right atrium. Hepatic vein tracing is described here as an example. The tracing is characterized as:
Effect of venous congestion on the flow pattern
- Generally, increased right atrial pressure can cause the following changes in the venous waveform pattern:
- Decreased respiratory variation of flow velocity.
- Central veins: (S/D<1).
- Increased right atrial pressure will hinder the systolic venous return to the heart (S wave is dampened). In such conditions, most of the venous return to the right atrium happens during ventricular diastole (D>S). Progressively increasing right atrial pressure eventually causes systolic flow reversal.
- Peripheral veins: Increased pulsatility index
- The same physiologic principles are working here as well. Impaired venous return during systole will change the normal continuous Doppler waveform of peripheral veins into a pulsatile waveform.
What is the impact of hypovolemia on venous flow pattern? 👉 (1)
Altered flow patterns in venous congestion
Doppler interrogation of the abdominal veins such as the hepatic, portal, and renal parenchymal veins in addition to inferior vena cava ultrasound provides useful insights into a patient’s hemodynamics when interpreted in conjunction with other sonographic parameters such as the cardiac pump function, lung ultrasound, and conventional clinical assessment.
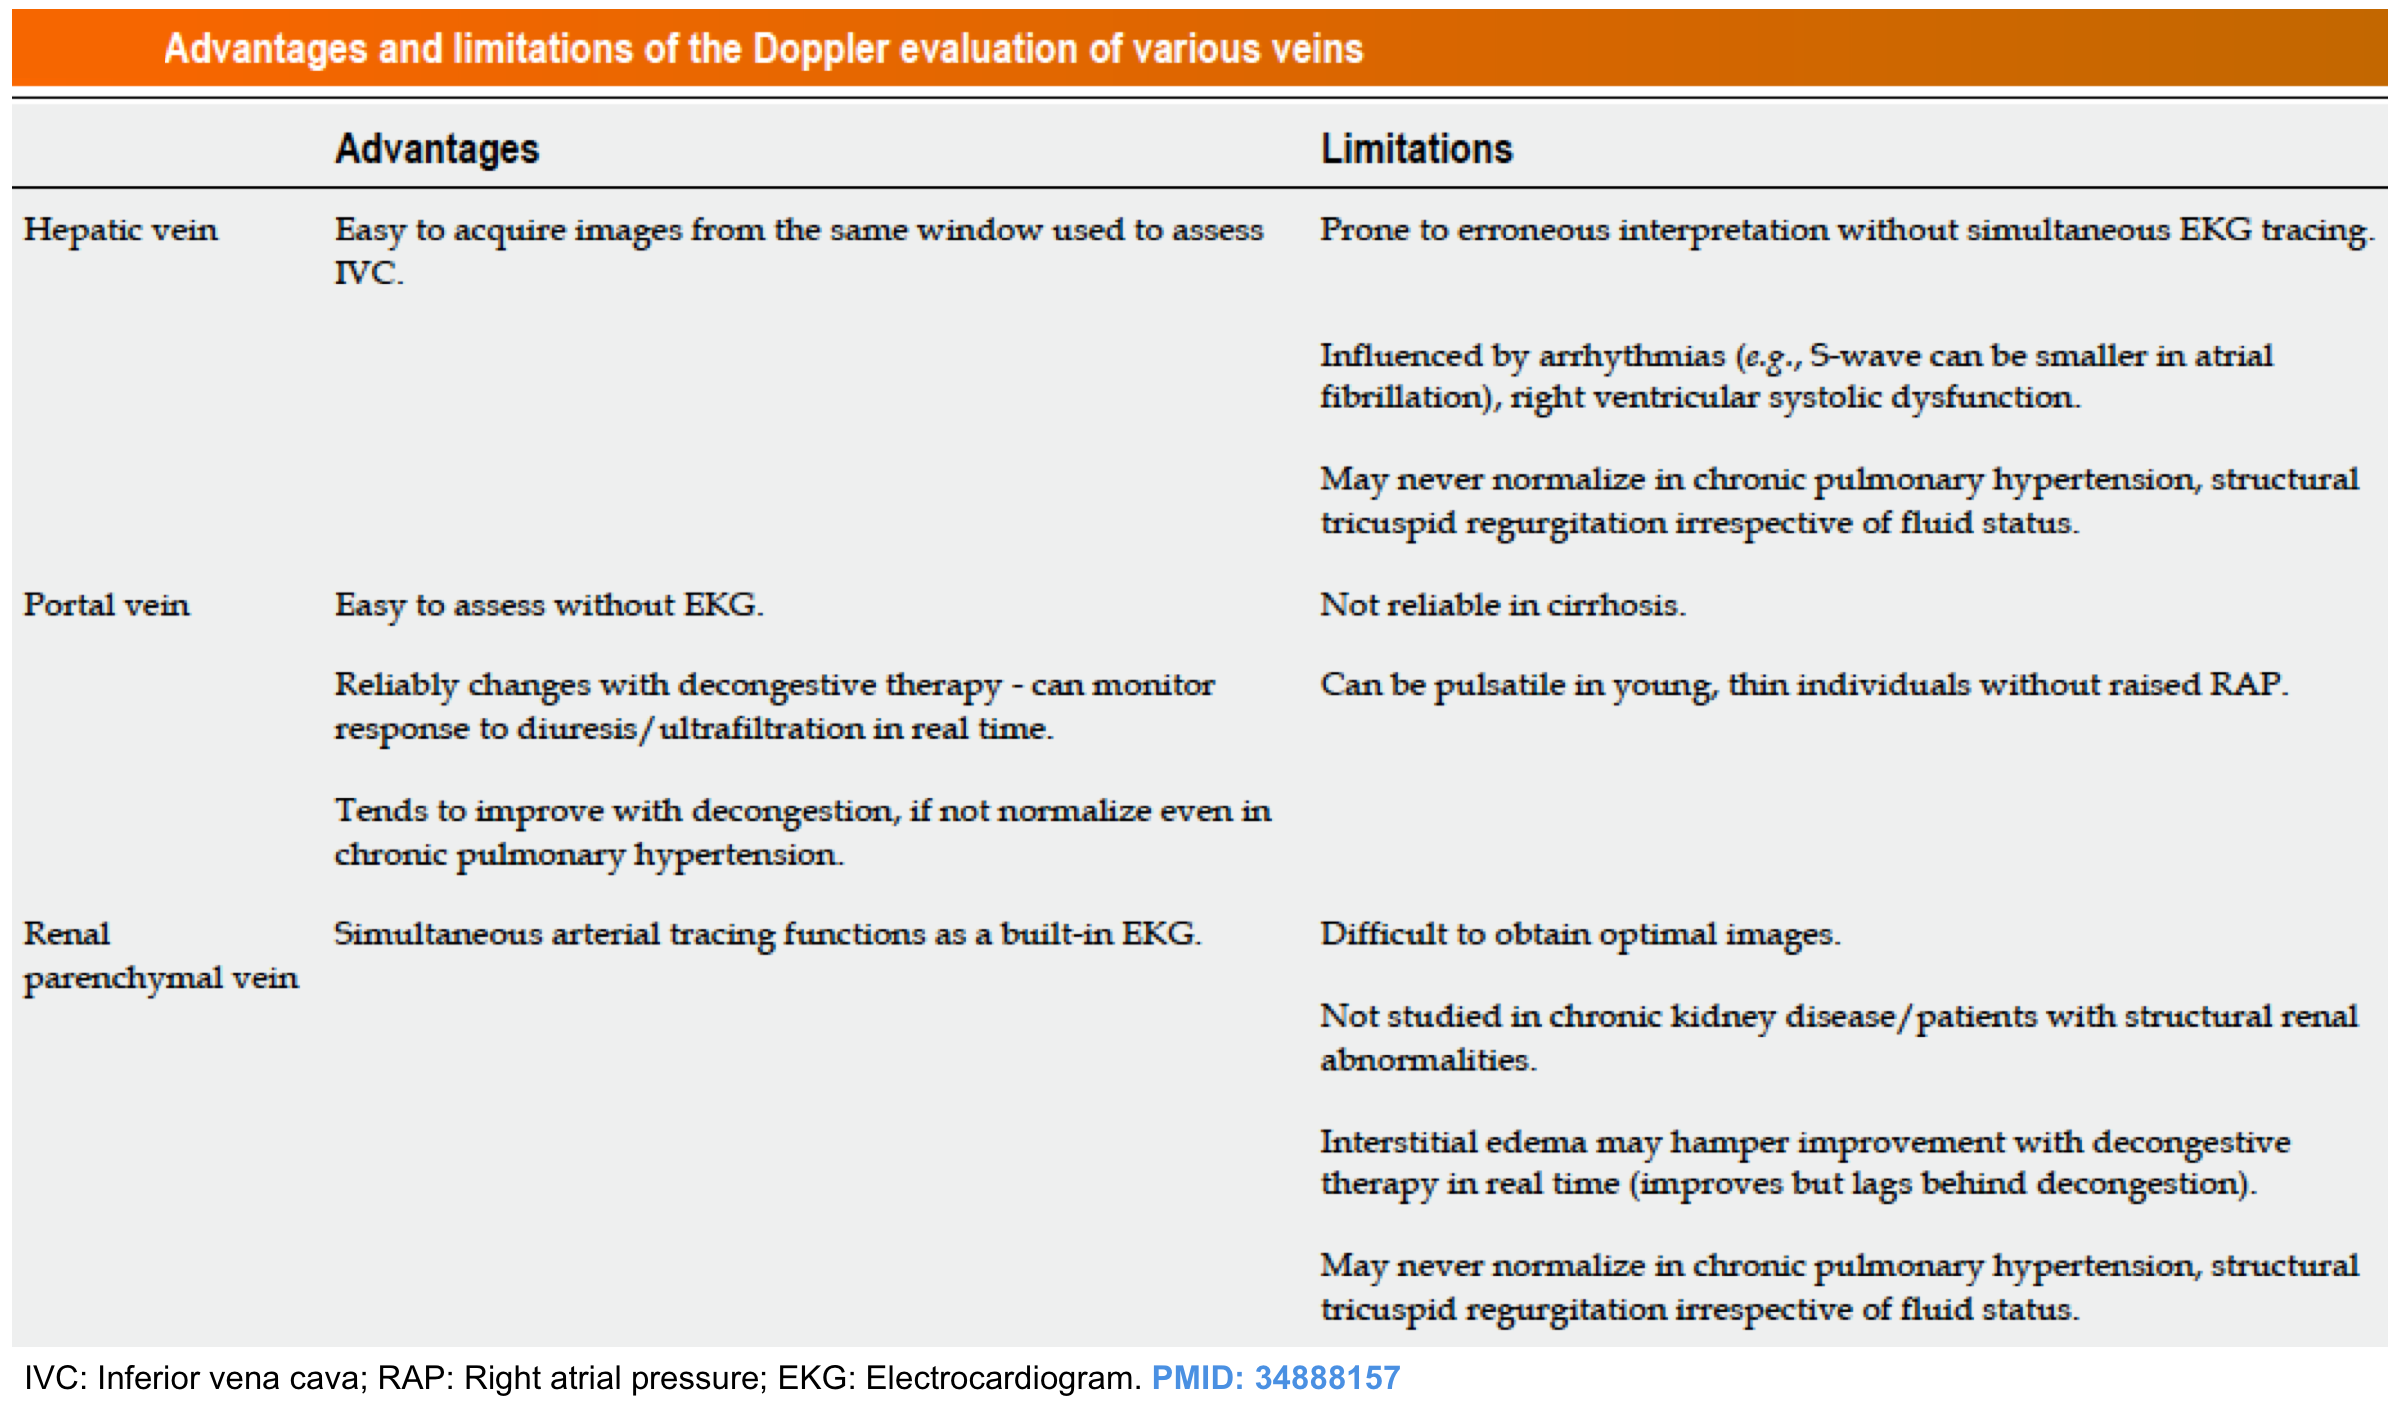
For potential advantages and limitations of Doppler evaluation of various veins refer to Appendix 1.
- Hepatic vein (HV) Doppler alteration
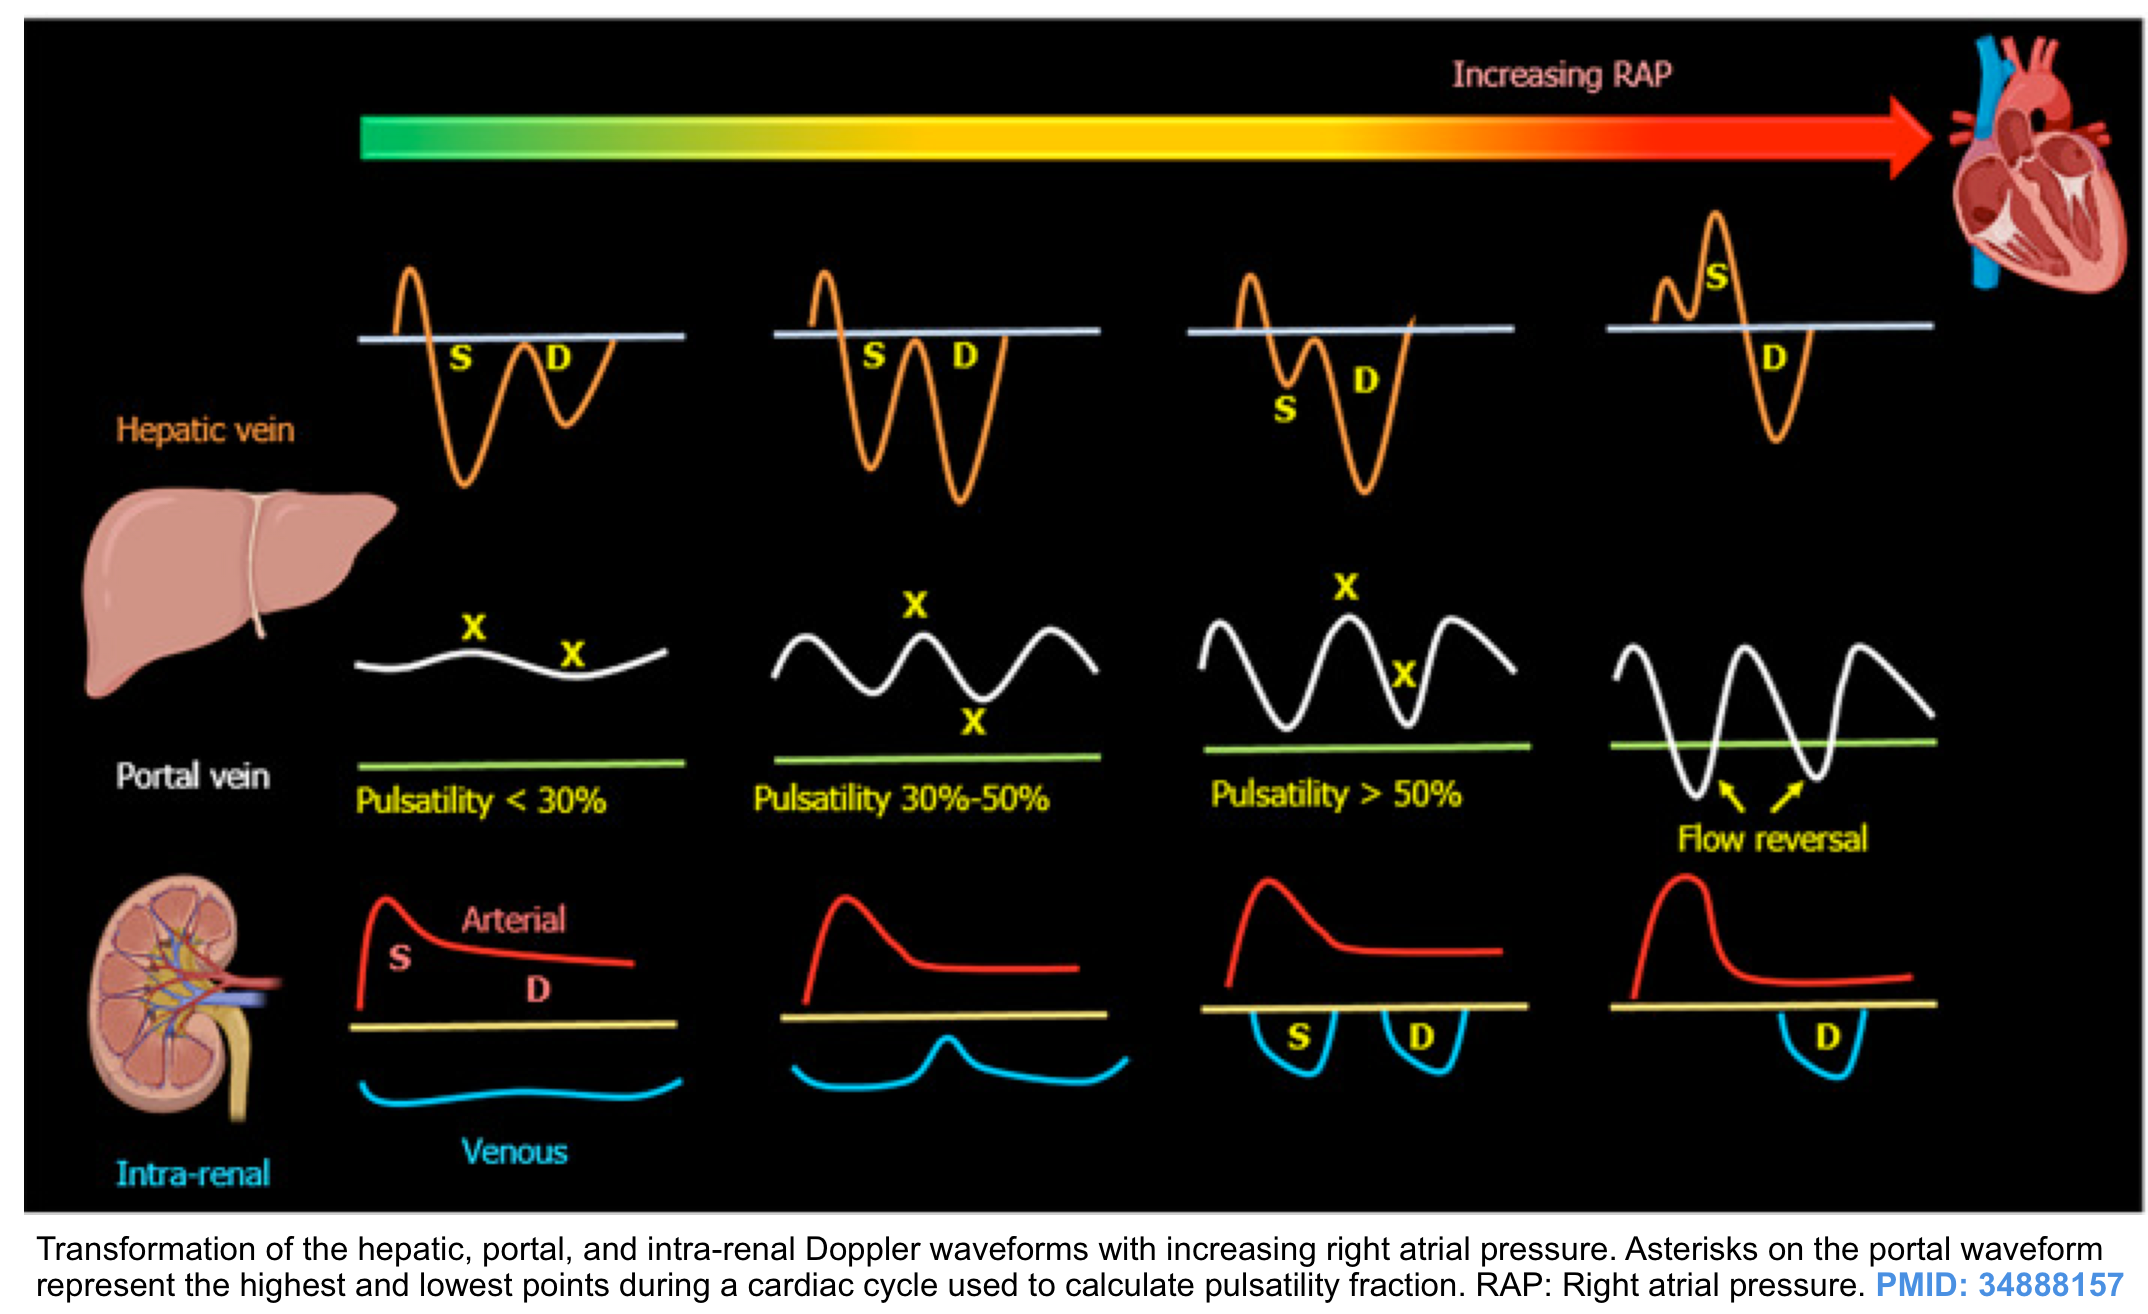
- As right atrial pressure increases, the pressure is transmitted to the hepatic vein, resulting in blunting of the forward systolic flow (S<D). With worsening congestion, the S-wave can be obliterated or become reversed if severe tricuspid regurgitation is present *.
- HV alterations have been shown to correlate with increased adverse kidney events including acute kidney injury (AKI) in recent studies *, *.
- Portal vein (PV) Doppler alteration
- The main alteration in the PV waveform is a progressive increase in pulsatility with elevated RAP. This can be quantified by the pulsatility fraction [(Vmax-Vmin/Vmax) × 100]; a pulsatility fraction ≥ 30% is considered mild elevation while ≥ 50% is considered severe. Further increases in RAP may lead to flow reversal (below the baseline) during systole.
- It has been shown that PV pulsatility is associated with worse clinical outcomes in patients with decompensated heart failure * and cardiac surgery patients *.
- Intra-renal vein Doppler alteration
- The intra-renal venous Doppler pattern is continuous with respiratory variation. With increasing right atrial pressure, this pattern becomes biphasic and two distinct waves (S and D) can be observed. These waves are analogous to the
normal hepatic waveform and represent increased pressure transmission from the heart to the interlobar renal veins. - With worsening congestion (intracapsular tamponade) the S-wave can either become reversed or disappear (monophasic pattern).
- Multiple studies have shown that intra-renal venous Doppler alterations are strong predictors of adverse clinical outcomes in patients with compensated and decompensated heart failure, those undergoing cardiac surgery, patients with pulmonary hypertension, and right heart failure *.
- The intra-renal venous Doppler pattern is continuous with respiratory variation. With increasing right atrial pressure, this pattern becomes biphasic and two distinct waves (S and D) can be observed. These waves are analogous to the
Venous Excess Ultrasound (VExUS) Score
- A grading system for venous congestion has been developed recently by Beaubien‑Souligny et al, which quantifies systemic congestion using Doppler flow indices of the hepatic and portal vein in addition to inferior vena cava assessment.
- Download the pocket guideline for assessment of venous congestion here
- Grading of venous congestion can be assessed using the VExUS Score Calculator.
-
Conceptual review and case series PDF here.
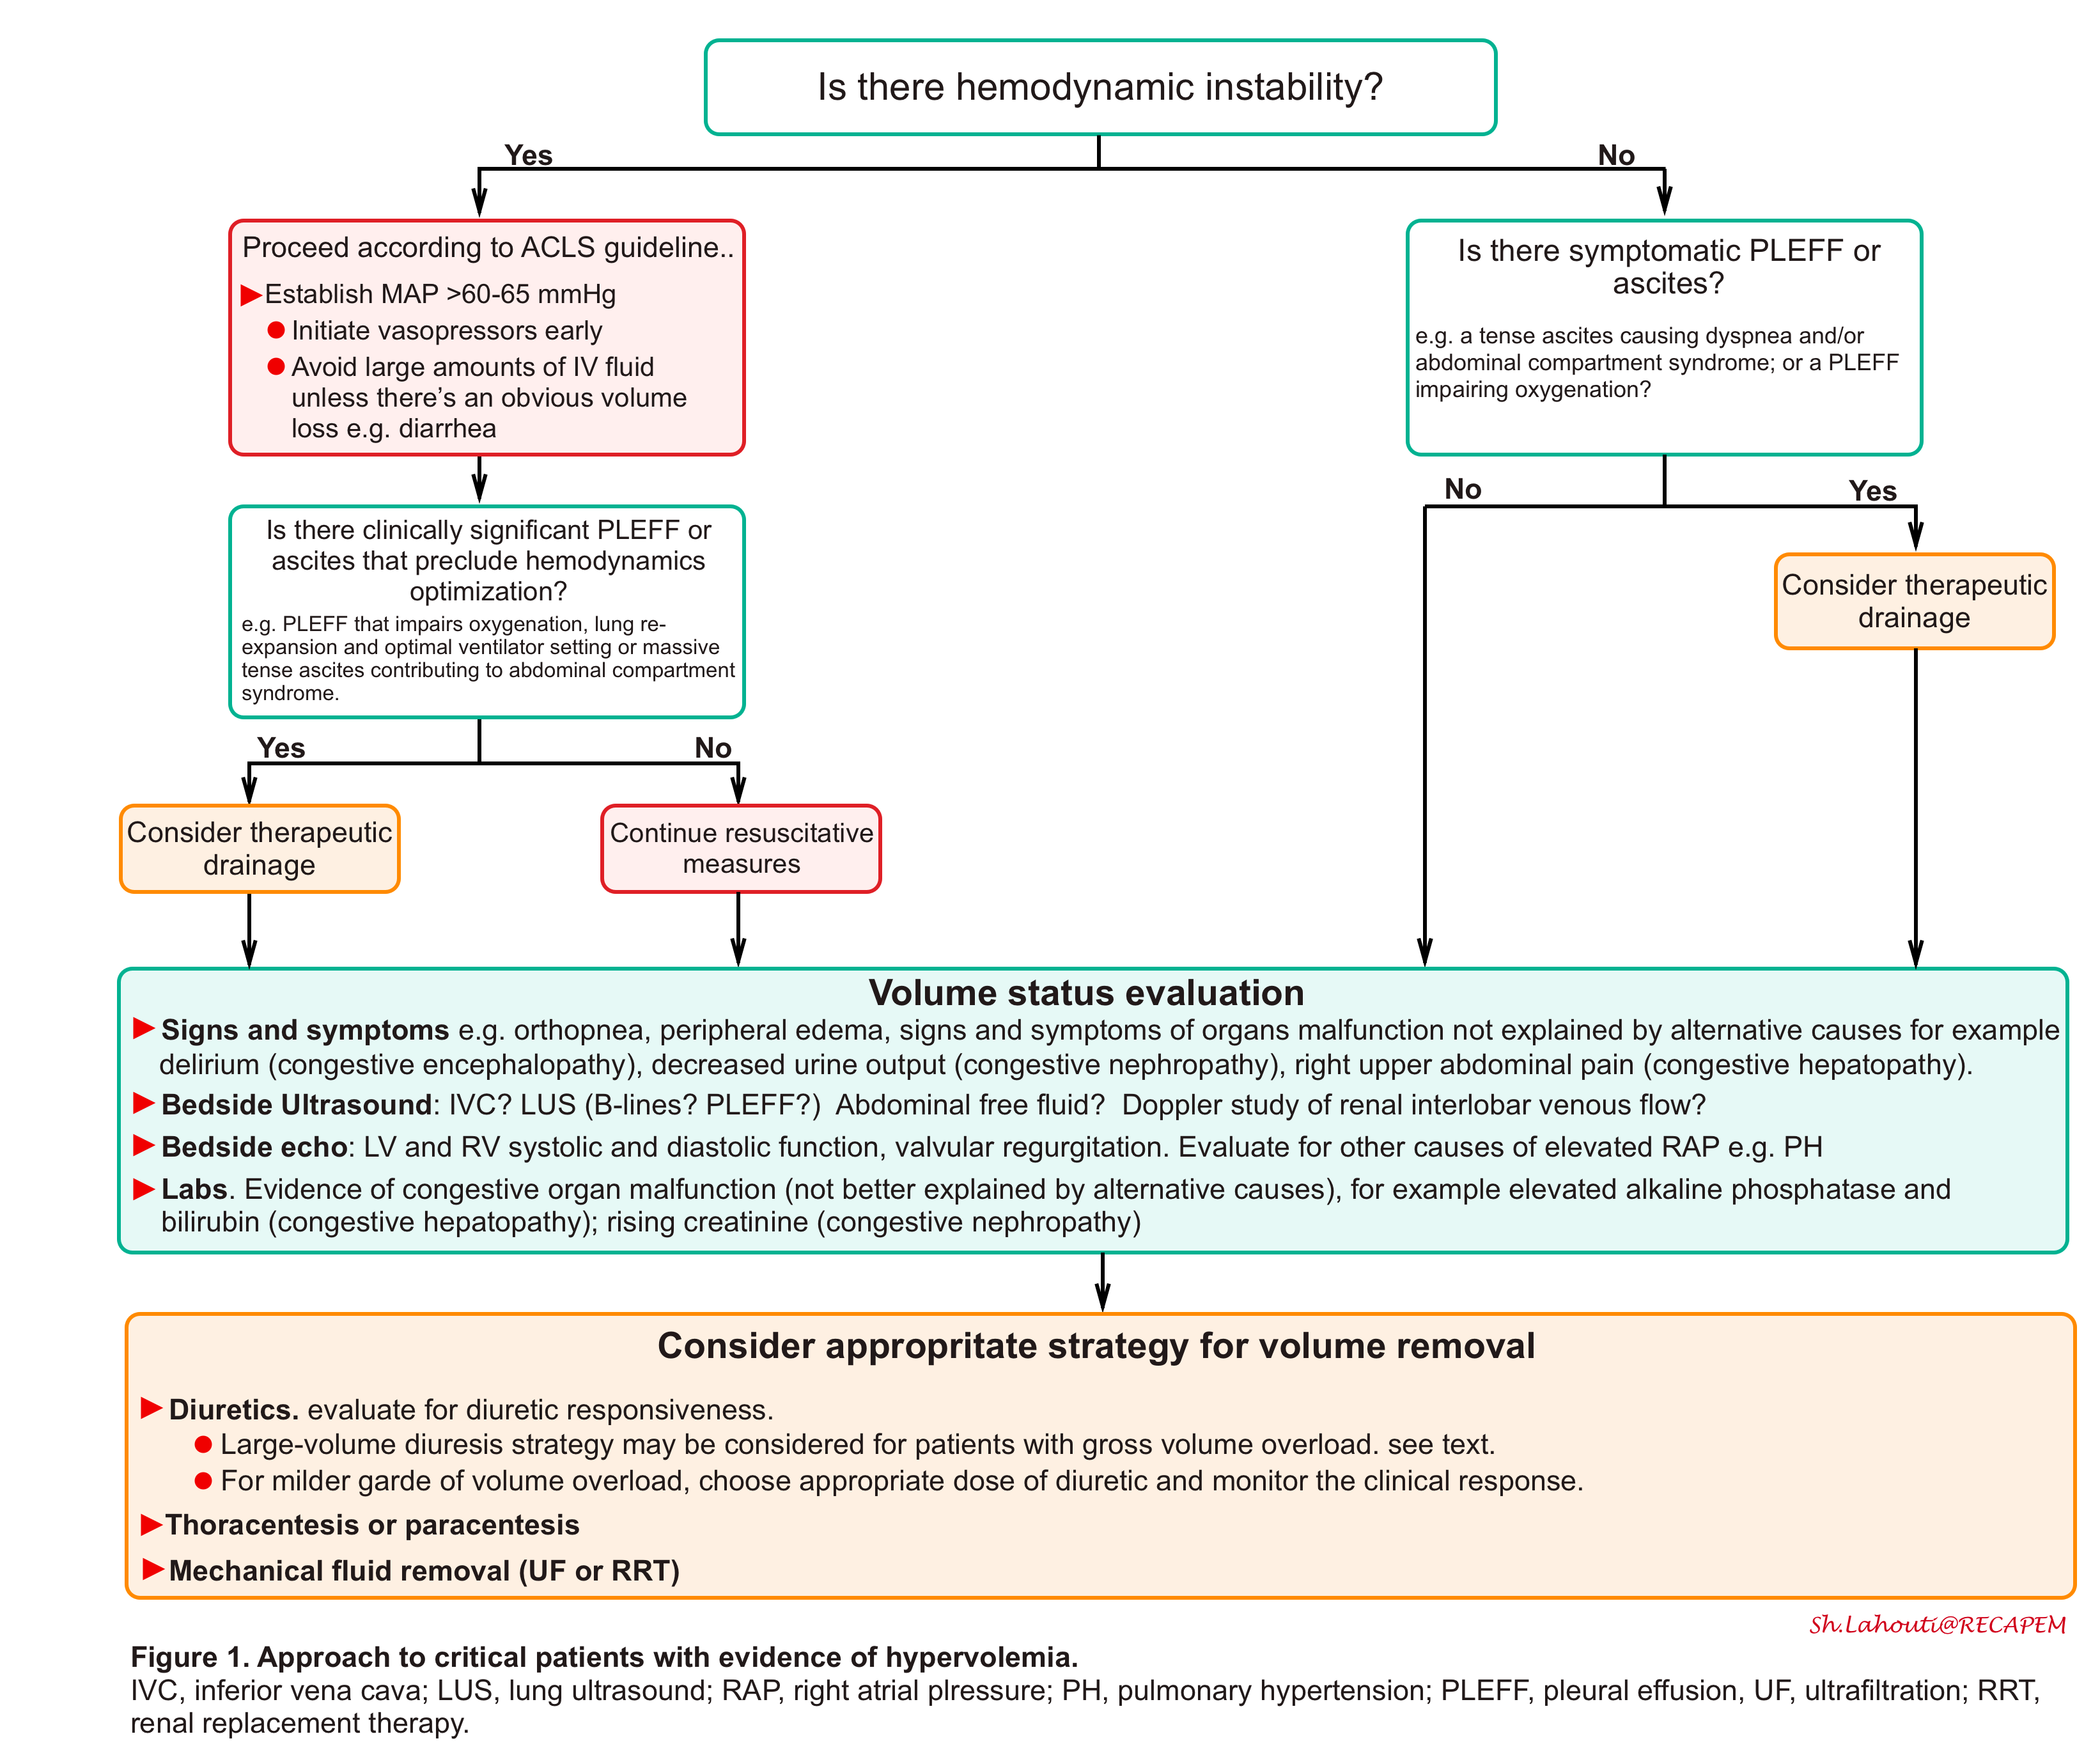
Approach to management of hypervolemia
The overall schema for diagnosis and management of hypervolemia (congestion) is represented in the following figure.
- Recognize and Identify circuits of hemodynamic instability. Perform a comprehensive POCUS ( the so-called pump, pipes,
leaks strategy) *. - Protect MAP. Avoid excessive fluid boluses and initiate vasopressor early.
- Drain symptomatic pleural effusion or ascites.
- Recognizing hypervolemia (volume overload) and identifying the culprit pathophysiology (i.e. whether hypervolemia is contributive to congestive symptoms or volume redistribution?) as a treatment strategy is fundamentally different.
- Determine the urgency of volume removal (e.g. urgent for in extremis patient with critical hypervolemia).
- Choose an appropriate fluid removal strategy.
- Closely monitor hemodynamics, fluid, and electrolyte balance.
Volume removal from pleura and peritoneum
Pleural effusion
- Pleural effusion (PLE) is common in critically ill patients, with a reported prevalence of approximately 60% *.
- The presence of a clinically significant amount of pleural effusion can impair oxygenation, and ventilation * and can even impair hemodynamics *. Tamponade effect on the heart has been described with massive pleural effusion *,*,*.
- Diuresis to remove fluid from pleural space is only effective in patients with transudative, cardiogenic effusions, though it occurs gradually.
- Exudative effusions can not be diuresed off at all. The primary management of mild (asymptomatic) exudative pleural effusion involves treating the underlying cause of effusion.
- Bedside ultrasound is helpful to determine both size (media 1) and nature of pleural effusion (see appendix 2) *.
Thoracentesis
- Indication for therapeutic thoracentesis. It is considered for “moderate-large” pleural effusion with any of the following characteristics:
- Exudative pleural effusion
- Symptomatic effusion (e.g. dyspnea, pleuritic chest pain, fatigue due to hypoxemia, and cough).
- Recurrent symptomatic pleural effusion
- Isolated pleural effusion. In the absence of simultaneous total body volume overload (peripheral edema), large-volume diuresis frequently leads to hypovolemia. Therefore thoracentesis should be considered.
- Volume of fluid removal
- Traditionally, fluid removal in one session was limited to 1500 mL to avoid re-expansion pulmonary edema *.
- Large volume thoracentesis (LVT) refers to the removal of more than 1.5 L of pleural fluid during a therapeutic thoracentesis. It is indicated in the presence of dyspnea due to a moderate to large pleural effusion *.
- The contraindications for LVT include:
- Hepatic hydrothorax
- Effusion associated with nonexpendable lung (NEL) *.
- NEL refers to the inability of the lung to fully re-expand after thoracentesis.
- It occurs most commonly following treatment of an underlying inflammatory or infectious condition of the pleura.
- Diagnosis is suggested when a therapeutic thoracentesis does not improve dyspnea and when fluid is replaced by air after thoracentesis on chest imaging (“pneumothorax ex vacuo”).
- The contraindications for LVT include:
- It is the accumulation of transudative fluid in the pleural space in the absence of cardiac, pulmonary, or pleural disease.
- Symptomatic hydrothorax can manifest with dyspnea, a nonproductive cough, pleuritic chest pain, and fatigue due to hypoxemia.
- The first-line management of hydrothorax is based on controlling ascites with diuretics and/ or LVP (chest tube insertion is contraindicated) *.
- Refractory hydrothorax: Persistent pleural effusion despite successful treatment of ascites *.
- Therapeutic thoracentesis is required to provide symptomatic relief from dyspnea but the effect is transient.
- TIPSS can be considered either as a definitive treatment or as a bridge to transplantation in patients with refractory hydrothorax.
Diuresis
- In the absence of indications for thoracentesis (above), diuretics can be used for removing transudative pleural effusion.
Ascites
- The presence of clinically significant amounts of ascites can cause impaired gas exchange via mechanical impact on the thorax and also can cause abdominal compartment syndrome.
- Increased intra-abdominal pressure can impair the perfusion of visceral organs such as the kidney.
- Bedside ultrasound is helpful in detecting even grade 1 ascites.
- Classification of ascites by fluid volume:
-
- Mild ascites (grade 1) are detectable only by ultrasonography.
- Moderate ascites (grade 2) can be detected on physical examination. The fluid volume is usually >500 mL.
- Severe ascites (grade 3). Large-volume ascites significantly limit the activities of daily life and cause abdominal distension accompanied by flattening of the umbilicus or umbilical hernia.
- Dyspnea indicates that the peritoneal fluid volume is large, up to ~5 to 15 L.
- Massive (tense) ascites: The abdomen is severely distended and painful.
-
- Classification of ascites by fluid volume:
- Diuresis to remove ascites fluid is only effective for transudative effusions due to cirrhosis.
- The maximum amount of fluid that can be diuresed safely per day is limited and variably depends upon the presence or absence of peripheral edema.
- When diuresis is induced, the fluid is initially lost from the vascular space; the ensuing fall in intravascular pressure allows the edema fluid to be mobilized to replete the plasma volume.
- Fluid mobilization can be rapid (in some cases, exceeding 2 kg per day without detectable intravascular volume depletion) in patients with peripheral edema *.
- By comparison, patients who only have ascites without edema can mobilize ascitic fluid solely via the peritoneum. The maximum rate at which this can occur is only 300 to 500 mL per day; more rapid fluid removal with diuretics (weight loss >0.75 kg per day) can lead to plasma volume depletion and azotemia *.
Paracentesis
- Indication for therapeutic paracentesis. It is considered for “moderate-large” ascites with any of the following characteristics:
- Exudative ascites
- Patients with very tense ascites. Tense ascites may increase intra-abdominal pressure and cause compartment syndrome. Such patients may not respond well to diuresis, due to renal dysfunction as well.
- Isolated ascites. In the absence of simultaneous total body volume overload (peripheral edema), large-volume diuresis frequently leads to hypovolemia.
- Refractory ascites
- Symptomatic hydrothorax
- Large volume paracentesis (LVP): Refers to paracentesis to remove > 5L of ascites.
- It is the standard of care for managing large-volume ascites both in conjunction with diuresis to relieve symptoms of a tense abdomen, as well as in the management of refractory ascites when diuretics become ineffective or the side effects preclude their continued use.
- All ascitic fluid should be drained to dryness in a single session as rapidly as possible over 1–4 hours assisted by gentle mobilization of the cannula or turning the patient onto their side, if necessary.
- Repeated low-volume paracentesis, is not recommended as it offers no additional benefits and carries a higher risk of procedure-related complications.
- The presence of spontaneous bacterial peritonitis (SBP) is not a contraindication for LVP.
- Albumin infusion:
- For large-volume paracentesis, an albumin infusion of 6 to 8 g/L of fluid removed is recommended.
- Plasma volume expansion is not necessary for paracentesis of < 5L unless there is evidence of acute liver failure.
👉Other indications for albumin infusion. Patient with ascites fluid PMN > 250 cells and clinical suspicion of SBP; albumin infusion (1.5 g albumin/kg body weight within 6h of detection and 1.0g/kg on day 3) is recommended when:
- Serum creatinine > 1mg/dL
- BUN > 30mg/dL
- Total bilirubin > 4mg/dL
Diuresis to remove ascites
- In the absence of indications for therapeutic paracentesis (above), the initial management is as follows:
- Sodium restriction plus
- Diuresis: Spironolactone 100mg (increasing to 400 mg/d), Plus furosemide 40mg (increasing to 160 mg/d).
- Fluid restriction is not necessary unless serum sodium is < 125 mmol/L.
- Medication to be avoided: NSAID, ACEIs, or ARBs.
Diuretics
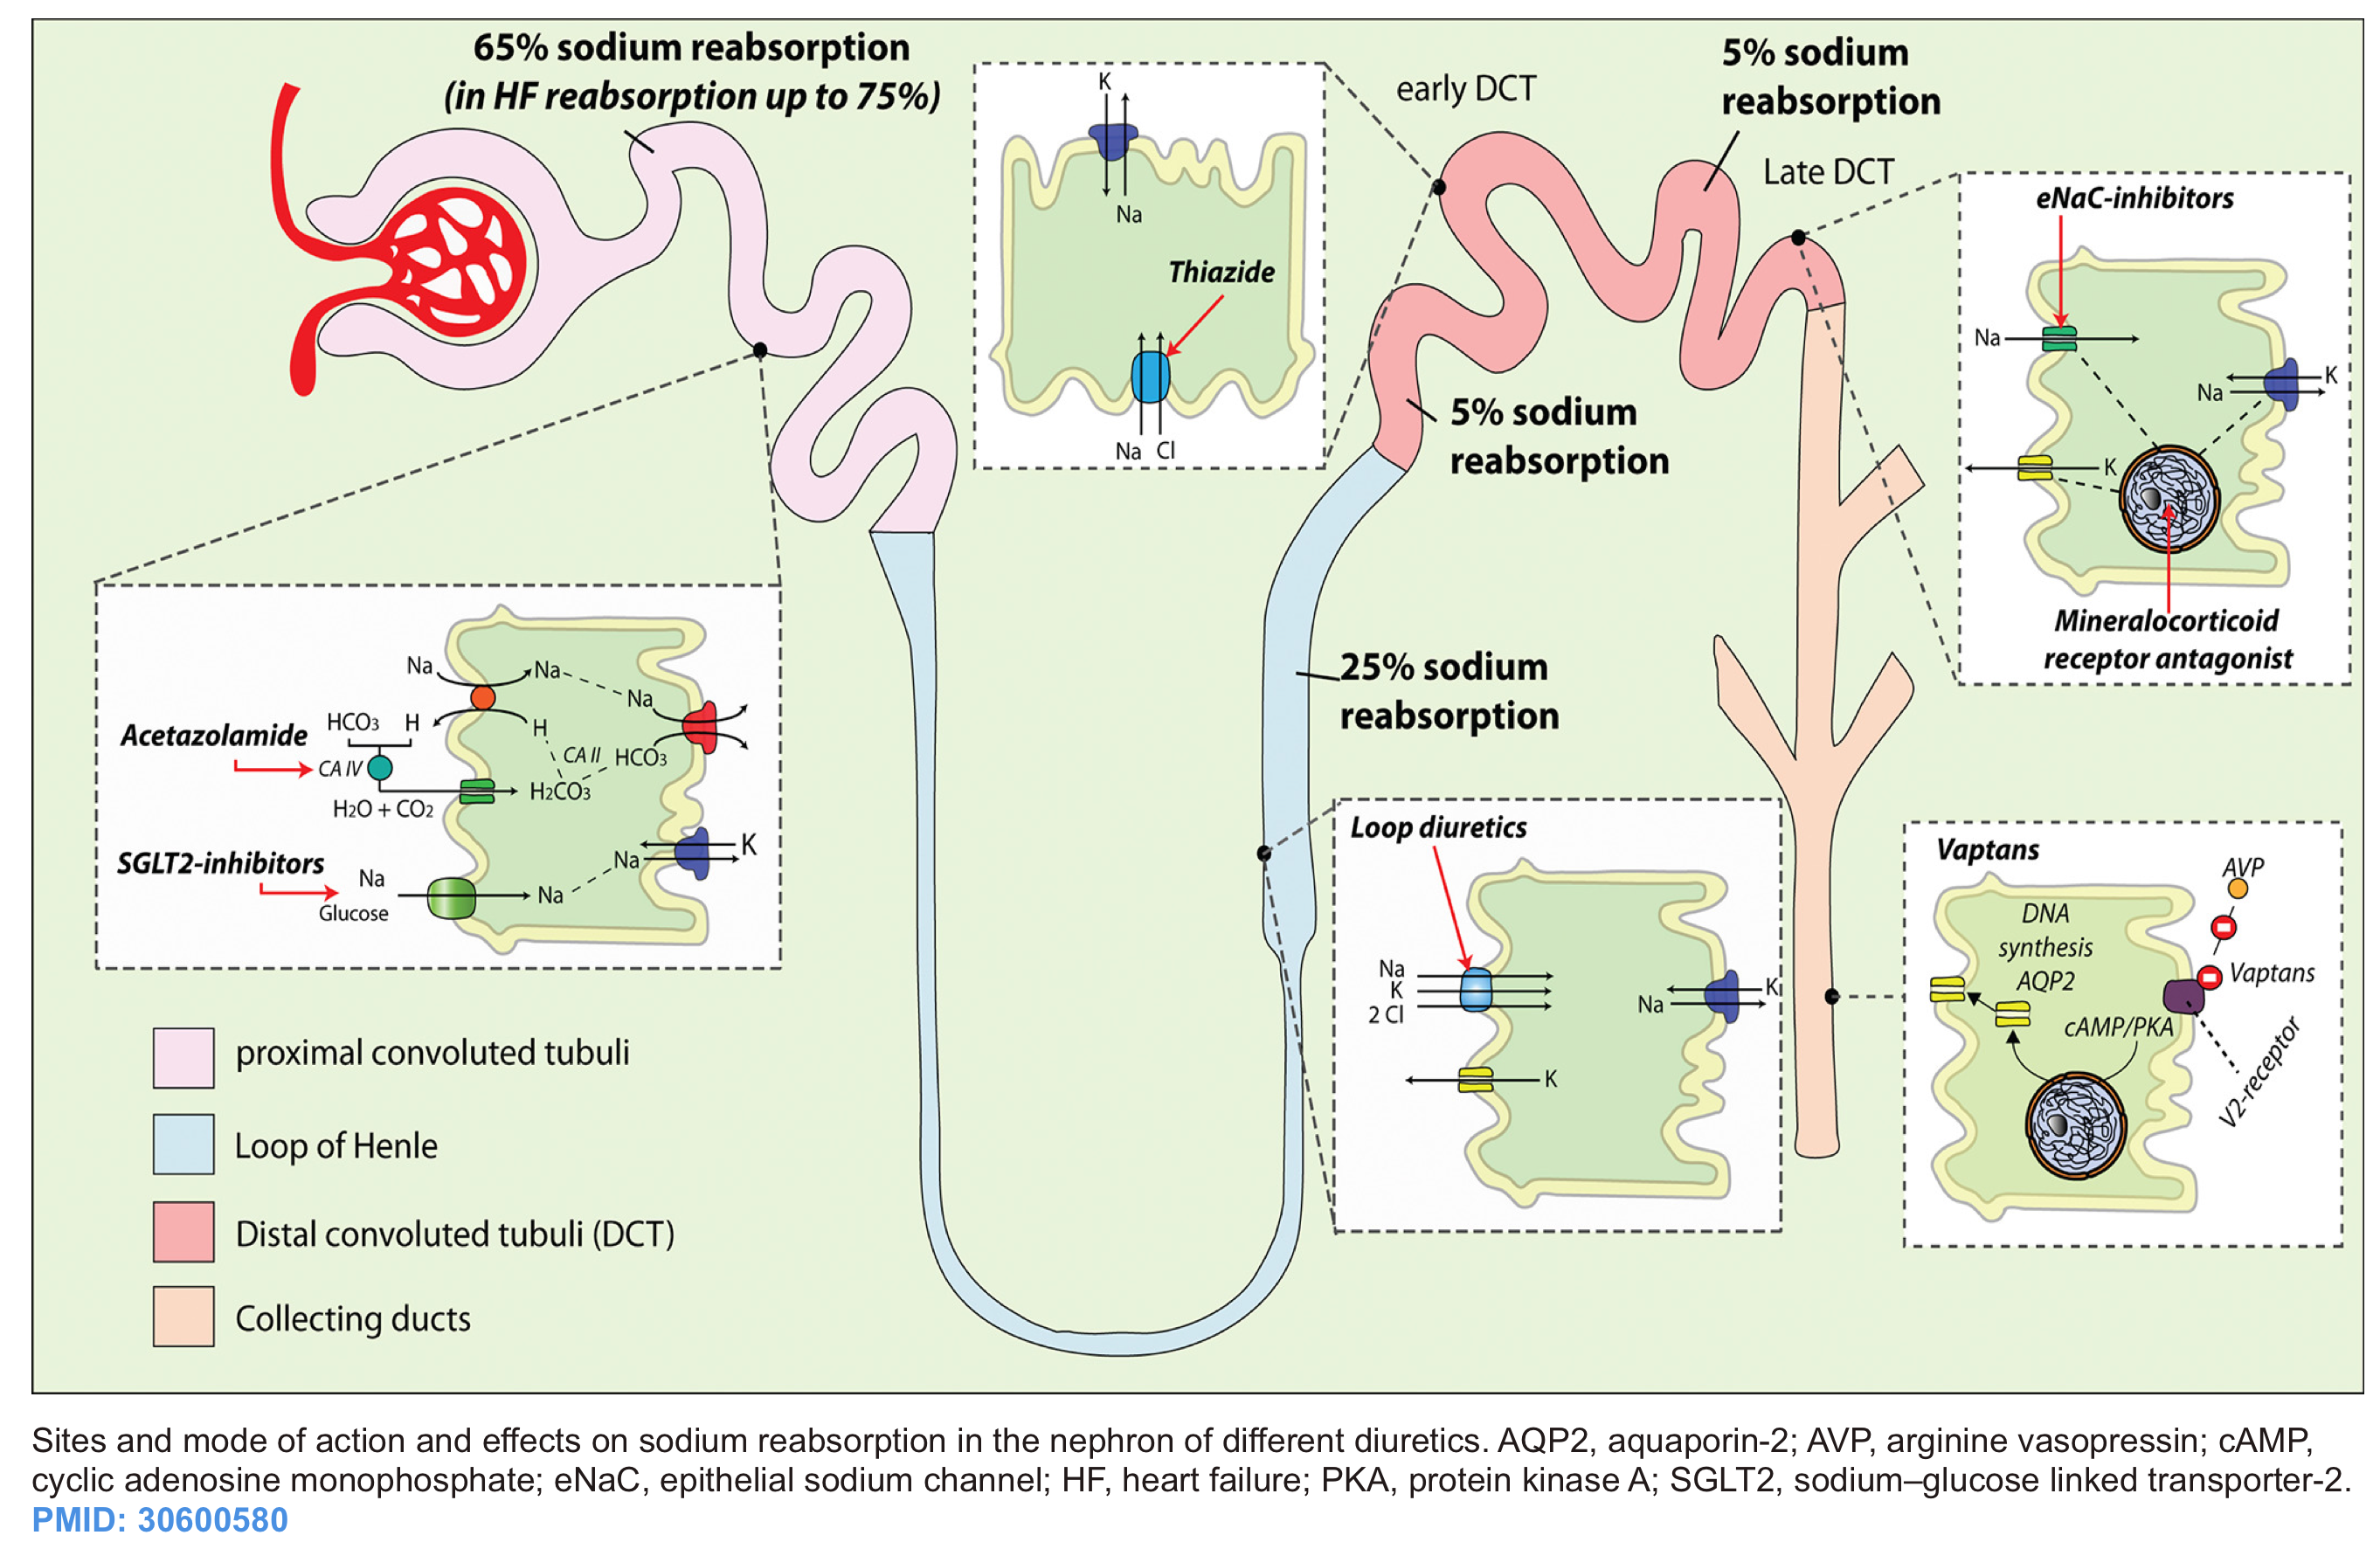
Saltwater retention expands the the intravascular volume, resulting in excessive extravascular fluid build-up. Other than ultrafiltration, the only pathway to get rid of salt water is through increased renal natriuresis and diuresis. Diuretics increase renal sodium and water output and are a cornerstone of therapy for some volume overload. Successful employment of diuretics requires a thorough knowledge of their pharmacokinetics and pharmacodynamics. The site of action of cellular mechanisms of different diuretics are shown below *.
Loop diuretics
- These form the backbone of diuretic therapy in most conditions associated with hypervolemia.
- Mechanism of action: Blockade of the Na/K/Cl channel, which is located predominantly on the thick ascending loop of Henle.
- Physiologic effects: Hypernatremia, hypokalemia, metabolic alkalosis, hypocalcemia and hypomagnesemia
- Pharmacokinetics
- Oral bioavailability
- Furosemide averages ~50% oral bioavailability, but is widely variable from 10-100% (so IV to PO conversion is very roughly 1:2).
- Bumetanide and torsemide have oral bioavailability >80% (so IV to PO conversion is 1:1).
- Peak drug concentrations are reached within 1 to 1.5 hours after the PO route while following an intravenous dose, peak action occurs after 30 minutes (for almost all loop diuretics).
- In patients with severe edema, the effect of furosemide may be altered due to inadequate gastrointestinal absorption. Patients unresponsive to oral furosemide should be switched to intravenous therapy or oral torsemide *. The bioavailability of torsemide is predictable. It is extremely well absorbed (80-90%), regardless of the presence of edema, because it undergoes substantial hepatic elimination.
- Half-life
- Furosemide (>95%) binds to plasma proteins. Protein-bound furosemide is delivered to the proximal tubule, and secreted via organic transporters that are expressed at the luminal site of action.
- Approximately 50% of the furosemide load is excreted unchanged in urine, and the rest is metabolized into glucuronide in the kidney. Thus, patients with renal dysfunction show a decreased response and increased plasma half-life of furosemide due to the reduction of urinary excretion.
- The half-life of the loop diuretics varies *
- Furosemide 1.5-2 hours. The half-life of furosemide is prolonged in advanced renal dysfunction (~3 hours).
- Bumetanide 1h. The half-life is extended in hepatic dysfunction (~2 hours).
- Torsemide 3-4 hours. The half-life of torsemide is doubled in hepatic dysfunction (~8 hours).
- Torsemide can be administered once daily while furosemide needs to be administered two or three times a day.
- Entry into the tubule
- Loop diuretics have high albumin binding (>90%), so they aren’t freely filtered into the tubule. In order to enter the nephron lumen, they must be actively secreted in the proximal tubule via organic anion transporters (OATs).
- Secretion is impaired in uremia due to competition for organic anion transporters with other organic anions which accumulate in renal failure.
- Oral bioavailability
- Pharmacodynamic
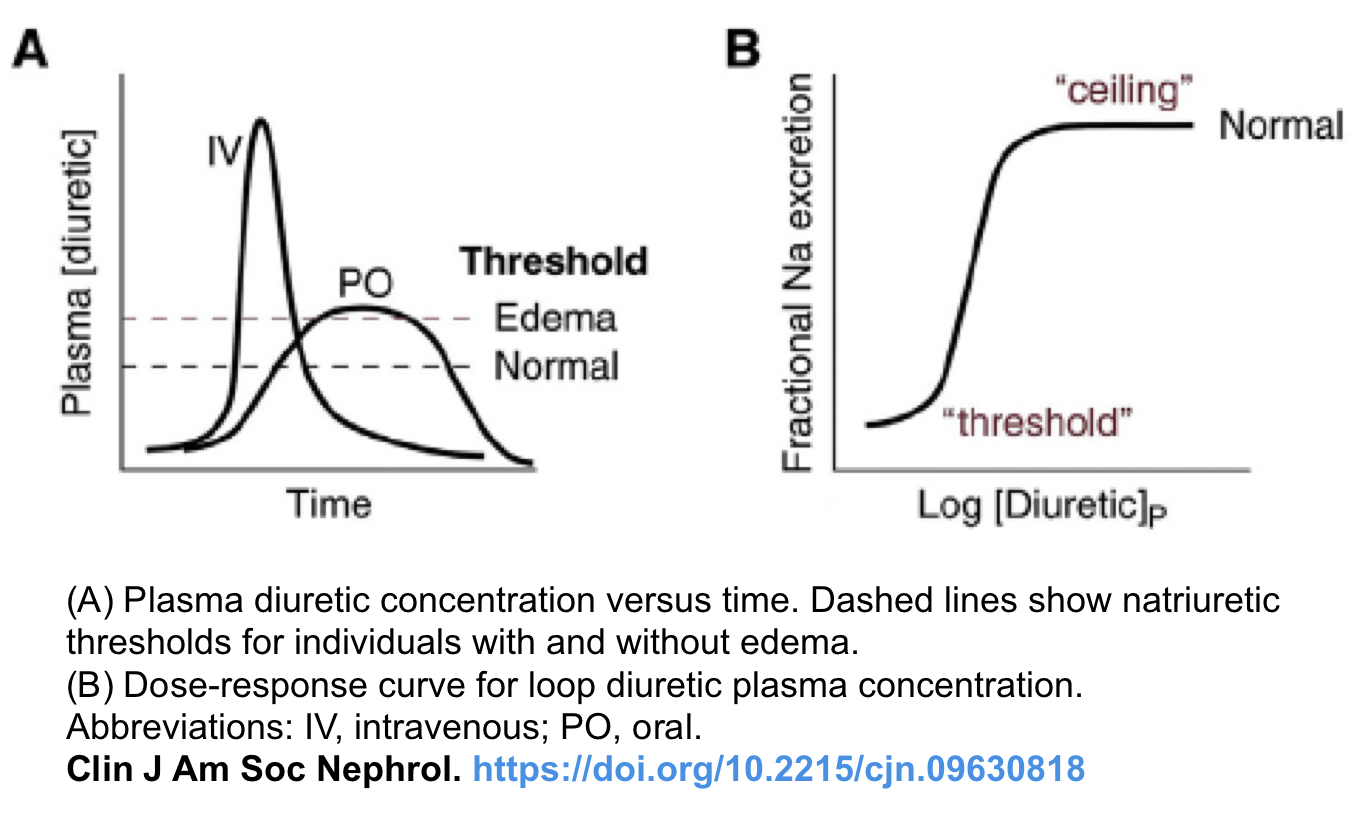
- Loop diuretics have a threshold and ceiling dose-response, and the dose-responsive effect is variable according to the clinical conditions (shown below) *.
-
- Threshold dose: Loop diuretics have a threshold dose; meaning that no diuretic effect is shown when the dose is lower than the threshold dose.
- Dose-responsive effect: The threshold dose of furosemide differs according to the clinical condition of the patient. For example, the threshold dose of intravenous furosemide is 10mg in a population with normal renal function. This increases to 80-160mg in patients with declining renal function. Therefore, furosemide doses lower than 80mg are not effective in advanced CKD patients.
- Ceiling dose: This is the dose that shows the maximum fractional sodium excretion, meaning that beyond a certain dose, additional drugs won’t increase the diuretic effect (although higher doses might have a more prolonged effect).
- The ceiling dose of intravenous furosemide also varies in different diseases; this dose is 80-200mg in patients with CKD or nephrotic syndrome and 40-80mg in patients with congestive heart failure or liver cirrhosis.
- Repeated infusions with the ceiling dose are more effective than increasing the dose of furosemide.
- Threshold dose: Loop diuretics have a threshold dose; meaning that no diuretic effect is shown when the dose is lower than the threshold dose.
- The proper dosing interval
- Furosemide will typically cause diuresis for <6 hours (“LASIX” was so named because it LAsts SIX hours, but this is based on oral pharmacokinetics). Thus, the initial natriuresis typically wanes within 3–6 hours, so that a single daily dose leaves some 16–21 hours for the kidneys to compensate for salt and water losses (“postdiuretic NaCl retention”).
- Post-diuretic renal sodium and fluid retention are inevitable. This compensatory sodium retention occurs along the other segments of the nephron that are not related to furosemide.
- To avoid this compensation, furosemide should be given more frequently (e.g. q8-12hr) or infused continuously (below).
- Co-administration of a long-acting thiazide (e.g. indapamide or metolazone) may help prevent sodium retention when the furosemide wears off, thereby facilitating effective diuresis.
- Furosemide will typically cause diuresis for <6 hours (“LASIX” was so named because it LAsts SIX hours, but this is based on oral pharmacokinetics). Thus, the initial natriuresis typically wanes within 3–6 hours, so that a single daily dose leaves some 16–21 hours for the kidneys to compensate for salt and water losses (“postdiuretic NaCl retention”).
- Bolus versus continuous infusion
- Background
- The physiologic rationale for a continuous IV infusion compared with bolus therapy is related to the maintenance of an effective rate of drug excretion and, therefore, inhibition of sodium chloride reabsorption in the loop of Henle over time. By contrast, bolus therapy is associated with initially higher and then lower rates of diuretic excretion; as a result, sodium excretion may be at near maximal levels for the first two hours but then gradually falls until the next dose is given.
- The efficacy of a continuous IV infusion compared with IV bolus therapy has been evaluated in randomized trials. A continuous IV infusion is associated with less ototoxicity * than bolus injections of loop diuretics, but clear evidence of greater diuretic efficacy is lacking.
- Therefore the choice of infusion vs. bolus diuretic depends largely on clinical condition; especially when frequent dose changes may be desired because of clinical instability, the continuous infusion is more suitable *.
- One possible approach to continuous infusion of loop diuretics is as follows:
- An IV loading dose of 40 to 80 mg of furosemide is typically given prior to initiating the continuous infusion. If the patient has received one or more IV boluses within the previous few hours, then an infusion can be started without a loading dose. After the loading dose, the starting infusion rate with furosemide varies with the level of kidney function:
- If the patient has an estimated GFR > 30 mL/min, an initial furosemide infusion rate of 5 mg/h can be used. If the diuresis is not sustained, a second bolus is given followed by a higher infusion rate of 10 mg/h. This rate may then be increased further to the maximum recommended furosemide infusion rate of 40 mg/h if the response to lower doses is poor.
- If the patient has severe kidney impairment (estimated GFR <30 mL/min), an initial furosemide infusion rate of 20 mg/h. If the diuresis is not sustained, a second bolus is given followed by a higher infusion rate of 40 mg/h.
- An IV loading dose of 40 to 80 mg of furosemide is typically given prior to initiating the continuous infusion. If the patient has received one or more IV boluses within the previous few hours, then an infusion can be started without a loading dose. After the loading dose, the starting infusion rate with furosemide varies with the level of kidney function:
- Background
Loop diuretic dose conversion
- Transition from IV to PO or vice versa:
- The bioavailability of furosemide “PO” is ~50%.
- So IV to PO conversion is very roughly 1:2. (e.g. 20mg IV furosemide ~ 40mg PO).
- The bioavailability of bumetanide and torsemide is high and oral and intravenous doses of these drugs are therefore roughly equipotent (so IV to PO conversion is 1:1).
- The bioavailability of furosemide “PO” is ~50%.
- Equivalent doses of different loop diuretics
- All of the loop diuretics produce the same response if given at equipotent doses.
- When kidney function is normal, a 40 mg IV dose of furosemide is approximately equal to 1 mg IV of bumetanide and 20 mg IV of torsemide.
- In patients with impaired kidney function, the normal dose ratio of furosemide-to-bumetanide falls from 40:1 to approximately 20:1 because of an increase in extrarenal bumetanide clearance in such patients *.
Dosing
- Starting dose
- Starting doses of loop diuretics vary according to the following factors:
- Cause of edema (e.g. heart failure vs., cirrhosis). In some patients with edematous states where renal perfusion is impaired and/or the activity of sodium retaining forces is increased ( high renin-angiotensin-aldosterone system activity as in cirrhosis); a higher doses of diuretics are required to induce effective diuresis.
- Presence of kidney function impairment.
- History of diuretic use (i.e. whether the patient is naïve to diuretics or is a chronic user of diuretics).
- Generally, higher doses are required in renal failure and in patients chronically exposed to furosemide.
- In fact, the starting dose is not particularly important, rather the empiric dose titration to achieve appropriate diuresis response is the key factor in the management of edematous states.
- A reasonable starting dose of loop diuretic (for hospitalized patients) might be:
- Patients not on chronic furosemide: 20-80 mg IV depending on the renal function & acuity of the situation.
- Patients on chronic oral furosemide: an IV dose equal to or a bit higher than the patient’s home oral furosemide dose can be given.
- In most patients with cirrhosis, furosemide (or equivalents) should be combined with spironolactone at a ratio of 40 mg of furosemide to 100 mg of spironolactone; the dosing ratio should be adjusted based on the plasma potassium concentration *.
- Starting doses of loop diuretics vary according to the following factors:
- Maximum effective doses
- The maximum effective diuretic dose is defined as the dose that achieves the maximal peak rate of sodium excretion. This dose differs in patients with heart failure, cirrhosis, nephrotic syndrome, and reduced GFR.
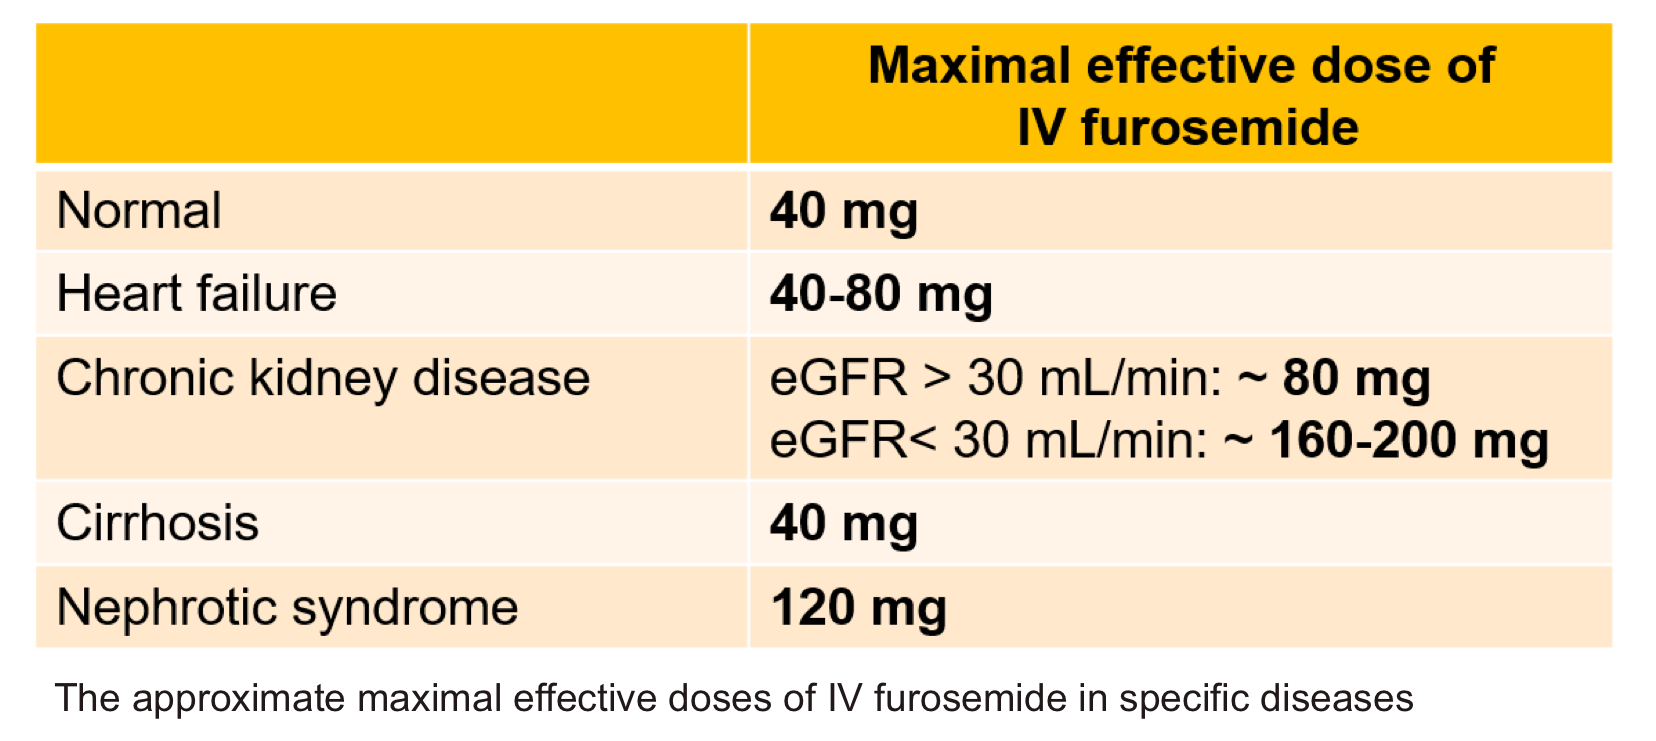
- Maximum recommended daily dose
-
- Although maximal effective doses are often sufficient to achieve therapeutic success, higher doses are recommended in some guidelines to increase natriuresis further. This is because net natriuresis is the product of both the maximal natriuretic effect and the time of natriuresis.
- As a hypothetical example, if the maximal natriuresis per unit time that is induced by a loop diuretic is 20 percent of the filtered sodium load, giving a higher dose will not increase this further (i.e. this is the “maximum effective dose”). However, a higher dose of the diuretic, by raising plasma concentrations, may prolong the period of time during which this maximum effective dose acts upon the kidney, thereby providing an additional net natriuretic effect.
- However, in order to avoid toxicity, the administered dose should not exceed the “maximal recommended daily dose” (see the table below).
Flowchart to diuretic use
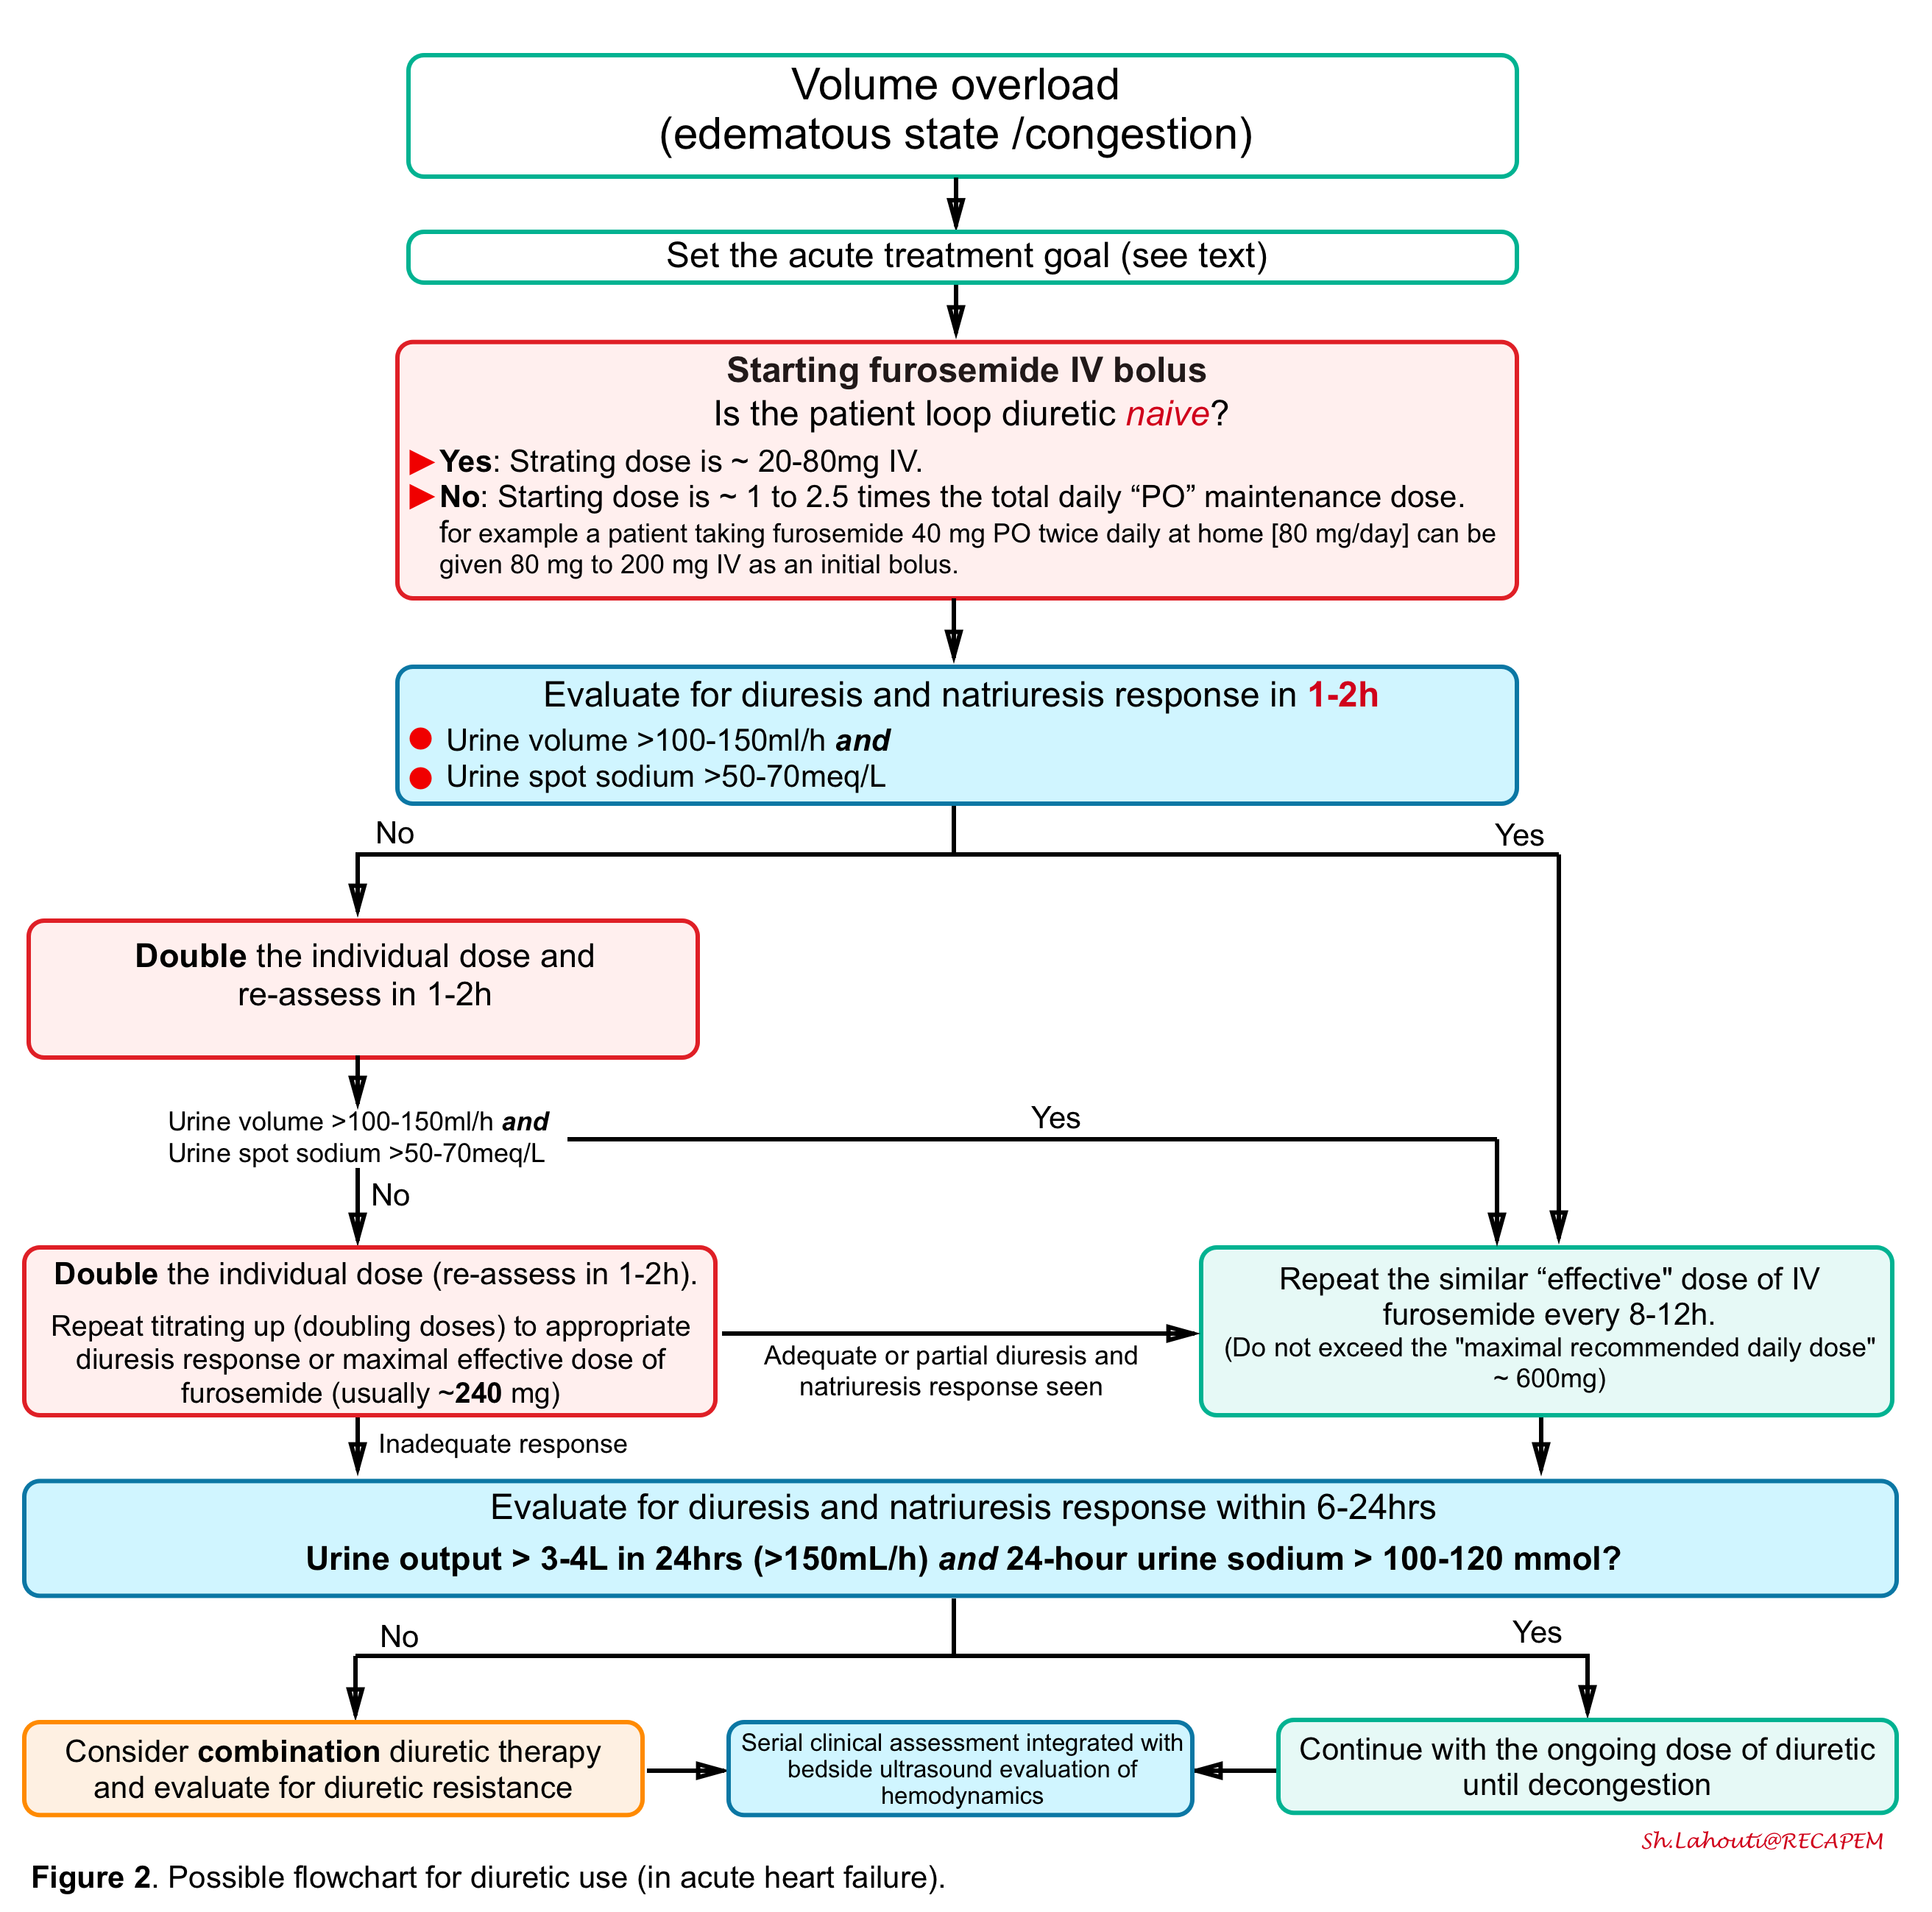
- In the following figure, a flowchart for diuretic use (in acute heart failure) is illustrated *.
- Note that before initiating decongestive therapy in a critically acute congestive state, the treatment goal should be determined.
- The acute treatment goal consists of
- Euvolemia
- Determining euvolemia or the optimal stopping point for decongestive therapy remains a major challenge.
- At the moment no reliable practical bedside test exists to determine euvolemia as it is not yet clear what euvolemia encompasses *. For example, the following metrics were found to be unreliable and poor markers of decongestion, when used alone *.
- Relief of dyspnea
- Attaining a similar body weight loss when the patient was stable.
- Non-invasive test as surrogates for the presence of increased filling pressures (right atrial pressure >7mmHg or PCWP >18 mmHg).
- Natriuretic peptides.
- An increase in hemoglobin (hemoconcentration) after decongestion.
- On the other hand, serial comprehensive assessment especially employing comprehensive POCUS with integrated Doppler study of various veins (HV, PV, intra-renal veins) can be helpful (above).
Thiazide-like diuretics
- Mechanism of action: Thiazides block sodium reabsorption in the distal convoluted tubule
- As the DCT normally reabsorbs only 5%-10% of the filtered sodium load, thiazides by themselves are relatively weak diuretics.
- Patients being treated with loop diuretics will tend to reabsorb more sodium in the distal convoluted tubule. Thus, adding a thiazide in combination with a loop diuretic may substantially augment the efficacy of the loop diuretic.
- Physiologic effect
- Similarly to loop diuretics, thiazides produce hypokalemia, hyperuricemia, and metabolic alkalosis. However, hypokalemia is more pronounced with thiazides than loop diuretics.
- Thiazides tend to reduce the serum sodium level (due to increases in sodium excretion and reduction in the excretion of water).
- Pharmacokinetics
- Like loop diuretics, thiazides are bound to albumin and secreted into the tubule via organic anion transporters *.
- Secretion into the tubule is delayed in renal failure, reducing diuretic efficacy.
- Clinical utility: Benefits of using a thiazide diuretic as a 2nd line agent (in combination with a loop diuretic)
- Avoiding hypernatremia: Loop diuretic therapy by itself tends to promote the excretion of dilute, hypotonic urine. This frequently leads to hypernatremia, which eventually must be treated by administering free water (which largely eliminates the volume loss). The addition of a thiazide diuretic to a loop diuretic promotes the excretion of sodium (natriuresis), leading to more effective volume loss.
- Improved responsiveness to furosemide: The addition of a thiazide diuretic may prevent or reverse resistance to loop diuretics.
- Chronic furosemide use leads to up-regulation of sodium reabsorption in the distal convoluted tubule – which impairs furosemide’s effectiveness. Administration of a thiazide may restore responsiveness to furosemide.
- Which thiazide is to be used?
- Intravenous chlorothiazide
- This is the only intravenous thiazide available and can be given IV (500 to 1000 mg once or twice daily) *.
- Intravenous chlorothiazide has the fastest onset, so it’s preferred in extremely emergent situations (e.g. critical hyperkalemia).
- Limitations of IV chlorothiazide include being more expensive and having a relatively short half-life (~2 hours).
- In a retrospective analysis, oral metolazone appeared to be as effective as IV chlorothiazide, suggesting that this agent should be chosen unless the patient cannot take medications by mouth *.
- Oral indapamide, metolazone or HCTZ
- These agents have longer half-lives (~24 hours for indapamide, ~12 hours for metolazone, ~10 hours for HCTZ). This may be useful to promote ongoing diuretic pressure (preventing the kidneys from retaining sodium in between doses of diuretic).
- There is no solid data comparing these agents.
- Intravenous chlorothiazide
Potassium-sparing diuretics
The potassium-sparing diuretics include 2 drug classes:
- Mineralocorticoid receptor antagonists (MRAs): Spironolactone
- Epithelial sodium channel (ENaC) blockers: Amiloride and triamterene
Spironolactone
- Mechanism of action: It will impair the effects of aldosterone on the distal tubule.
- Physiologic effect:
- It promotes hyperkalemia, and causes a non-anion-gap metabolic acidosis.
- Spironolactone will have the greatest efficacy in contexts where the renin-angiotensin-aldosterone system is highly activated (e.g. cirrhosis and heart failure). Alternatively, in situations where the basal aldosterone tone is low, spironolactone may have little clinical effect.
- Pharmacokinetics
- Spironolactone takes 1-2 days to have a maximal effect, which limits its utility in emergent situations. This also makes it difficult to perform any rapid dose titration.
- Clinical utility
- Volume removal in cirrhosis.
- Counteracting neurohormonal activation in patients with heart failure and reduced ejection fraction (the dose is limited to 50 mg/day when used solely for this indication).
- Adjunctive diuretic in patients with ongoing diuresis (with an anticipated duration of diuretic therapy >1-2 days)
- Prevention of hypokalemia and contraction alkalosis in patients undergoing large-volume diuresis.
- Dosing:
- Cirrhosis: Current guidelines for cirrhosis suggest use with furosemide in a ratio of 100 mg spironolactone: to 40 mg furosemide. The maximal recommended dose of spironolactone is 400 mg daily.
- Heart failure: In the ATHENA-HF trial *, 100 mg spironolactone daily did not improve clinical congestion score, increase urine output, or reduce body weight in patients hospitalized for acute heart failure who were receiving IV loop diuretics. However, these results, plus the finding that the serum potassium did not increase, may be explained by the fact that patients were followed for only 96 hours, and the onset of action of spironolactone may be slow.
Summary
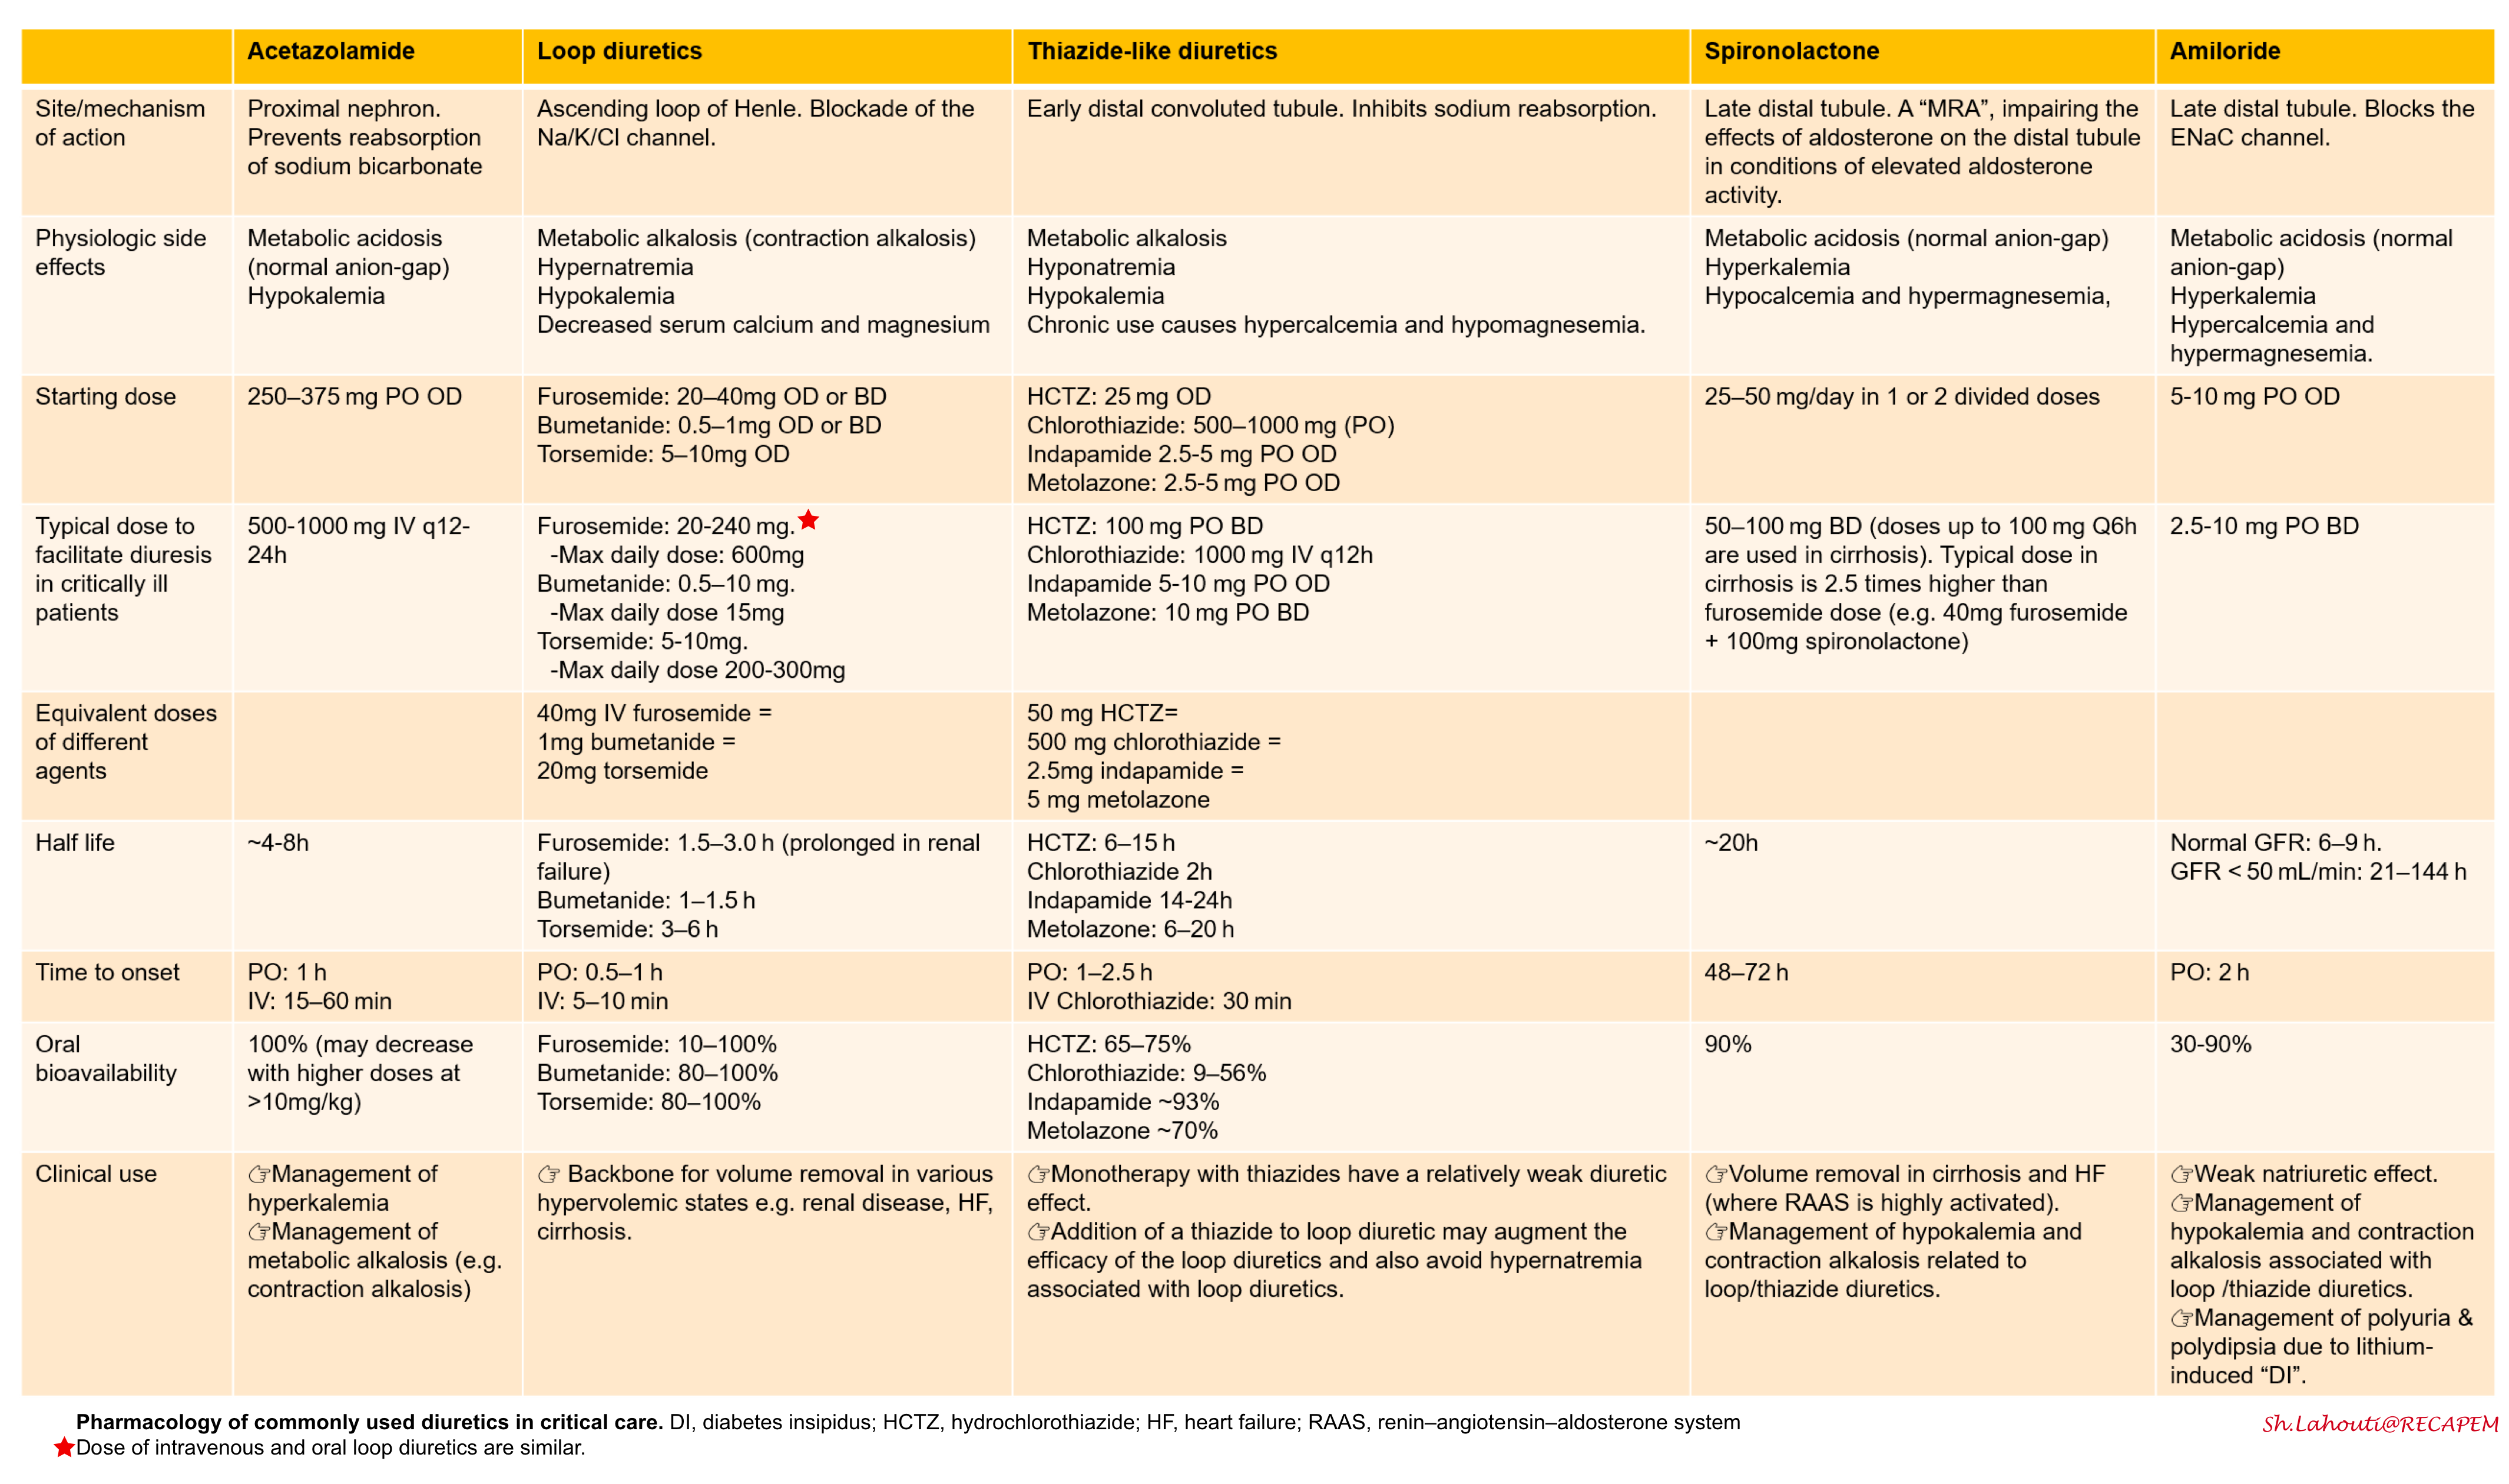
The pharmacology, mechanism of action of diuretics, and physiologic effects are summarized below.
Diuretic resistance
The goal of diuresis is to remove isotonic volume from ECF. Ideally, this is achieved by net removal of fluid with an identical electrolyte composition compared to plasma.
Diuretic resistance can be defined as a failure to increase fluid and sodium (Na+) output sufficiently to relieve volume overload, edema, or congestion, despite escalating doses of a loop diuretic to a ceiling level *. It has been defined in several studies as:
- Inadequate volume of urine in response to escalating dose of diuretics (aka. “gross” diuretic resistance)
- A dilute urine output * (e.g. spot urine sodium of ~< 50-70 meq/L) despite an escalating dose of diuretics (aka. “occult” diuretic resistance = insufficient natriuretic response *).
Causes of diuretic resistance *
- No volume overload (wrong diagnosis)
- Venous stasis
- Lymphedema, lipedema
- Nonadherence
- Excess salt intake
- Nonadherence to medication
- Decreased drug delivery
- Decreased absorption (gut edema) *
- The dose is below the diuretic threshold.
- The dosing interval is too long.
- Hypoalbuminemia
- Decreased drug secretion
- AKI/CKD
- Impaired renal perfusion
- Systemic congestion (which reduces renal perfusion pressure)
- Shock of any etiology
- Medications that interfere with diuretic
- NSAIDs impair diuretic responsiveness.
- Thiazolidinediones, such as rosiglitazone, increase renal salt retention as a result of upregulation of the ENaC in the collecting ducts and also increase proximal tubule sodium reabsorption *.
- Some medications may compete with diuretics for entry into the renal tubule (e.g. probenecid).
- Decreased kidney response: The braking phenomenon occurs when the kidneys’ initially robust natriuretic response wanes as extracellular fluid volume decreases *. This can be caused by:
- Distal tubule hypertrophy: whereby long-term NKCC2 blockade in the loop of Henle causes NCC upregulation in the DCT
- Renin-angiotensin-aldosterone activation (which causes sodium retention) as by CHF
- Sympathetic nervous system activation increases sodium retention.
- Anti-diuretic hormone (ADH) increases water reabsorption.
- Blood pressure reduction may reduce urine output directly.
Strategies to overcome diuretic resistance
The overall schema for the management of diuretic resistance is shown below
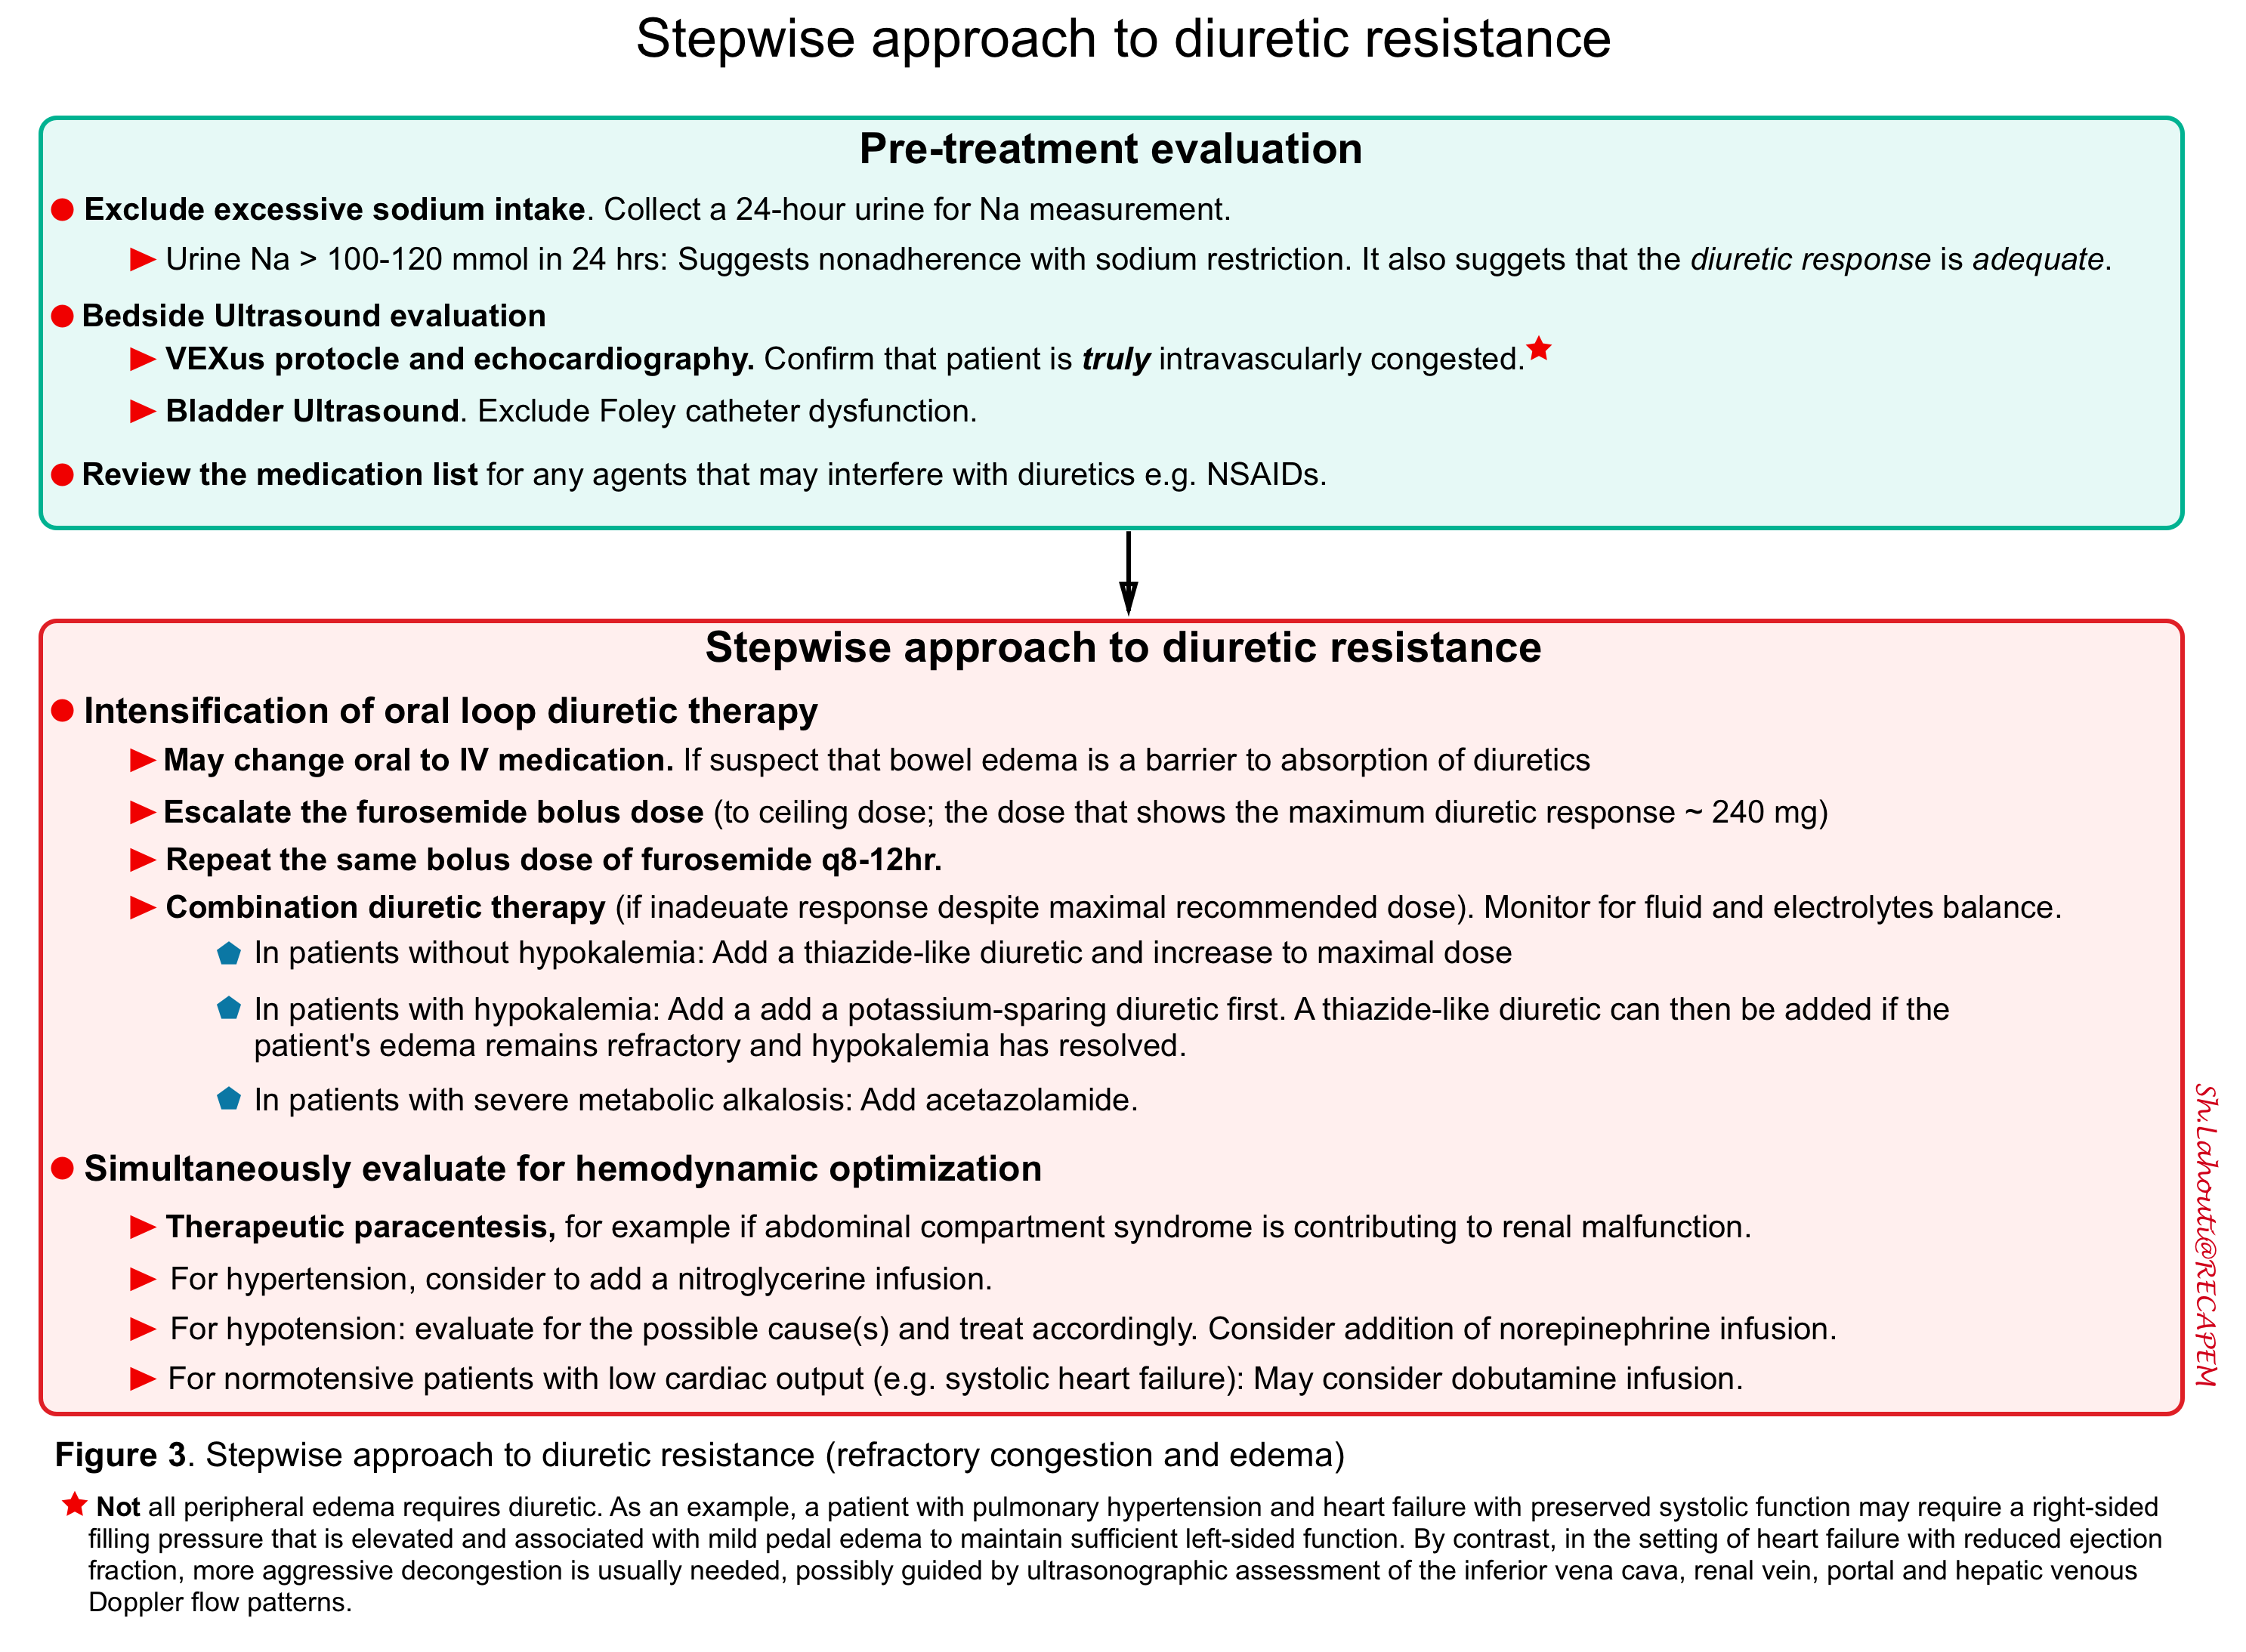
Pretreatment evaluation
- Exclude excessive sodium intake
- To estimate sodium intake, a 24-hour urine should be collected.
- A value above 100-120 mmol in 24 hours (i.e. 2.3 g of sodium) suggests that nonadherence with sodium restriction may be in part responsible for the resistance to diuretic therapy.
- A value above 100 to 120 mmol in 24 hours also suggests that the diuretic response is adequate since true diuretic resistance is manifested by intense renal sodium retention.
- To estimate sodium intake, a 24-hour urine should be collected.
- Bedside ultrasound and echo.
- Confirm that the patient requires a reduction in extracellular fluid volume. While the mere presence of residual edema or pulmonary congestions is suggestive, the decision to further reduce the extracellular fluid volume requires careful clinical judgment. As an example, a patient with pulmonary hypertension and heart failure with preserved systolic function may require a right-sided filling pressure that is elevated and associated with mild pedal edema to maintain sufficient left-sided function.
- By contrast, in the setting of heart failure with reduced ejection fraction, more aggressive decongestion is usually needed, possibly guided by biomarkers such as brain natriuretic peptides or ultrasonographic assessment of the inferior vena cava *.
Stepwise approach to treatment of diuretic resistance
- Review the medication list for any agents that may interfere with diuresis.
- In patients with bowel wall edema, oral absorption of medication is impaired. This can be overcome by giving IV diuretics.
- Escalate the bolus dose of furosemide until maximum effective response is noted.
- Give the bolus dose of furosemide q8-12h. (do not exceed the recommended daily dose).
- Combination diuretic therapy is warranted if an appropriate diuresis response is not seen.
- In patients without hypokalemia, a thiazide-like diuretic is added and the dose can be titrated up *. Possible choices include:
- Metolazone (5 to 10 mg once daily initially, increased to a maximum dose of 20 mg once daily) *
- HCTZ (25 to 50 mg twice daily initially, increased to a maximum dose of 200 mg per day)*
- Chlorthalidone and indapamide are other options, although supportive data are lacking.
- Chlorothiazide is the only thiazide diuretic that can be given IV (500 to 1000 mg once or twice daily) *
- In patients with hypokalemia, a potassium-sparing diuretic is added. A thiazide-like diuretic can then be added if the patient’s edema remains refractory and hypokalemia has resolved.
- In patients with severe metabolic alkalosis, acetazolamide can be added.
- In patients without hypokalemia, a thiazide-like diuretic is added and the dose can be titrated up *. Possible choices include:
Other proposed treatments for diuretic resistance
- Hyperdiuresis involves a combination of hypertonic saline plus a loop diuretic (more on this here).
- Renal dose dopamine? Large, high-quality trials found no benefit and potential harm, and therefore, low-dose dopamine cannot be recommended.
- The addition of low-dose dopamine in the setting of acute decompensated heart failure was examined in 360 patients in the large randomized ROSE-HF trial. The addition of low-dose dopamine did not significantly increase urine volume or improve decongestion compared with placebo, although it did increase the incidence of arrhythmias *.
- Albumin infusion for hypoalbuminemia?
- A study in patients with nephrotic syndrome (mean plasma albumin 3.0 g/dL) found that a mixture of loop diuretic and albumin produced only a modest increase in sodium excretion compared with furosemide alone, without an increase in the rate of furosemide excretion *.
- Another study in hypoalbuminemic patients with cirrhosis (mean plasma albumin 3.0 g/dL) did not find an increase in the rate of either furosemide or sodium excretion *.
- Few patients with severe hypoalbuminemia (plasma albumin <2.0 g/dL) have been studied. It is possible that infusion of furosemide or other loop diuretics plus albumin would be effective in patients with refractory edema and severe hypoalbuminemia. However, if attempted, sodium excretion should be monitored after the addition of albumin infusions, and infusions should be discontinued if they do not result in a net increase in sodium excretion.
Management of diuretic-related complications
Therapy with diuretics may be associated with a variety of fluid and electrolyte complications, therefore close monitoring for fluid and electrolyte balance is warranted during treatment.
- Rising creatinine
- Hypotension
- Metabolic alkalosis: Loop diuretics and thiazides
- Metabolic acidosis (non-anion gap): Acetazolamide, potassium sparing diuretics
- Electrolyte abnormalities (table above)
- Most of the electrolyte problems develop during the first two to three weeks of therapy if they are going to occur. The reason for this time limitation is that the initial solute and water losses lead to compensatory changes that limit further losses. Thus, after the initial period of solute and water loss, a new steady state is attained in which solute and water intake and excretion are roughly equal, as they were before diuretic therapy was initiated. This phenomenon has been called diuretic braking.
- Thiazide-induced hyponatremia is one exception to this time course.
- Most of the electrolyte problems develop during the first two to three weeks of therapy if they are going to occur. The reason for this time limitation is that the initial solute and water losses lead to compensatory changes that limit further losses. Thus, after the initial period of solute and water loss, a new steady state is attained in which solute and water intake and excretion are roughly equal, as they were before diuretic therapy was initiated. This phenomenon has been called diuretic braking.
Rising creatinine
Evidence
Worsening renal function typically defined as an increase in plasma creatinine concentration >0.3 mg/d is observed commonly during diuretic treatment.
- Several previous studies showed that it has been associated with worse outcomes * ,*.
- However, post hoc analyses of such trials have indicated that this association is not necessarily causal and may be response-dependent.
- In fact, the state of decongestion during diuretic treatment is a major determinant of prognosis in the setting of worsening renal function. Worsening renal function may be viewed as an adverse effect when decongestion is incomplete (the patient remains resistant to diuretics) but not when an acceptable diuretic response has been attained *.
Potential benefits of diuretics
-
- Improving renal function via decongestion.
- Systemic venous congestion can impair renal function, via several mechanisms such as
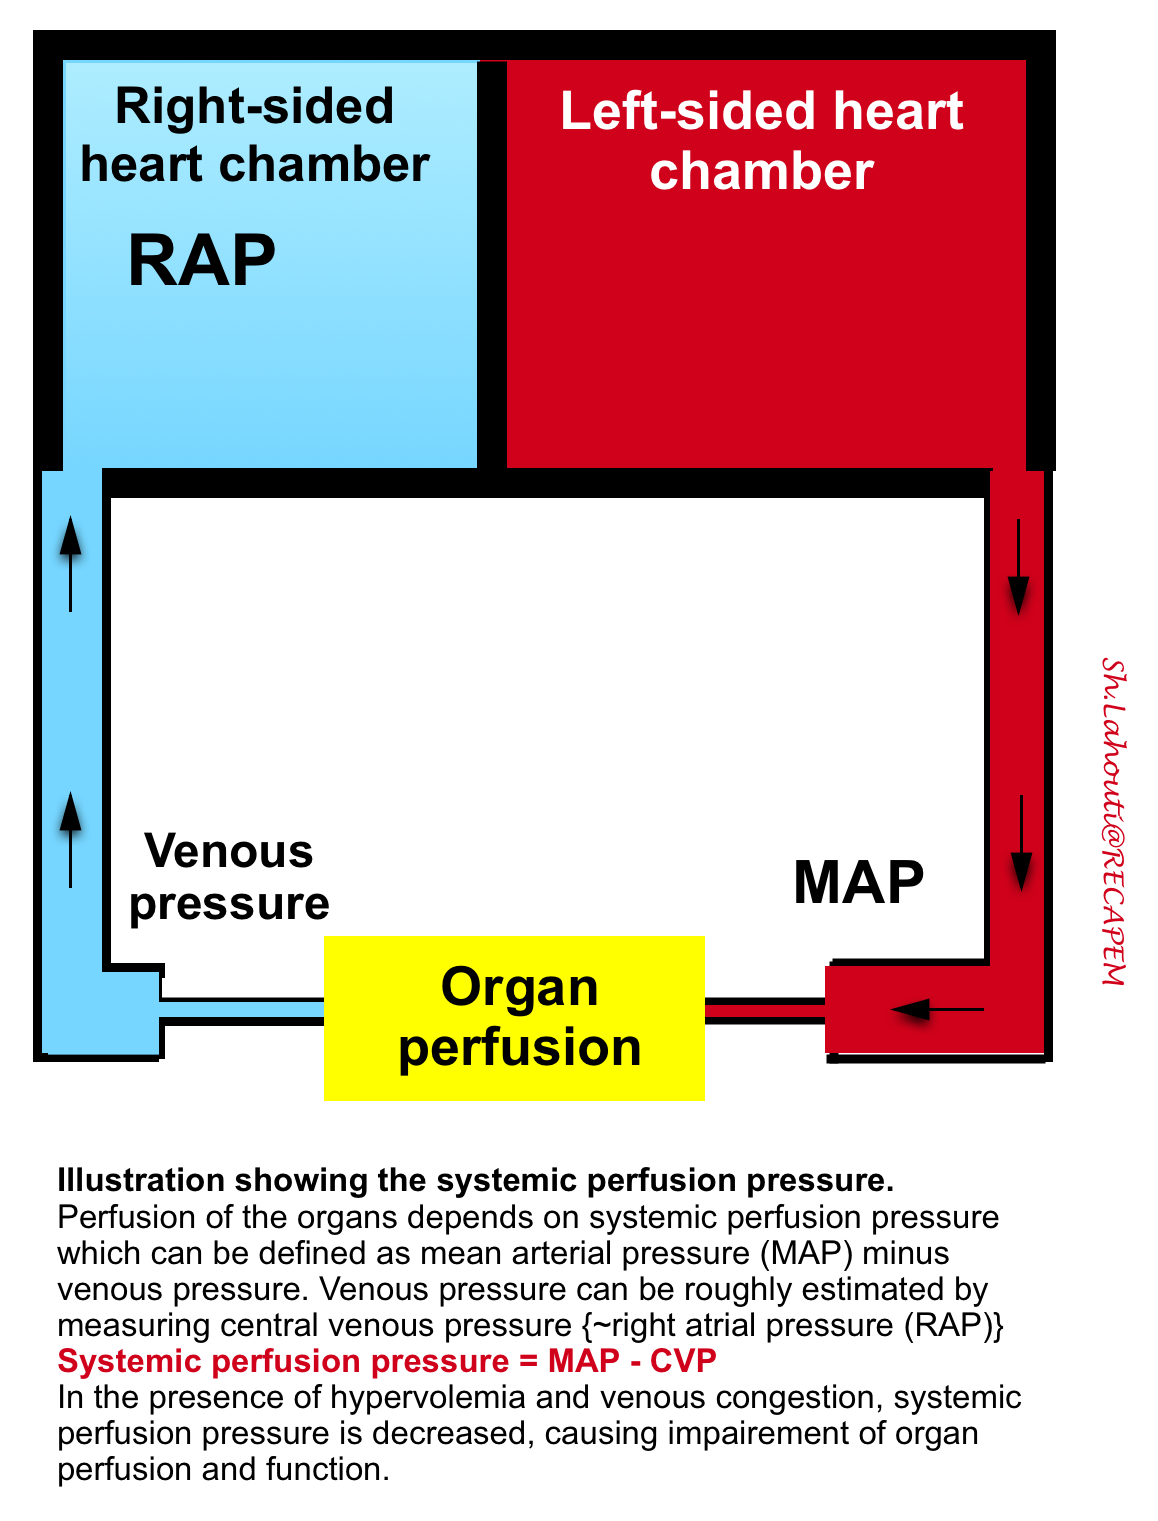
- Impaired renal perfusion pressure: the blood pressure gradient across the kidneys is equal to the mean arterial pressure (MAP) minus the central venous pressure. Elevating the central venous pressure chokes off blood flow through the kidneys.
- Venous congestion can cause intra-renal interstitial edema, which can cause compartment syndrome within the kidney.
- In patients with venous congestion, diuresis may relieve this congestion and thereby improve renal function.
- Systemic venous congestion can impair renal function, via several mechanisms such as
- Increasing renal blood flow
- Loop diuretics inhibit prostaglandin dehydrogenase, as a result of which there is a decreased breakdown of prostaglandin E2 which is a renal vasodilator. Loop diuretics might therefore increase the renal blood flow *.
- Improving renal function via decongestion.
Diuretic are not intrinsically nephrotoxic.
-
- Diuretics do not directly cause harm to the kidneys. Rather if diuretics are administered in an uncontrolled setting, they may provoke volume depletion which can cause renal failure (indirectly).
Differential diagnosis of rising creatinine
- Acute kidney injury due to other medical conditions
- Random daily fluctuations in creatinine
- Diuretic-induced hypovolemic shock causing renal hypoperfusion
Management
- If the creatinine elevation is substantial, then it should be evaluated similarly to that of any other patient with acute kidney injury. At minimum hemodynamic evaluation should be performed to assess for volume status.
- If the patient is not definitely congested, then holding diuretics may be sensible. This is particularly true if diuresis appears to cause hypotension.
- If the patient clearly remains congested, then continuing diuresis may be beneficial. This has been supported by some studies which showed that patients with heart failure and elevations in creatinine had better outcomes when being effectively decongested by aggressive diuretic treatment *.
Hypotension
Hypotension may or may not be related to diuretics, therefore a thorough evaluation in the usual fashion is almost always warranted.
- If hemodynamic evaluation reveals euvolemia, discontinuation of diuretic treatment would be appropriate.
- If hemodynamic evaluation (e.g. via POCUS) revealed severe hypervolemia with obvious evidence of volume overload then it may be reasonable to start a vasopressor like norepinephrine to protect MAP and continue diuresis *. For example a patient with cor pulmonale and evidence of severe intravascular volume overload, in whom volume overload is mediating RV dilation and compression over the left ventricle. In such patients, diuresis may eventually improve the blood pressure.
- If this strategy is used, then close hemodynamic monitoring should be performed with special attention to the vasopressor requirement and the patient’s clinical condition
- Ongoing volume removal with a relatively stable and low vasopressor requirement suggests that the strategy is working.
- Escalating vasopressor requirements suggests that the strategy is failing and maybe promoting hypoperfusion.
- If this strategy is used, then close hemodynamic monitoring should be performed with special attention to the vasopressor requirement and the patient’s clinical condition
Metabolic alkalosis
As an example, the administration of intravenous loop diuretics to induce rapid fluid removal in a markedly edematous patient often generates a metabolic alkalosis. The etiology of this metabolic alkalosis is multifactorial and includes:
- Increase distal sodium and water delivery: This will elevate renin, angiotensin, and aldosterone levels, which in turn enhances urinary hydrogen and potassium secretion and results in metabolic alkalosis and hypokalemia.
- Hypokalemia-related acid-base effects: Hypokalemia also frequently contributes to accelerated renal bicarbonate generation and/or reduced renal bicarbonate excretory capacity.
- Contraction alkalosis: It occurs when there is a loss of relatively large volumes of fluid that has a high sodium chloride concentration but a low bicarbonate concentration (lower than the extracellular fluid bicarbonate concentration). The plasma bicarbonate concentration rises in this setting because there is a contraction of the extracellular volume around a relatively constant quantity of extracellular bicarbonate (and the chloride concentration simultaneously falls).
Management
- Rationale: Metabolic alkalosis impairs natriuretic response to loop diuretics *. On the other hand, continued diuretic treatment will worsen metabolic alkalosis. Attempting to continue diuresis without actively managing the alkalosis will predictably make the alkalosis and natriuretic response worse.
- Approach to management
- Evaluate for and aggressively treat hypokalemia and hypomagnesemia.
- Acetazolamide: is the front-line agent for contraction alkalosis.
- Potassium-sparing diuretics will also tend to improve metabolic alkalosis (spironolactone and amiloride).
Hypokalemia
- Any diuretic that acts proximal to the potassium secretory site will activate the renin-angiotensin-aldosterone system. As a result, urinary potassium excretion will increase, leading to hypokalemia if the urinary losses are greater than the intake.
- Culprit agents: Thiazide-like diuretics, loop diuretics, acetazolamide
- Overall, kaliuretic effect is more potent with thiazide diuretics than with loop diuretics, despite having a less potent natriuretic effect *.
- In stable patients on a fixed diuretic dose, potassium loss, like other diuretic-induced fluid and electrolyte complications, occurs only during the first two weeks of therapy before a new steady state is established. Thus, a stable patient with a normal serum potassium concentration at three weeks is not at risk of late hypokalemia unless the diuretic dose is increased, extrarenal potassium losses increase or dietary potassium intake is reduced.
- Management *
- Potassium should be repleted. This should be done orally or intravenously depending on the severity of hypokalemia (more on this here).
- Check the magnesium level and restore if hypomagnesemia is present.
- For ongoing hypokalemia, a potassium-sparing diuretic could be considered (e.g. spironolactone or amiloride).
Hypernatremia
This is particularly common in patients who are undergoing large-volume diuresis with furosemide. Rising serum sodium should be managed as:
- Add a thiazide diuretic should, if not already in use.
- Provide free water (based on the calculation of free water deficit)
- The dose of furosemide may need to be increased in order to achieve a net negative fluid balance when providing free water.
(1). Both hypovolemia and external compression over adjacent veins will cause the following changes in venous flow pattern:
-
- Decreased velocity of flow
- Central veins: decreased pulsatility index (PI).
- The normal waveform pulsatility (a, S, v, and d wave) is dampened, contributing to the band-like appearance of the waveform. For example, the tri-phasic appearance of the hepatic vein waveform is changed to a monophasic /dampened waveform in cirrhosis due to external compression of the shrunken fibrous liver on the hepatic vein.
Going further
- The venous side matters too (EMCrit)
- Diuretic resistance & natriuresis (PulmCrit)
- Hyperdiuresis (PulmCrit)
- Deresuscitation (IBCC)
- More on the venous side here
Appendix 1
Appendix 2

Media
References
PMID: 30205826. Vincent JL, Pinsky MR. We should avoid the term “fluid overload”. Crit Care. 2018 Sep 11;22(1):214. doi: 10.1186/s13054-018-2141-7.
PMID: 22290457. Woodcock TE, Woodcock TM. Revised Starling equation and the glycocalyx model of transvascular fluid exchange: an improved paradigm for prescribing intravenous fluid therapy. Br J Anaesth. 2012 Mar;108(3):384-94. doi: 10.1093/bja/aer515. Epub 2012 Jan 29.
PMID: 20200043.Levick JR, Michel CC. Microvascular fluid exchange and the revised Starling principle. Cardiovasc Res. 2010 Jul 15;87(2):198-210. doi: 10.1093/cvr/cvq062. Epub 2010 Mar 3.
PMID: 25497357. Chappell D, Bruegger D, Potzel J, Jacob M, Brettner F, Vogeser M, Conzen P, Becker BF, Rehm M. Hypervolemia increases release of atrial natriuretic peptide and shedding of the endothelial glycocalyx. Crit Care. 2014 Oct 13;18(5):538. doi: 10.1186/s13054-014-0538-5.
PMID: 26410146. O’Connor ME, Prowle JR. Fluid Overload. Crit Care Clin. 2015 Oct;31(4):803-21. doi: 10.1016/j.ccc.2015.06.013. Epub 2015 Jul 29.
PMID: 28862947. Fudim M, Hernandez AF, Felker GM. Role of Volume Redistribution in the Congestion of Heart Failure. J Am Heart Assoc. 2017 Aug 17;6(8):e006817. doi: 10.1161/JAHA.117.006817.
PMID: 30600580. Mullens W, Damman K, Harjola VP, Mebazaa A, Brunner-La Rocca HP, Martens P, Testani JM, Tang WHW, Orso F, Rossignol P, Metra M, Filippatos G, Seferovic PM, Ruschitzka F, Coats AJ. The use of diuretics in heart failure with congestion – a position statement from the Heart Failure Association of the European Society of Cardiology. Eur J Heart Fail. 2019 Feb;21(2):137-155. doi: 10.1002/ejhf.1369. Epub 2019 Jan 1.
PMID: 27016163. Maluso P, Olson J, Sarani B. Abdominal Compartment Hypertension and Abdominal Compartment Syndrome. Crit Care Clin. 2016 Apr;32(2):213-22. doi: 10.1016/j.ccc.2015.12.001. Epub 2016 Feb 4.
PMID: 30454823. Sosa G, Gandham N, Landeras V, Calimag AP, Lerma E. Abdominal compartment syndrome. Dis Mon. 2019 Jan;65(1):5-19. doi: 10.1016/j.disamonth.2018.04.003. Epub 2018 Nov 17.
PMID: 27484681. Claure-Del Granado R, Mehta RL. Fluid overload in the ICU: evaluation and management. BMC Nephrol. 2016 Aug 2;17(1):109. doi: 10.1186/s12882-016-0323-6.
PMID: 32091921.Rosenkranz S, Howard LS, Gomberg-Maitland M, Hoeper MM. Systemic Consequences of Pulmonary Hypertension and Right-Sided Heart Failure. Circulation. 2020 Feb 25;141(8):678-693. doi: 10.1161/CIRCULATIONAHA.116.022362. Epub 2020 Feb 24.
PMID: 31395469.Benkreira A, Beaubien-Souligny W, Mailhot T, Bouabdallaoui N, Robillard P, Desjardins G, Lamarche Y, Cossette S, Denault A. Portal Hypertension Is Associated With Congestive Encephalopathy and Delirium After Cardiac Surgery. Can J Cardiol. 2019 Sep;35(9):1134-1141. doi: 10.1016/j.cjca.2019.04.006. Epub 2019 Apr 16.
PMID: 26549056. Styczynski G, Milewska A, Marczewska M, Sobieraj P, Sobczynska M, Dabrowski M, Kuch-Wocial A, Szmigielski C. Echocardiographic Correlates of Abnormal Liver Tests in Patients with Exacerbation of Chronic Heart Failure. J Am Soc Echocardiogr. 2016 Feb;29(2):132-9. doi: 10.1016/j.echo.2015.09.012. Epub 2015 Nov 6.
PMID: 29327276.Ikeda Y, Ishii S, Yazaki M, Fujita T, Iida Y, Kaida T, Nabeta T, Nakatani E, Maekawa E, Yanagisawa T, Koitabashi T, Inomata T, Ako J. Portal congestion and intestinal edema in hospitalized patients with heart failure. Heart Vessels. 2018 Jul;33(7):740-751. doi: 10.1007/s00380-018-1117-5. Epub 2018 Jan 11.
PMID: 34888157. Galindo P, Gasca C, Argaiz ER, Koratala A. Point of care venous Doppler ultrasound: Exploring the missing piece of bedside hemodynamic assessment. World J Crit Care Med. 2021 Nov 9;10(6):310-322. doi: 10.5492/wjccm.v10.i6.310.
PMID: 33477143.Koratala A, Kazory A. Point of Care Ultrasonography for Objective Assessment of Heart Failure: Integration of Cardiac, Vascular, and Extravascular Determinants of Volume Status. Cardiorenal Med. 2021;11(1):5-17. doi: 10.1159/000510732. Epub 2021 Jan 21.
PMID: 29471884. De Backer D, Vincent JL. Should we measure the central venous pressure to guide fluid management? Ten answers to 10 questions. Crit Care. 2018 Feb 23;22(1):43. doi: 10.1186/s13054-018-1959-3.
PMID: 21730928. Perren A, Markmann M, Merlani G, Marone C, Merlani P. Fluid balance in critically ill patients. Should we really rely on it? Minerva Anestesiol. 2011 Aug;77(8):802-11.
PMID: 21730928. Perren A, Markmann M, Merlani G, Marone C, Merlani P. Fluid balance in critically ill patients. Should we really rely on it? Minerva Anestesiol. 2011 Aug;77(8):802-11.
PMID: 8594245. Cook DJ, Simel DL. The Rational Clinical Examination. Does this patient have abnormal central venous pressure? JAMA. 1996 Feb 28;275(8):630-4.
PMID: 22520492. Lichtenstein D, Karakitsos D. Integrating lung ultrasound in the hemodynamic evaluation of acute circulatory failure (the fluid administration limited by lung sonography protocol). J Crit Care. 2012 Oct;27(5):533.e11-9. doi: 10.1016/j.jcrc.2012.03.004. Epub 2012 Apr 18.
PMID: 34906306. Kaptein MJ, Kaptein EM. Inferior Vena Cava Collapsibility Index: Clinical Validation and Application for Assessment of Relative Intravascular Volume. Adv Chronic Kidney Dis. 2021 May;28(3):218-226. doi: 10.1053/j.ackd.2021.02.003.
PMID: 32270297. Beaubien-Souligny W, Rola P, Haycock K, Bouchard J, Lamarche Y, Spiegel R, Denault AY. Quantifying systemic congestion with Point-Of-Care ultrasound: development of the venous excess ultrasound grading system. Ultrasound J. 2020 Apr 9;12(1):16. doi: 10.1186/s13089-020-00163-w.
PMID: 34888157. Galindo P, Gasca C, Argaiz ER, Koratala A. Point of care venous Doppler ultrasound: Exploring the missing piece of bedside hemodynamic assessment. World J Crit Care Med. 2021 Nov 9;10(6):310-322. doi: 10.5492/wjccm.v10.i6.310.
PMID: 21257940.McNaughton DA, Abu-Yousef MM. Doppler US of the liver made simple. Radiographics. 2011 Jan-Feb;31(1):161-88. doi: 10.1148/rg.311105093. Erratum in: Radiographics. 2011 May-Jun;31(3):904.
PMID: 33076961. Spiegel R, Teeter W, Sullivan S, Tupchong K, Mohammed N, Sutherland M, Leibner E, Rola P, Galvagno SM Jr, Murthi SB. The use of venous Doppler to predict adverse kidney events in a general ICU cohort. Crit Care. 2020 Oct 19;24(1):615. doi: 10.1186/s13054-020-03330-6.
PMID: 32270297. Beaubien-Souligny W, Rola P, Haycock K, Bouchard J, Lamarche Y, Spiegel R, Denault AY. Quantifying systemic congestion with Point-Of-Care ultrasound: development of the venous excess ultrasound grading system. Ultrasound J. 2020 Apr 9;12(1):16. doi: 10.1186/s13089-020-00163-w.
PMID: 32995715. Bouabdallaoui N, Beaubien-Souligny W, Oussaïd E, Henri C, Racine N, Denault AY, Rouleau JL. Assessing Splanchnic Compartment Using Portal Venous Doppler and Impact of Adding It to the EVEREST Score for Risk Assessment in Heart Failure. CJC Open. 2020 Mar 30;2(5):311-320. doi: 10.1016/j.cjco.2020.03.012.
PMID: 30371304. Beaubien-Souligny W, Benkreira A, Robillard P, Bouabdallaoui N, Chassé M, Desjardins G, Lamarche Y, White M, Bouchard J, Denault A. Alterations in Portal Vein Flow and Intrarenal Venous Flow Are Associated With Acute Kidney Injury After Cardiac Surgery: A Prospective Observational Cohort Study. J Am Heart Assoc. 2018 Oct 2;7(19):e009961. doi: 10.1161/JAHA.118.009961
PMID: 30371304. Beaubien-Souligny W, Benkreira A, Robillard P, Bouabdallaoui N, Chassé M, Desjardins G, Lamarche Y, White M, Bouchard J, Denault A. Alterations in Portal Vein Flow and Intrarenal Venous Flow Are Associated With Acute Kidney Injury After Cardiac Surgery: A Prospective Observational Cohort Study. J Am Heart Assoc. 2018 Oct 2;7(19):e009961. doi: 10.1161/JAHA.118.009961.
PMID: 31630601. Husain-Syed F, Birk HW, Ronco C, Schörmann T, Tello K, Richter MJ, Wilhelm J, Sommer N, Steyerberg E, Bauer P, Walmrath HD, Seeger W, McCullough PA, Gall H, Ghofrani HA. Doppler-Derived Renal Venous Stasis Index in the Prognosis of Right Heart Failure. J Am Heart Assoc. 2019 Nov 5;8(21):e013584. doi: 10.1161/JAHA.119.013584. Epub 2019 Oct 19.
PMID: 33477143.Koratala A, Kazory A. Point of Care Ultrasonography for Objective Assessment of Heart Failure: Integration of Cardiac, Vascular, and Extravascular Determinants of Volume Status. Cardiorenal Med. 2021;11(1):5-17. doi: 10.1159/000510732. Epub 2021 Jan 21.
PMID: 20646244.Walden AP, Garrard CS, Salmon J. Sustained effects of thoracocentesis on oxygenation in mechanically ventilated patients. Respirology. 2010 Aug;15(6):986-92. doi: 10.1111/j.1440-1843.2010.01810.x. Epub 2010 Jul 20.
PMID: 29699542. Wang Z, Cai QZ, Ban CJ, Chen D, Xu LL, Wang XJ, Wang Z, Yang Y, Lv XZ, Shi HZ. Improved heart hemodynamics after draining large-volume pleural effusion: a prospective cohort study. BMC Pulm Med. 2018 Apr 25;18(1):62. doi: 10.1186/s12890-018-0625-5.
PMID: 11779540. Traylor JJ, Chan K, Wong I, Roxas JN, Chandraratna PA. Large pleural effusions producing signs of cardiac tamponade resolved by thoracentesis. Am J Cardiol. 2002 Jan 1;89(1):106-8. doi: 10.1016/s0002-9149(01)02180-4.
PMID: 1638726. Vaska K, Wann LS, Sagar K, Klopfenstein HS. Pleural effusion as a cause of right ventricular diastolic collapse. Circulation. 1992 Aug;86(2):609-17. doi: 10.1161/01.cir.86.2.609.
PMID: 24407535. Chidambaram S, Sangareddi V, Ganesan G, Dhandapani VE, Ravi MS, Meenakshi K, Muthukumar D, Swaminathan N, Ravishankar G. An echocardiographic assessment of cardiovascular hemodynamics in patients with large pleural effusion. Indian Heart J. 2013 Dec;65(6):666-70. doi: 10.1016/j.ihj.2013.10.013. Epub 2013 Nov 9.
PMID: 29282107. Brogi E, Gargani L, Bignami E, Barbariol F, Marra A, Forfori F, Vetrugno L. Thoracic ultrasound for pleural effusion in the intensive care unit: a narrative review from diagnosis to treatment. Crit Care. 2017 Dec 28;21(1):325. doi: 10.1186/s13054-017-1897-5.
PMID: 21757129. Brunelli A, Beretta E, Cassivi SD, Cerfolio RJ, Detterbeck F, Kiefer T, Miserocchi G, Shrager J, Singhal S, Van Raemdonck D, Varela G. Consensus definitions to promote an evidence-based approach to management of the pleural space. A collaborative proposal by ESTS, AATS, STS, and GTSC. Eur J Cardiothorac Surg. 2011 Aug;40(2):291-7. doi: 10.1016/j.ejcts.2011.05.020.
PMID: 30272503.Feller-Kopman DJ, Reddy CB, DeCamp MM, Diekemper RL, Gould MK, Henry T, Iyer NP, Lee YCG, Lewis SZ, Maskell NA, Rahman NM, Sterman DH, Wahidi MM, Balekian AA. Management of Malignant Pleural Effusions. An Official ATS/STS/STR Clinical Practice Guideline. Am J Respir Crit Care Med. 2018 Oct 1;198(7):839-849. doi: 10.1164/rccm.201807-1415ST.
PMID: 20696688. Havelock T, Teoh R, Laws D, Gleeson F; BTS Pleural Disease Guideline Group. Pleural procedures and thoracic ultrasound: British Thoracic Society Pleural Disease Guideline 2010. Thorax. 2010 Aug;65 Suppl 2:ii61-76. doi: 10.1136/thx.2010.137026.
PMID: 32079642. Muruganandan S, Azzopardi M, Thomas R, Fitzgerald DB, Kuok YJ, Cheah HM, Read CA, Budgeon CA, Eastwood PR, Jenkins S, Singh B, Murray K, Lee YCG. The Pleural Effusion And Symptom Evaluation (PLEASE) study of breathlessness in patients with a symptomatic pleural effusion. Eur Respir J. 2020 May 14;55(5):1900980. doi: 10.1183/13993003.00980-2019.
PMID: 17218577. Huggins JT, Sahn SA, Heidecker J, Ravenel JG, Doelken P. Characteristics of trapped lung: pleural fluid analysis, manometry, and air-contrast chest CT. Chest. 2007 Jan;131(1):206-13. doi: 10.1378/chest.06-0430.
PMID: 11960078. Castellote J, Gornals J, Lopez C, Xiol X. Acute tension hydrothorax: a life-threatening complication of cirrhosis. J Clin Gastroenterol. 2002 May-Jun;34(5):588-9. doi: 10.1097/00004836-200205000-00024.
PMID: 8666323. Xiol X, Castellví JM, Guardiola J, Sesé E, Castellote J, Perelló A, Cervantes X, Iborra MJ. Spontaneous bacterial empyema in cirrhotic patients: a prospective study. Hepatology. 1996 Apr;23(4):719-23. doi: 10.1002/hep.510230410.
PMID: 32585037 .Banini BA, Alwatari Y, Stovall M, Ogden N, Gershman E, Shah RD, Strife BJ, Shojaee S, Sterling RK. Multidisciplinary Management of Hepatic Hydrothorax in 2020: An Evidence-Based Review and Guidance. Hepatology. 2020 Nov;72(5):1851-1863. doi: 10.1002/hep.31434. Epub 2020 Oct 22.
PMID: 29653741. European Association for the Study of the Liver. Electronic address: easloffice@easloffice.eu; European Association for the Study of the Liver. EASL Clinical Practice Guidelines for the management of patients with decompensated cirrhosis. J Hepatol. 2018 Aug;69(2):406-460. doi: 10.1016/j.jhep.2018.03.024. Epub 2018 Apr 10. Erratum in: J Hepatol. 2018 Nov;69(5):1207.
PMID: 3699402. Pockros PJ, Reynolds TB. Rapid diuresis in patients with ascites from chronic liver disease: the importance of peripheral edema. Gastroenterology. 1986 Jun;90(6):1827-33. doi: 10.1016/0016-5085(86)90249-0.
PMID: 4910836. Shear L, Ching S, Gabuzda GJ. Compartmentalization of ascites and edema in patients with hepatic cirrhosis. N Engl J Med. 1970 Jun 18;282(25):1391-6. doi: 10.1056/NEJM197006182822502.
PMID: 30600580. Mullens W, Damman K, Harjola VP, Mebazaa A, Brunner-La Rocca HP, Martens P, Testani JM, Tang WHW, Orso F, Rossignol P, Metra M, Filippatos G, Seferovic PM, Ruschitzka F, Coats AJ. The use of diuretics in heart failure with congestion – a position statement from the Heart Failure Association of the European Society of Cardiology. Eur J Heart Fail. 2019 Feb;21(2):137-155. doi: 10.1002/ejhf.1369. Epub 2019 Jan 1.
PMID: 26240596. Oh SW, Han SY. Loop Diuretics in Clinical Practice. Electrolyte Blood Press. 2015 Jun;13(1):17-21. doi: 10.5049/EBP.2015.13.1.17. Epub 2015 Jun 30.
PMID: 30936153. Ellison DH. Clinical Pharmacology in Diuretic Use. Clin J Am Soc Nephrol. 2019 Aug 7;14(8):1248-1257. doi: 10.2215/CJN.09630818. Epub 2019 Apr 1. Erratum in: Clin J Am Soc Nephrol. 2019 Nov 7;14(11):16.
PMID: 8800113. Dormans TP, van Meyel JJ, Gerlag PG, Tan Y, Russel FG, Smits P. Diuretic efficacy of high dose furosemide in severe heart failure: bolus injection versus continuous infusion. J Am Coll Cardiol. 1996 Aug;28(2):376-82. doi: 10.1016/0735-1097(96)00161-1.
PMID: 30936153. Ellison DH. Clinical Pharmacology in Diuretic Use. Clin J Am Soc Nephrol. 2019 Aug 7;14(8):1248-1257. doi: 10.2215/CJN.09630818. Epub 2019 Apr 1. Erratum in: Clin J Am Soc Nephrol. 2019 Nov 7;14(11):1653-1654.
PMID: 33067334. Aithal GP, Palaniyappan N, China L, Härmälä S, Macken L, Ryan JM, Wilkes EA, Moore K, Leithead JA, Hayes PC, O’Brien AJ, Verma S. Guidelines on the management of ascites in cirrhosis. Gut. 2021 Jan;70(1):9-29. doi: 10.1136/gutjnl-2020-321790. Epub 2020 Oct 16.
PMID: 29141174. Ellison DH, Felker GM. Diuretic Treatment in Heart Failure. N Engl J Med. 2017 Nov 16;377(20):1964-1975. doi: 10.1056/NEJMra1703100. Erratum in: N Engl J Med. 2018 Feb 1;378(5):492.
PMID: 25182016. Rosner MH, Ostermann M, Murugan R, Prowle JR, Ronco C, Kellum JA, Mythen MG, Shaw AD; ADQI XII Investigators Group. Indications and management of mechanical fluid removal in critical illness. Br J Anaesth. 2014 Nov;113(5):764-71. doi: 10.1093/bja/aeu297. Epub 2014 Sep 2.
PMID: 23747642. Yancy CW, Jessup M, Bozkurt B, Butler J, Casey DE Jr, Drazner MH, Fonarow GC, Geraci SA, Horwich T, Januzzi JL, Johnson MR, Kasper EK, Levy WC, Masoudi FA, McBride PE, McMurray JJ, Mitchell JE, Peterson PN, Riegel B, Sam F, Stevenson LW, Tang WH, Tsai EJ, Wilkoff BL; American College of Cardiology Foundation; American Heart Association Task Force on Practice Guidelines. 2013 ACCF/AHA guideline for the management of heart failure: a report of the American College of Cardiology Foundation/American Heart Association Task Force on Practice Guidelines. J Am Coll Cardiol. 2013 Oct 15;62(16):e147-239. doi: 10.1016/j.jacc.2013.05.019. Epub 2013 Jun 5.
PMID: 28228057. Michaud CJ, Mintus KC. Intravenous Chlorothiazide Versus Enteral Metolazone to Augment Loop Diuretic Therapy in the Intensive Care Unit. Ann Pharmacother. 2017 Apr;51(4):286-292. doi: 10.1177/1060028016683971. Epub 2016 Dec 16.
PMID: 28700781. Butler J, Anstrom KJ, Felker GM, Givertz MM, Kalogeropoulos AP, Konstam MA, Mann DL, Margulies KB, McNulty SE, Mentz RJ, Redfield MM, Tang WHW, Whellan DJ, Shah M, Desvigne-Nickens P, Hernandez AF, Braunwald E; National Heart Lung and Blood Institute Heart Failure Clinical Research Network. Efficacy and Safety of Spironolactone in Acute Heart Failure: The ATHENA-HF Randomized Clinical Trial. JAMA Cardiol. 2017 Sep 1;2(9):950-958. doi: 10.1001/jamacardio.2017.2198.
PMID: 32829662. Wilcox CS, Testani JM, Pitt B. Pathophysiology of Diuretic Resistance and Its Implications for the Management of Chronic Heart Failure. Hypertension. 2020 Oct;76(4):1045-1054. doi: 10.1161/HYPERTENSIONAHA.120.15205. Epub 2020 Aug 24.
PMID: 25560378.ter Maaten JM, Valente MA, Damman K, Hillege HL, Navis G, Voors AA. Diuretic response in acute heart failure-pathophysiology, evaluation, and therapy. Nat Rev Cardiol. 2015 Mar;12(3):184-92. doi: 10.1038/nrcardio.2014.215. Epub 2015 Jan 6.
PMID: 24704538. Singh D, Shrestha K, Testani JM, Verbrugge FH, Dupont M, Mullens W, Tang WH. Insufficient natriuretic response to continuous intravenous furosemide is associated with poor long-term outcomes in acute decompensated heart failure. J Card Fail. 2014 Jun;20(6):392-9. doi: 10.1016/j.cardfail.2014.03.006. Epub 2014 Apr 2.
PMID: 27814935. Hoorn EJ, Ellison DH. Diuretic Resistance. Am J Kidney Dis. 2017 Jan;69(1):136-142. doi: 10.1053/j.ajkd.2016.08.027. Epub 2016 Nov 1.
PMID: 6503136.Brater DC, Day B, Burdette A, Anderson S. Bumetanide and furosemide in heart failure. Kidney Int. 1984 Aug;26(2):183-9. doi: 10.1038/ki.1984.153.
PMID: 25531136. Fu Y, Gerasimova M, Batz F, Kuczkowski A, Alam Y, Sanders PW, Ronzaud C, Hummler E, Vallon V. PPARγ agonist-induced fluid retention depends on αENaC expression in connecting tubules. Nephron. 2015;129(1):68-74. doi: 10.1159/000370254. Epub 2014 Dec 19.
PMID: 28261499. Kaptein MJ, Kaptein EM. Focused Real-Time Ultrasonography for Nephrologists. Int J Nephrol. 2017;2017:3756857. doi: 10.1155/2017/3756857. Epub 2017 Feb 2.
PMID: 7967362. Fliser D, Schröter M, Neubeck M, Ritz E. Coadministration of thiazides increases the efficacy of loop diuretics even in patients with advanced renal failure. Kidney Int. 1994 Aug;46(2):482-8. doi: 10.1038/ki.1994.298.
PMID: 23131078. Bart BA, Goldsmith SR, Lee KL, Givertz MM, O’Connor CM, Bull DA, Redfield MM, Deswal A, Rouleau JL, LeWinter MM, Ofili EO, Stevenson LW, Semigran MJ, Felker GM, Chen HH, Hernandez AF, Anstrom KJ, McNulty SE, Velazquez EJ, Ibarra JC, Mascette AM, Braunwald E; Heart Failure Clinical Research Network. Ultrafiltration in decompensated heart failure with cardiorenal syndrome. N Engl J Med. 2012 Dec 13;367(24):2296-304. doi: 10.1056/NEJMoa1210357. Epub 2012 Nov 6.
PMID: 7046434. Wollam GL, Tarazi RC, Bravo EL, Dustan HP. Diuretic potency of combined hydrochlorothiazide and furosemide therapy in patients with azotemia. Am J Med. 1982 Jun;72(6):929-38. doi: 10.1016/0002-9343(82)90854-3.
PMID: 24247300. Chen HH, Anstrom KJ, Givertz MM, Stevenson LW, Semigran MJ, Goldsmith SR, Bart BA, Bull DA, Stehlik J, LeWinter MM, Konstam MA, Huggins GS, Rouleau JL, O’Meara E, Tang WH, Starling RC, Butler J, Deswal A, Felker GM, O’Connor CM, Bonita RE, Margulies KB, Cappola TP, Ofili EO, Mann DL, Dávila-Román VG, McNulty SE, Borlaug BA, Velazquez EJ, Lee KL, Shah MR, Hernandez AF, Braunwald E, Redfield MM; NHLBI Heart Failure Clinical Research Network. Low-dose dopamine or low-dose nesiritide in acute heart failure with renal dysfunction: the ROSE acute heart failure randomized trial. JAMA. 2013 Dec 18;310(23):2533-43. doi: 10.1001/jama.2013.282190.
PMID: 24164864. Damman K, Valente MA, Voors AA, O’Connor CM, van Veldhuisen DJ, Hillege HL. Renal impairment, worsening renal function, and outcome in patients with heart failure: an updated meta-analysis. Eur Heart J. 2014 Feb;35(7):455-69. doi: 10.1093/eurheartj/eht386. Epub 2013 Oct 27.
PMID: 21366472. Felker GM, Lee KL, Bull DA, Redfield MM, Stevenson LW, Goldsmith SR, LeWinter MM, Deswal A, Rouleau JL, Ofili EO, Anstrom KJ, Hernandez AF, McNulty SE, Velazquez EJ, Kfoury AG, Chen HH, Givertz MM, Semigran MJ, Bart BA, Mascette AM, Braunwald E, O’Connor CM; NHLBI Heart Failure Clinical Research Network. Diuretic strategies in patients with acute decompensated heart failure. N Engl J Med. 2011 Mar 3;364(9):797-805. doi: 10.1056/NEJMoa1005419.
PMID: 27374839. Brisco MA, Zile MR, Hanberg JS, Wilson FP, Parikh CR, Coca SG, Tang WH, Testani JM. Relevance of Changes in Serum Creatinine During a Heart Failure Trial of Decongestive Strategies: Insights From the DOSE Trial. J Card Fail. 2016 Oct;22(10):753-60. doi: 10.1016/j.cardfail.2016.06.423. Epub 2016 Jun 30.
PMID: 29352071. Ahmad T, Jackson K, Rao VS, Tang WHW, Brisco-Bacik MA, Chen HH, Felker GM, Hernandez AF, O’Connor CM, Sabbisetti VS, Bonventre JV, Wilson FP, Coca SG, Testani JM. Worsening Renal Function in Patients With Acute Heart Failure Undergoing Aggressive Diuresis Is Not Associated With Tubular Injury. Circulation. 2018 May 8;137(19):2016-2028. doi: 10.1161/CIRCULATIONAHA.117.030112. Epub 2018 Jan 19. Erratum in: Circulation. 2018 Jun 19;137(25):e853.
PMID: 970904. Nuutinen LS, Tuononen S. The effect of furosemide on renal blood flow and renal tissue oxygen tension in dogs. Ann Chir Gynaecol. 1976;65(4):272-6.
PMID: 20606118. Testani JM, Chen J, McCauley BD, Kimmel SE, Shannon RP. Potential effects of aggressive decongestion during the treatment of decompensated heart failure on renal function and survival. Circulation. 2010 Jul 20;122(3):265-72. doi: 10.1161/CIRCULATIONAHA.109.933275. Epub 2010 Jul 6.
PMID: 34888157. Galindo P, Gasca C, Argaiz ER, Koratala A. Point of care venous Doppler ultrasound: Exploring the missing piece of bedside hemodynamic assessment. World J Crit Care Med. 2021 Nov 9;10(6):310-322. doi: 10.5492/wjccm.v10.i6.310.
PMID: 9125675. Knauf H, Mutschler E. Sequential nephron blockade breaks resistance to diuretics in edematous states. J Cardiovasc Pharmacol. 1997 Mar;29(3):367-72. doi: 10.1097/00005344-199703000-00010.
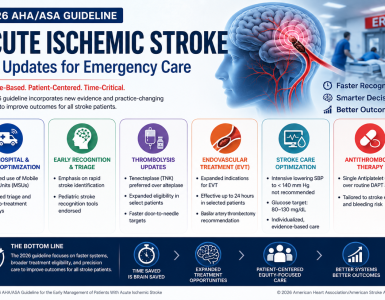

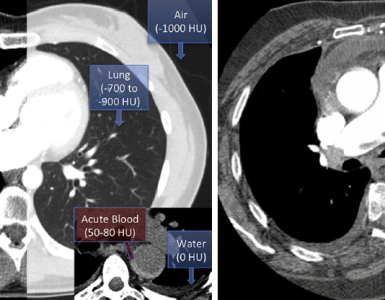
Add comment