

 Shahriar Lahouti
15 September 2026, by Shahriar Lahouti.
CONTENTS
- Preface
- Essentials
- Color Doppler (CD)
- Pulsed-Wave Doppler (PWD)
- Continuous-Wave Doppler (CWD)
- Tissue Doppler Imaging (TDI)
- Power Doppler
- Artifact in Doppler Ultrasound
- How to Optimize the View
- 📊Summary Table:
- 🎥Media
- Reference
Preface
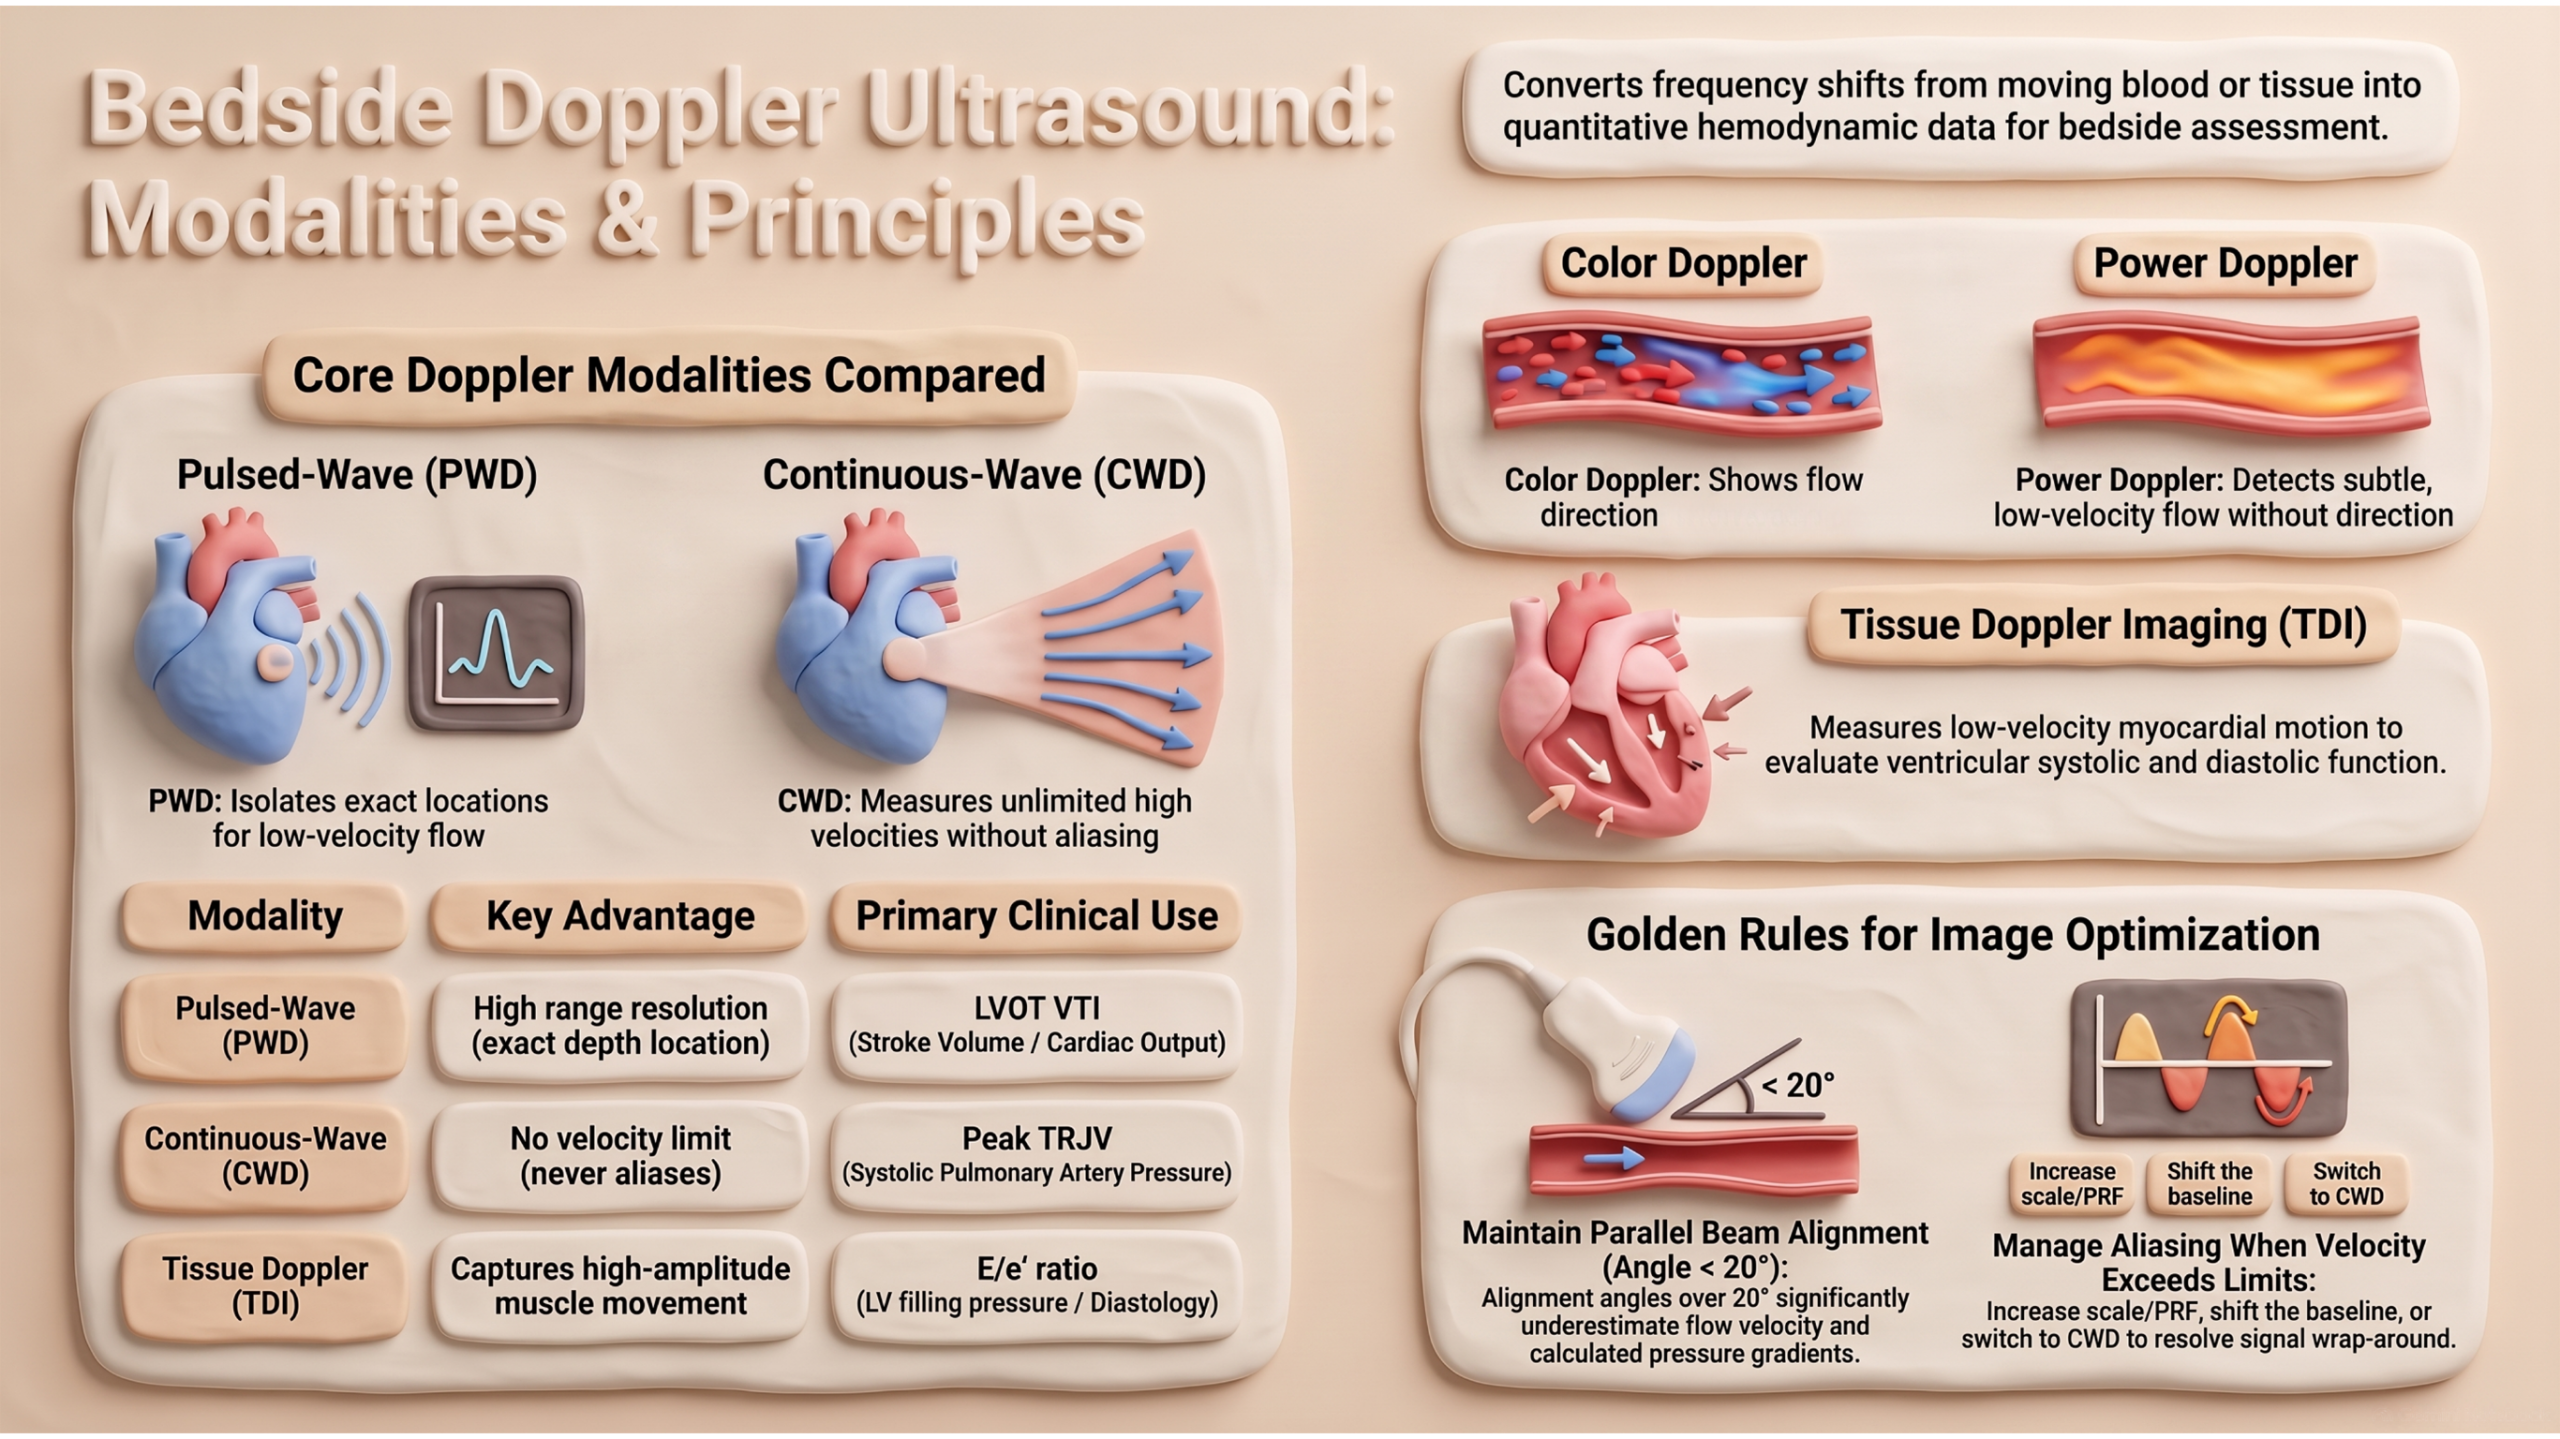
Doppler echocardiography converts the frequency shift of ultrasound reflected from moving blood into quantitative information about flow velocity, direction, and timing. In shock physiology, where flow — not pressure alone — determines organ perfusion, this capability is indispensable: it allows the clinician to measure cardiac output, estimate pulmonary pressures, quantify valvular gradients, and detect perfusion abnormalities that physical examination and 2D imaging cannot resolve. This article reviews the five principal Doppler modalities used at the bedside — Color Flow, Pulsed-Wave, Continuous-Wave, Power, and Tissue Doppler — together with the physical principles, spectral terminology, and waveform descriptors that underpin their interpretation. It is intended as the conceptual foundation for the applied companion article, Hemodynamic Assessment with Doppler.
Essentials
Basic Concepts
Doppler echocardiography is based on the principle that ultrasound waves reflected from moving blood cells undergo a frequency shift proportional to the velocity of flow. The Doppler equation relates this shift to velocity:
- V = (ΔF × C) / (2F₀ × cosθ)
- Where:
- ΔF = Doppler shift (difference between transmitted and reflected frequency)
- C = speed of sound in tissue (1540 m/s)
- F₀ = transducer frequency
- θ = angle between the ultrasound beam and the direction of blood flow
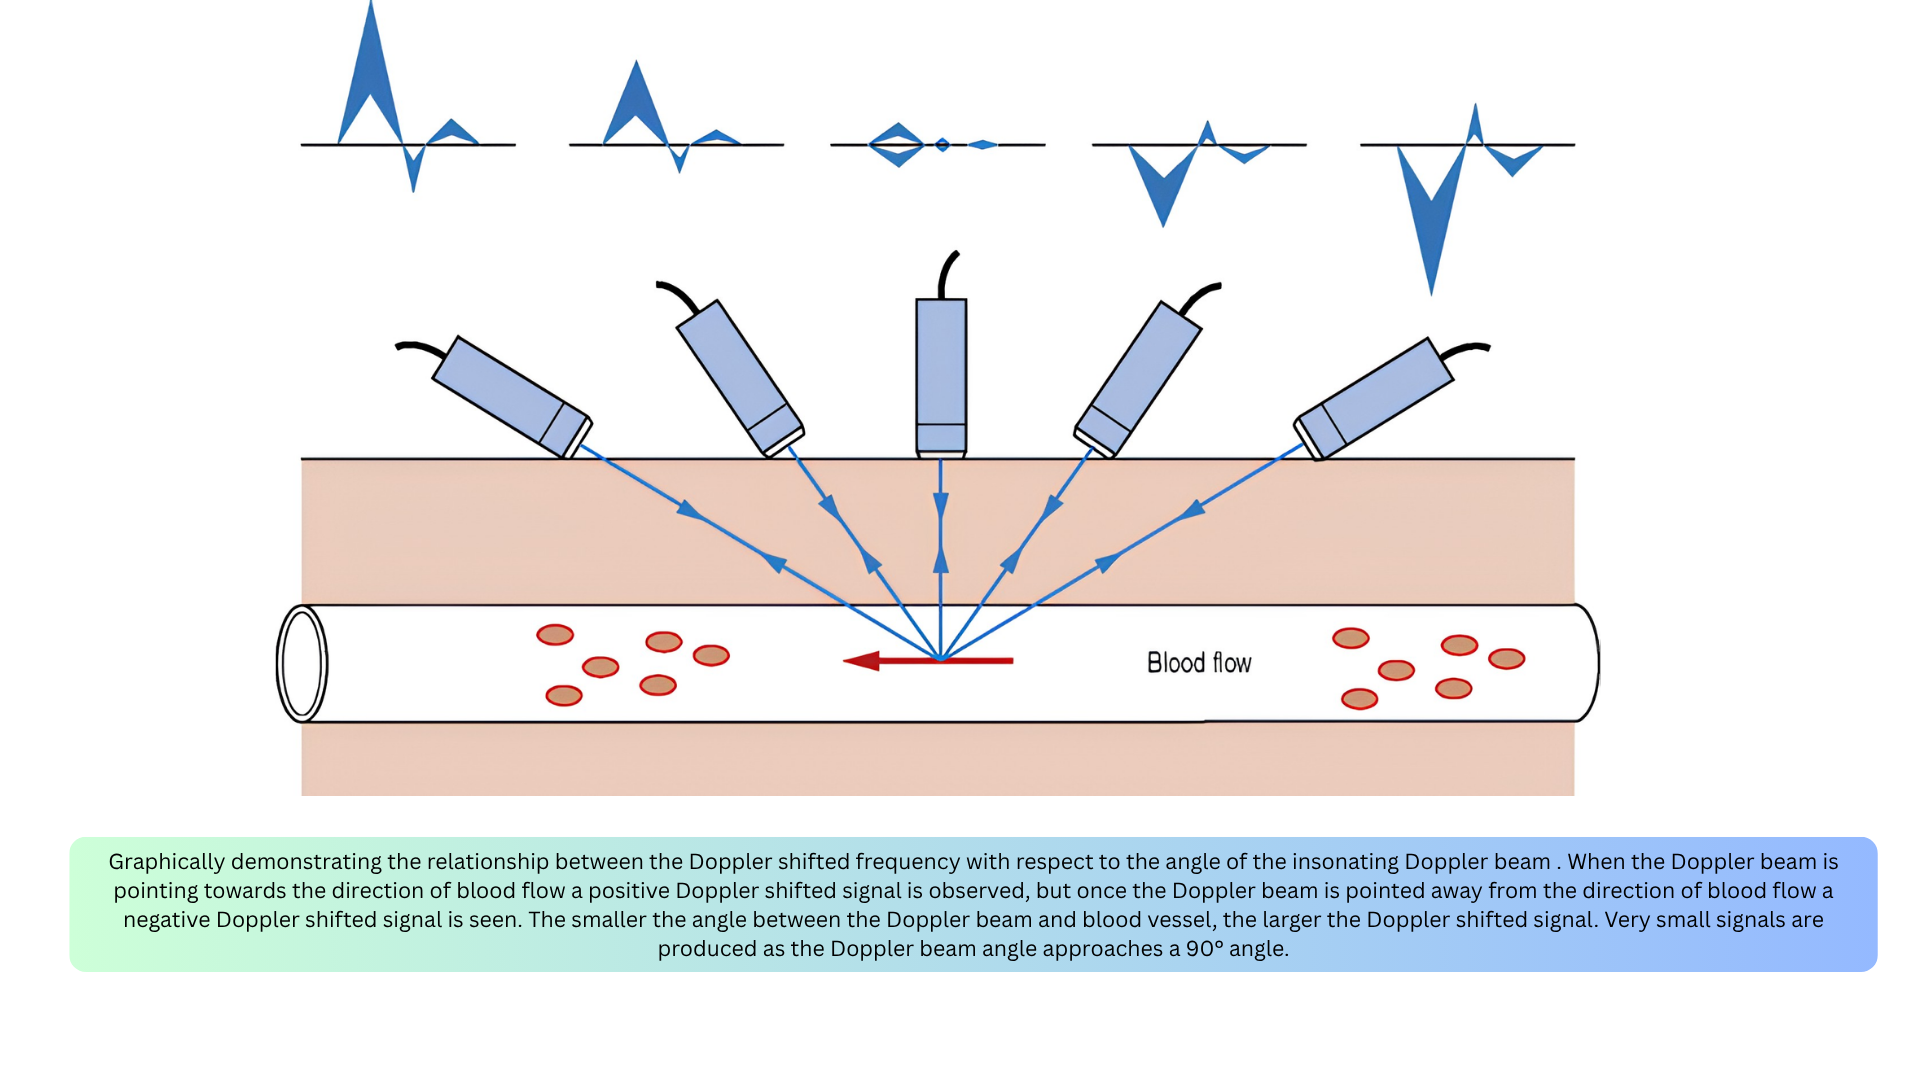
🚨Key point: Accurate velocity measurement depends on parallel alignment between the ultrasound beam and blood flow (Figure below).
- If θ < 20°, the error is less than 6%.
- If θ > 20°, velocity and therefore pressure gradients will be significantly underestimated.
By convention, flow toward the transducer is displayed above the baseline, and flow away is displayed below the baseline. The Y-axis represents velocity (m/s), and the X-axis represents time (seconds).
Flow Direction
◾️Color Doppler provides information on two aspects: the presence of flow and its direction. It does not provide quantitative details such as the exact velocity or allow waveform analysis
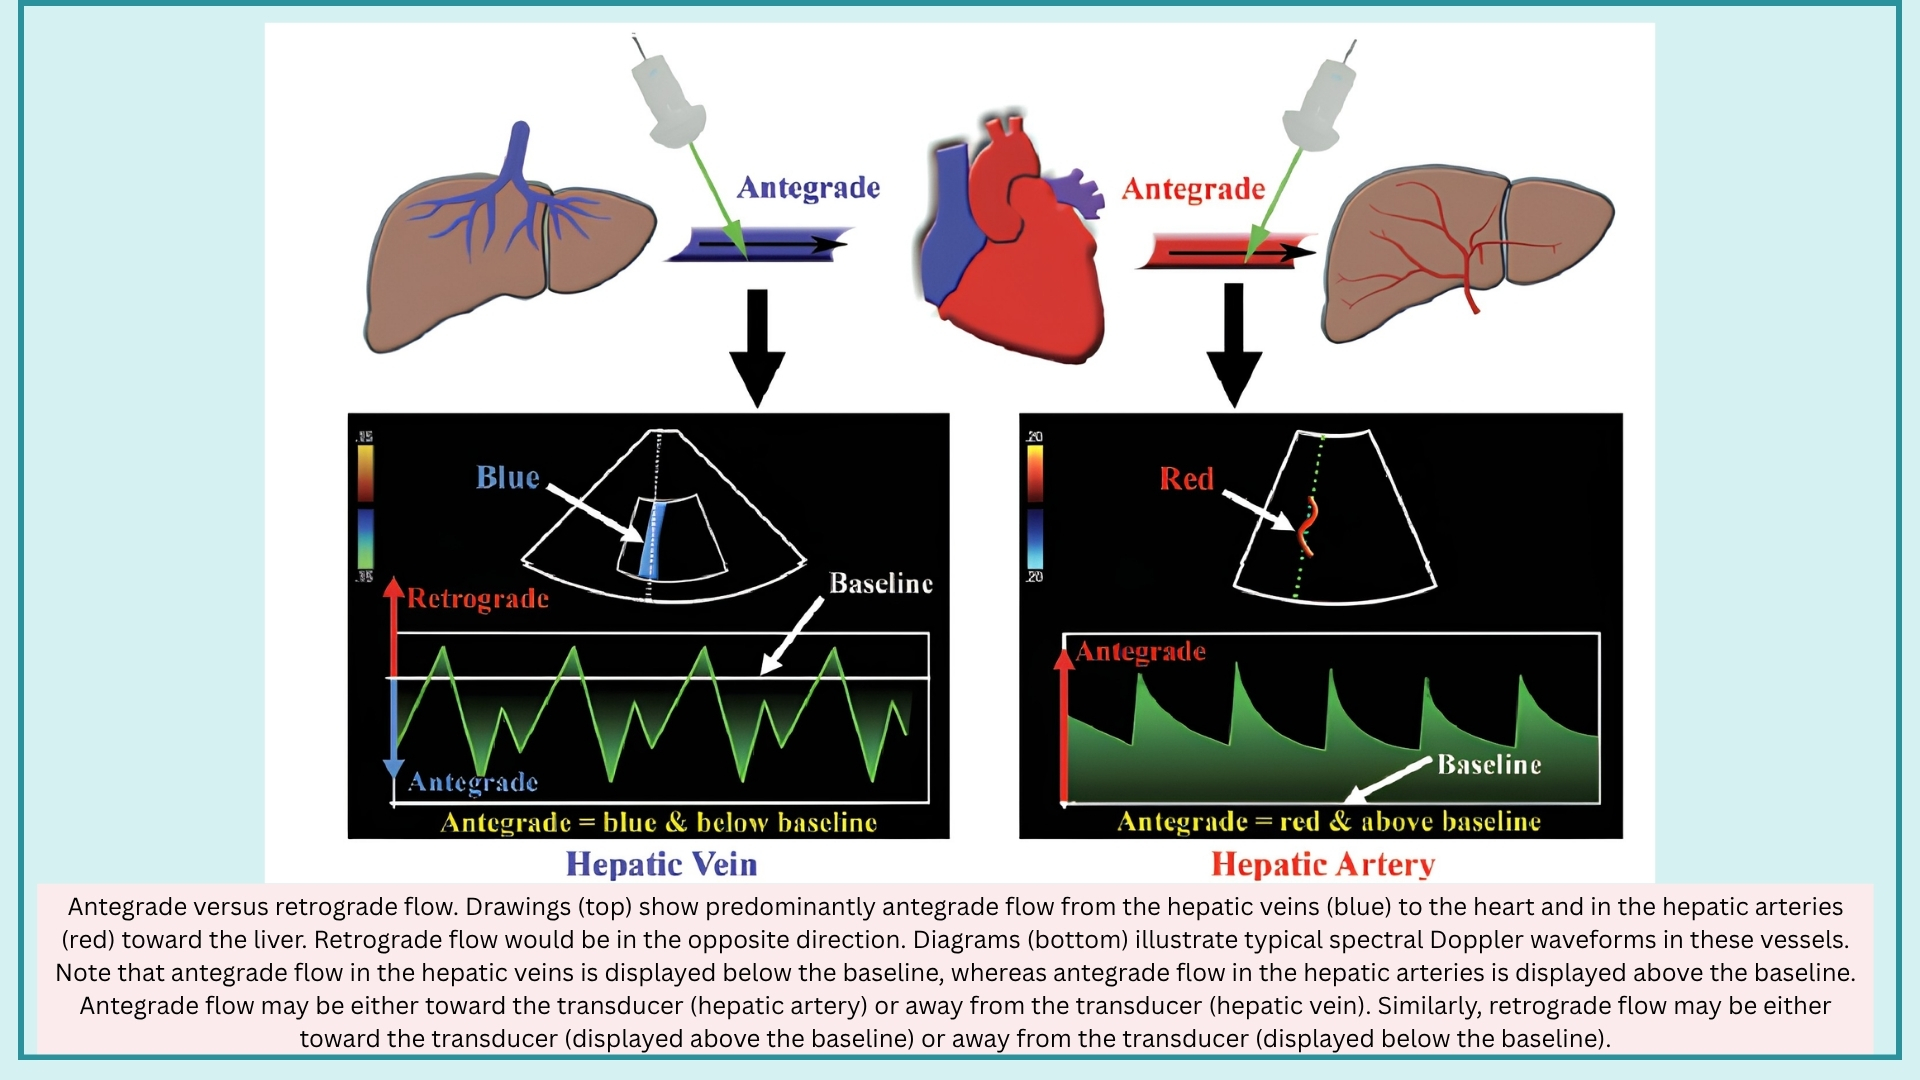
◾️Direction of Flow may be described in two fundamentally distinct systems
- With Respect to the Circulatory System
- Antegrade Flow
- Defined as flow in the forward direction relative to its expected direction in the circulatory system.
- Moves away from the heart in systemic arteries and toward the heart in systemic veins.
- May be toward or away from the transducer, depending on the spatial relationship between the probe and the vessel.
- Consequently, may be displayed above or below the baseline on spectral Doppler.
- Retrograde Flow
- Defined as flow in the reverse direction relative to its expected direction in the circulatory system.
- Example: retrograde flow in severe portal hypertension, where flow reverses away from the liver (hepatofugal).
- May be away from or toward the transducer.
- Antegrade Flow
- With Respect to the Ultrasound Probe
- Flow Away From the Transducer
- Color Doppler: blue
- Spectral Doppler: displayed below the baseline
- Flow Toward the Transducer
- Color Doppler: red
- Spectral Doppler: displayed above the baseline
- Flow Away From the Transducer
Key Principle: The terms antegrade and retrograde describe flow relative to the circulatory system, whereas toward and away from the transducer describe flow relative to the ultrasound probe. These two frameworks are independent — antegrade flow may be displayed either above or below the baseline, and retrograde flow may likewise be displayed either above or below the baseline.
Spectral Doppler Display
The spectral waveform is displayed with velocity on the Y-axis and time on the X-axis. On Color Doppler US, flow moving towards the probe appears red, and flow moving away from the probe appears blue. On the spectral Doppler, the flow waveform appears above the baseline if flow is directed toward the probe, and below the baseline if it’s moving away from the probe *. The general features of the spectral waveform are shown below.
Before describing the framework for arterial and venous waveforms, it is essential to define the morphologic features of the spectral Doppler display. Every waveform, arterial or venous, normal or abnormal, is interpreted through these fundamental components.
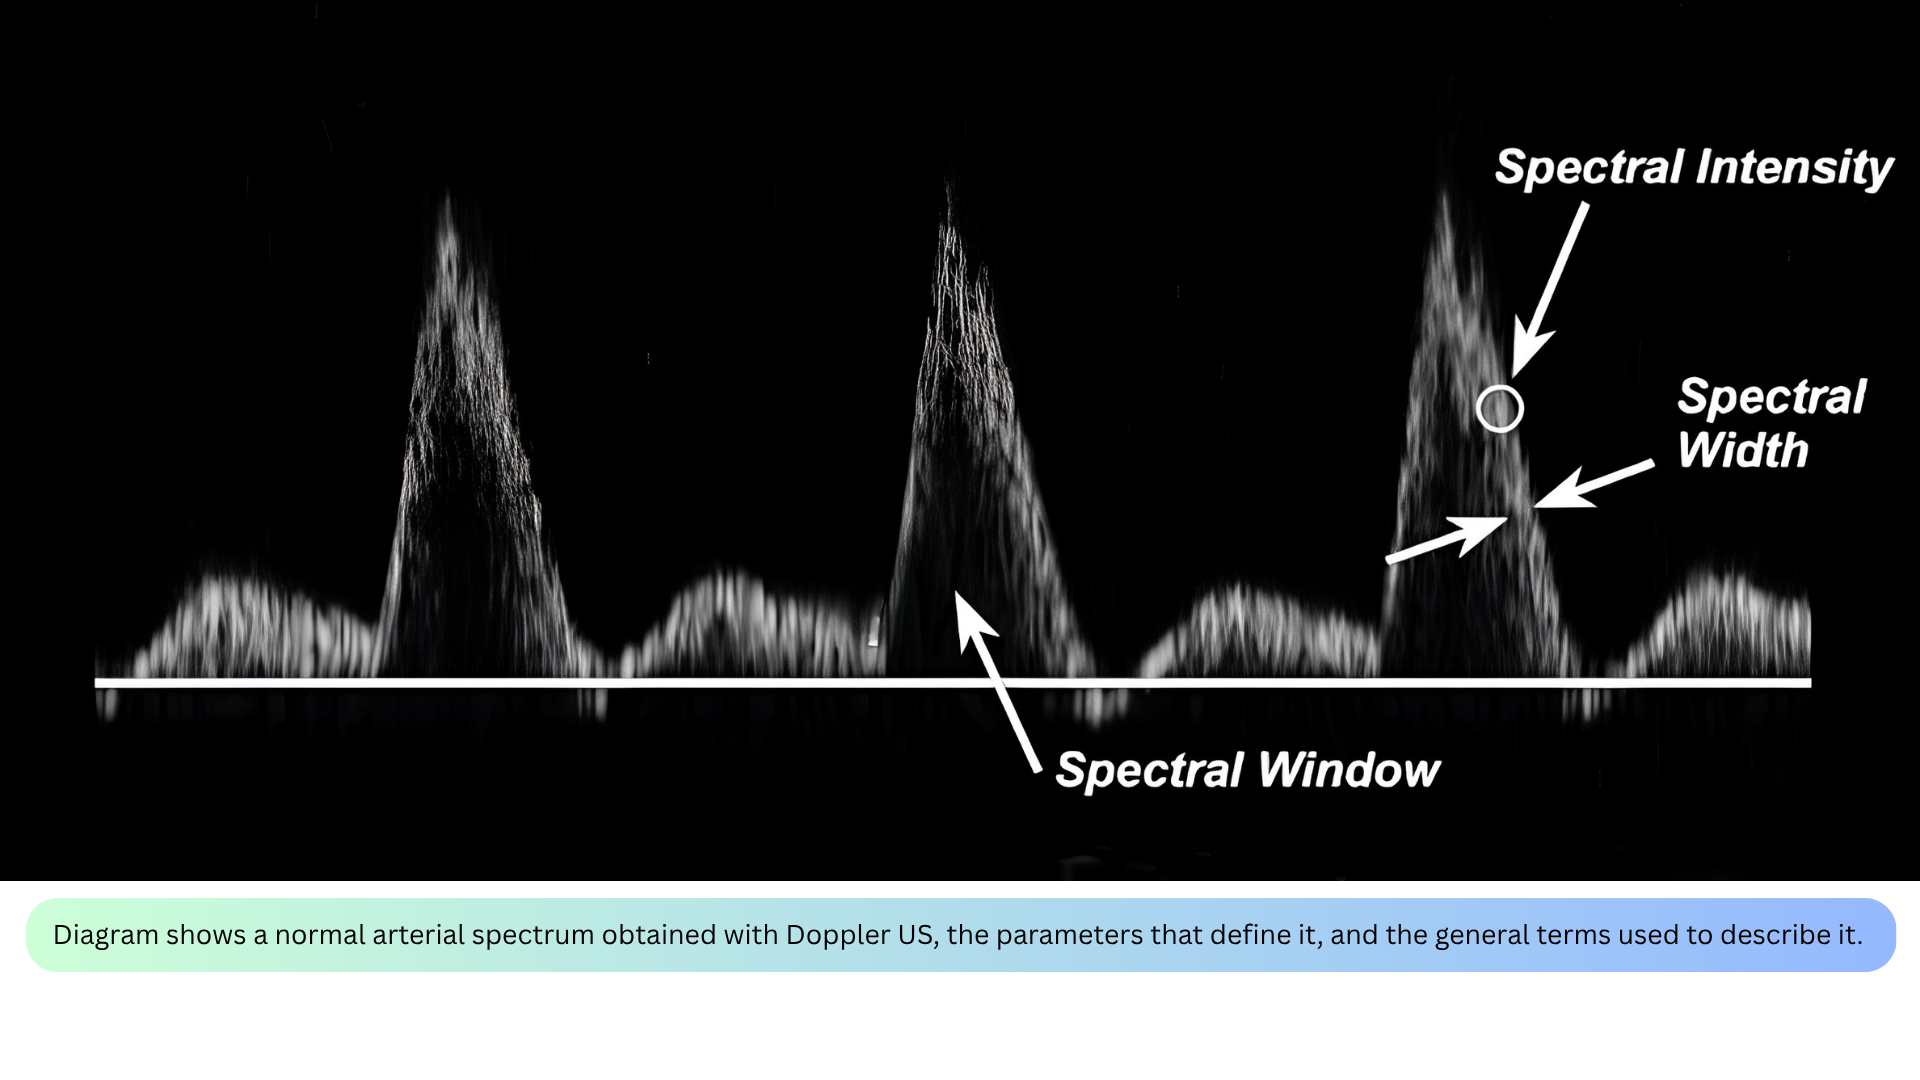
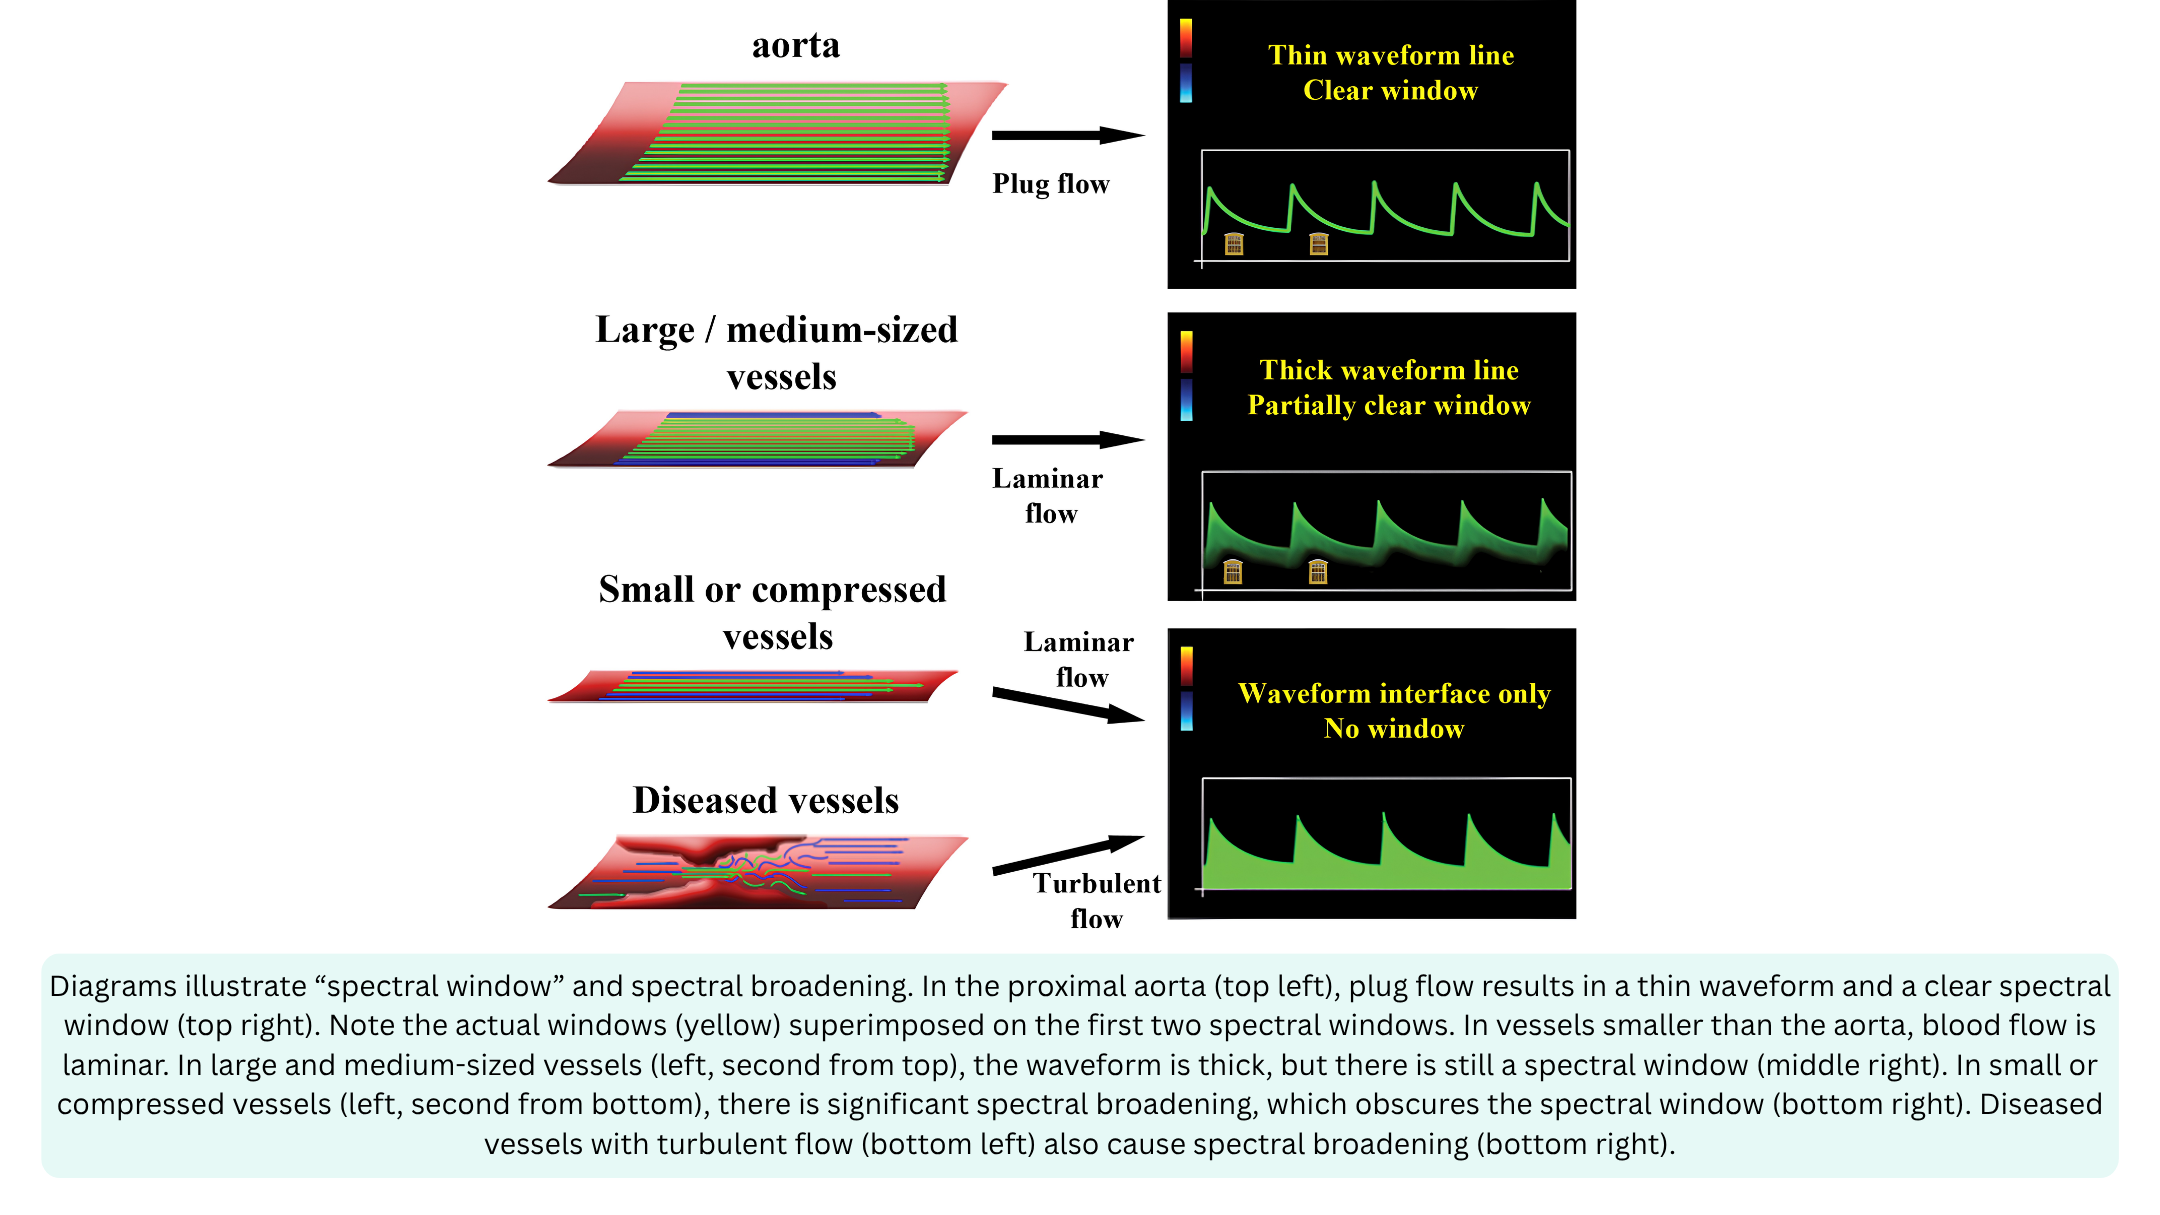
◾️Spectral Window
- Definition: The clear, dark area under the systolic peak where no velocities are recorded.
- What it tells you: Whether flow is laminar or turbulent.
- Clear window = laminar flow (most blood cells moving at similar velocities).
- Filled-in window = turbulent flow (blood cells moving at many different velocities).
- Clinical relevance: A clear window is normal in large vessels; a filled-in window suggests stenosis, regurgitation, or small vessel size.
◾️Spectral Broadening
- Definition: The “filling in” of the spectral window — widening of the velocity band on the spectral display.
- What it tells you: The presence of turbulent or disturbed flow.
- Laminar flow produces a narrow, smooth, parabolic or flat envelope with a well-defined outer edge and a relatively dark interior.
- Turbulent flow produces a broad, filled-in envelope with spectral broadening; the interior of the envelope is bright and dense because many velocities are being recorded simultaneously.
- Clinical relevance: Spectral broadening is a visual clue to turbulence, and therefore to pathology such as stenosis or regurgitation.
- Causes of spectral broadening include
- Artificial: Large sample volume, High gain
- Physiologic: Normal small vessels (hepatic arteries), normal turbulence (bifurcations)
- Pathologic: Compressed vessels (hepatic vein in cirrhosis), Turbulant flow (post-stenotic flow)
- Causes of spectral broadening include
◾️Spectral Width
- Definition: The vertical thickness of the spectral band at any given moment.
- What it tells you: The range of velocities present at that moment.
- Narrow width = most cells moving at similar velocities (laminar).
- Wide width = cells moving at many different velocities (turbulent).
- Clinical relevance: Spectral width is the visual representation of spectral broadening; a wider band means a greater range of velocities.
◾️Spectral Intensity
- Definition: The brightness of the spectral display at any given point on the waveform.
- Reflects the number of red blood cells moving at a specific velocity at that moment.
- Brighter = more red blood cells traveling at that velocity.
- Dimmer = fewer red blood cells traveling at that velocity.
- The darkest part of the envelope represents the velocity at which the largest number of blood cells are traveling (the modal velocity).
- PWD works best for laminar, low-velocity flow (e.g., LVOT, mitral inflow)
- CWD is required for turbulent, high-velocity flow (e.g., TRJV, aortic stenosis)
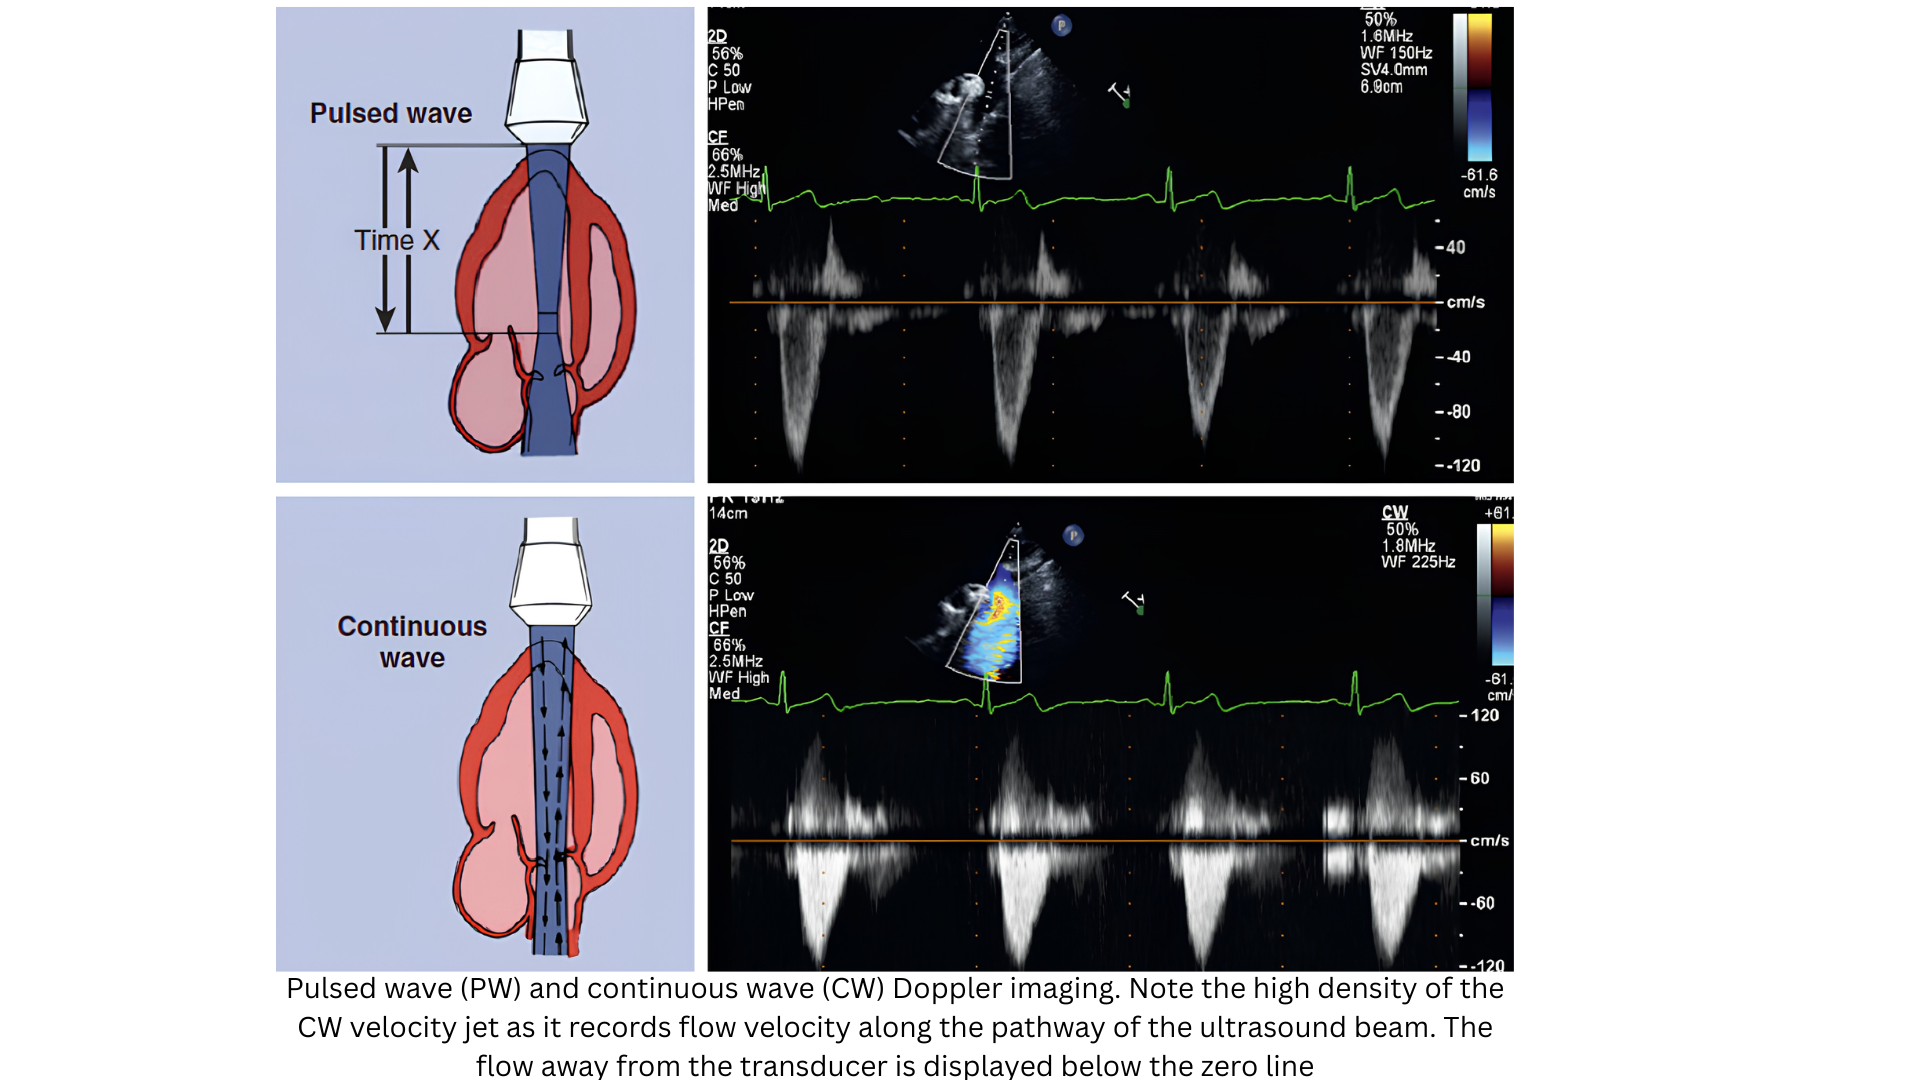
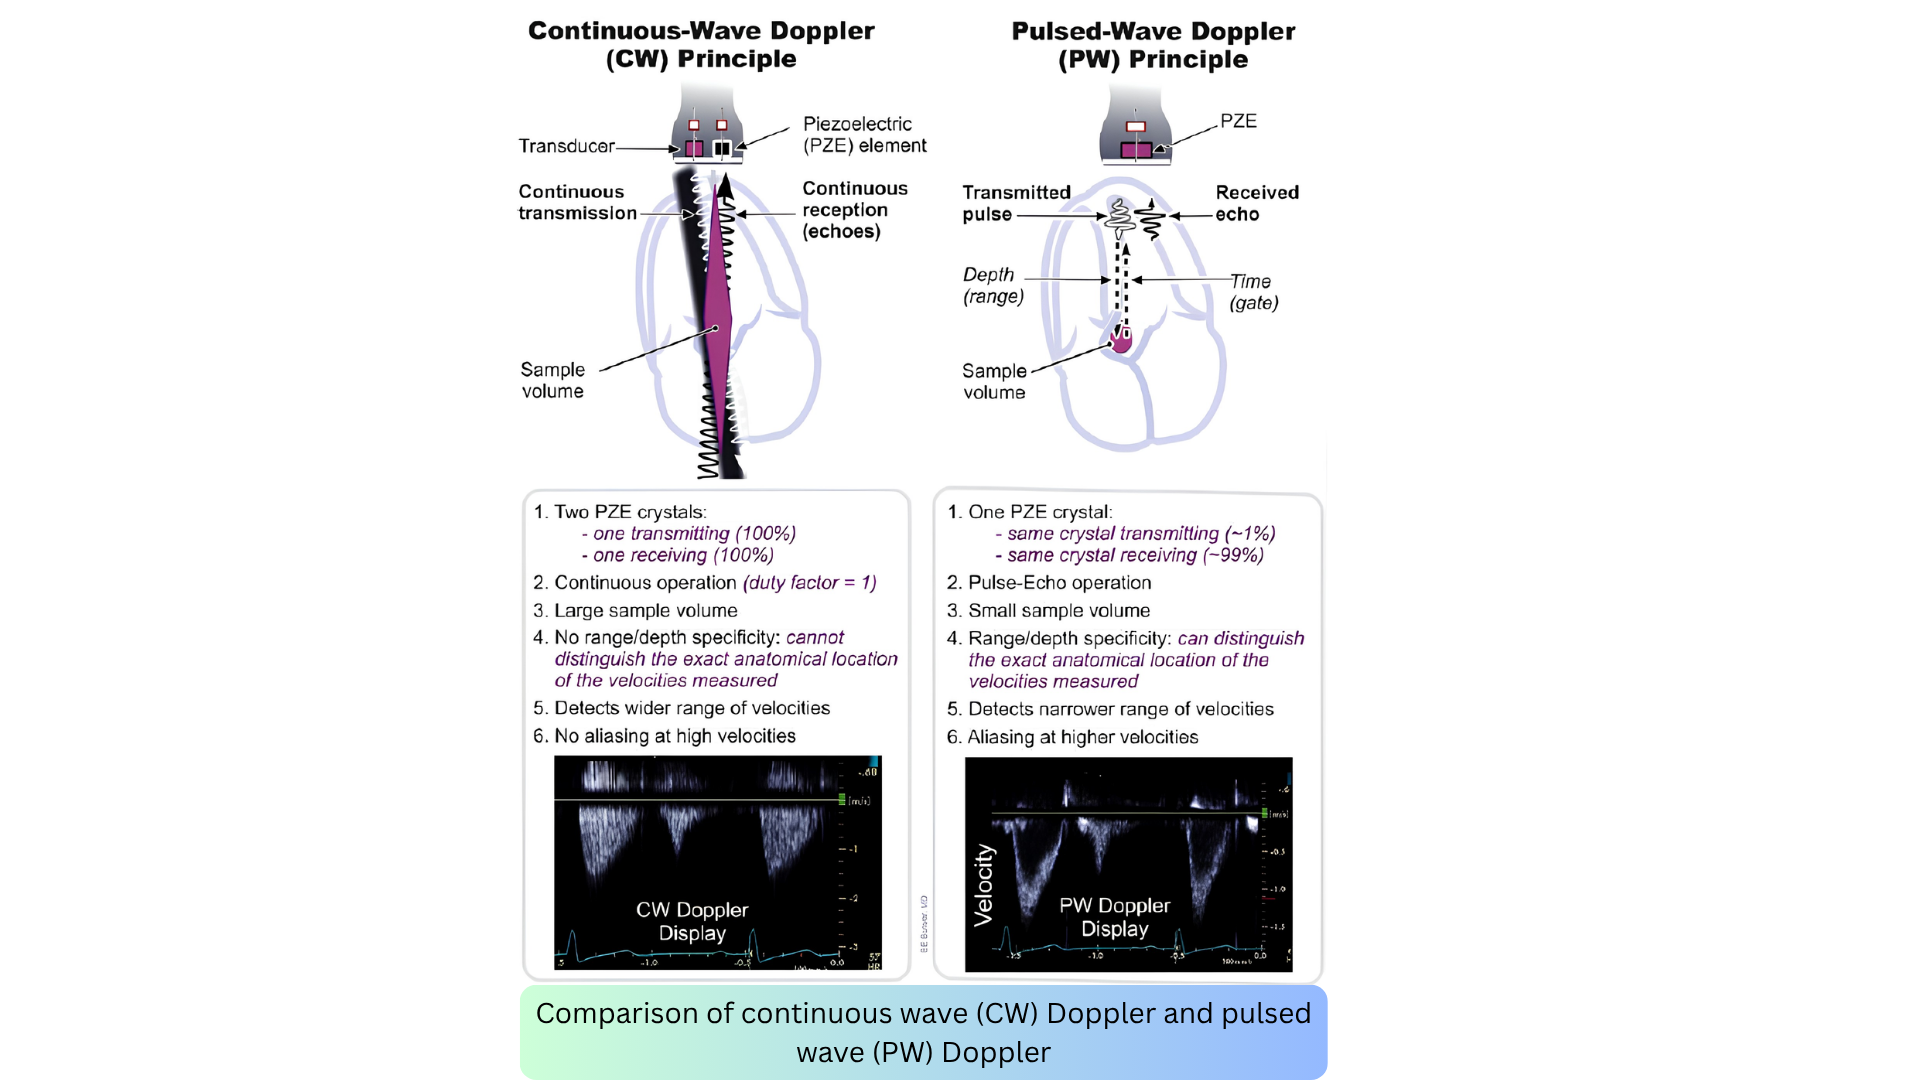
📍PWD envelopes tend to be narrow and dark (laminar flow at one depth), while CWD envelopes tend to be broad and filled-in (all velocities along the beam, often turbulent). Middle and right below figures.
Envelope Shape and Physiology
The shape of the spectral envelope is not just a visual pattern; it is a direct reflection of the underlying hemodynamics. The contour, density, and width of the envelope tell you whether flow is laminar or turbulent, whether resistance is high or low, and whether the jet is low-velocity or high-velocity.
Understanding these patterns is essential for hemodynamic assessment at the bedside. The table below summarizes the characteristic envelope shapes for each Doppler modality and site, along with the physiology they represent.
Spectral Doppler Waveform Information
Every spectral waveform has morphologic features that provide information regarding direction, velocity, and acceleration

◾️Peak Systolic Velocity (PSV)
- Definition: The highest velocity point during systole.
- What it tells you: The maximum velocity reached at that point in the cardiac cycle. It is used to calculate pressure gradients via the Bernoulli equation (ΔP = 4v²).
- Clinical relevance: Elevated PSV indicates stenosis or high-velocity flow; it is the primary measurement for grading aortic stenosis severity.
◾️End-Diastolic Velocity (EDV)
- Definition: The velocity at the end of diastole, just before the next systole begins.
- What it tells you: The amount of forward flow remaining at end-diastole. It reflects the resistance of the distal vascular bed.
- Clinical relevance:
- High EDV = low-resistance vascular bed (e.g., internal carotid, renal artery) — continuous forward flow.
- Low or absent EDV = high-resistance vascular bed (e.g., external carotid, fasting mesenteric) — little to no forward flow.
- Reversed EDV = abnormal (e.g., severe regurgitation or steal phenomenon).
◾️Acceleration (Slope)
- Definition: The rate of change in velocity over time — the slope of the spectral waveform.
- What it tells you: How quickly blood accelerates to peak velocity.
- Clinical relevance:
- Steep slope = rapid acceleration — normal in most arteries.
- Gradual (prolonged) slope = delayed acceleration — suggests proximal stenosis (tardus-parvus pattern).
- Measured as acceleration time (AT): normal AT < 140 ms in the common femoral artery; prolonged AT > 140 ms suggests proximal obstruction.
◾️Inflection Point
- Definition: A bend in the spectral curve where acceleration changes.
- What it tells you: The moment when the rate of acceleration shifts — either speeding up, slowing down, or reversing direction.
- Clinical relevance:
- Inflection points are the origin of the audible sounds heard during Doppler (e.g., bruits, murmurs).
- They mark the boundaries between phases of the cardiac cycle (e.g., systolic peak, early diastolic reversal, late diastolic forward flow).
- The number of inflections per cycle determines the number of phases:
- Aninflectional = no bends (continuous flow)
- Di-inflectional = 2 bends (e.g., biphasic)
- Tetrainflectional = 4 bends (e.g., normal hepatic vein waveform)
Waveform Descriptors
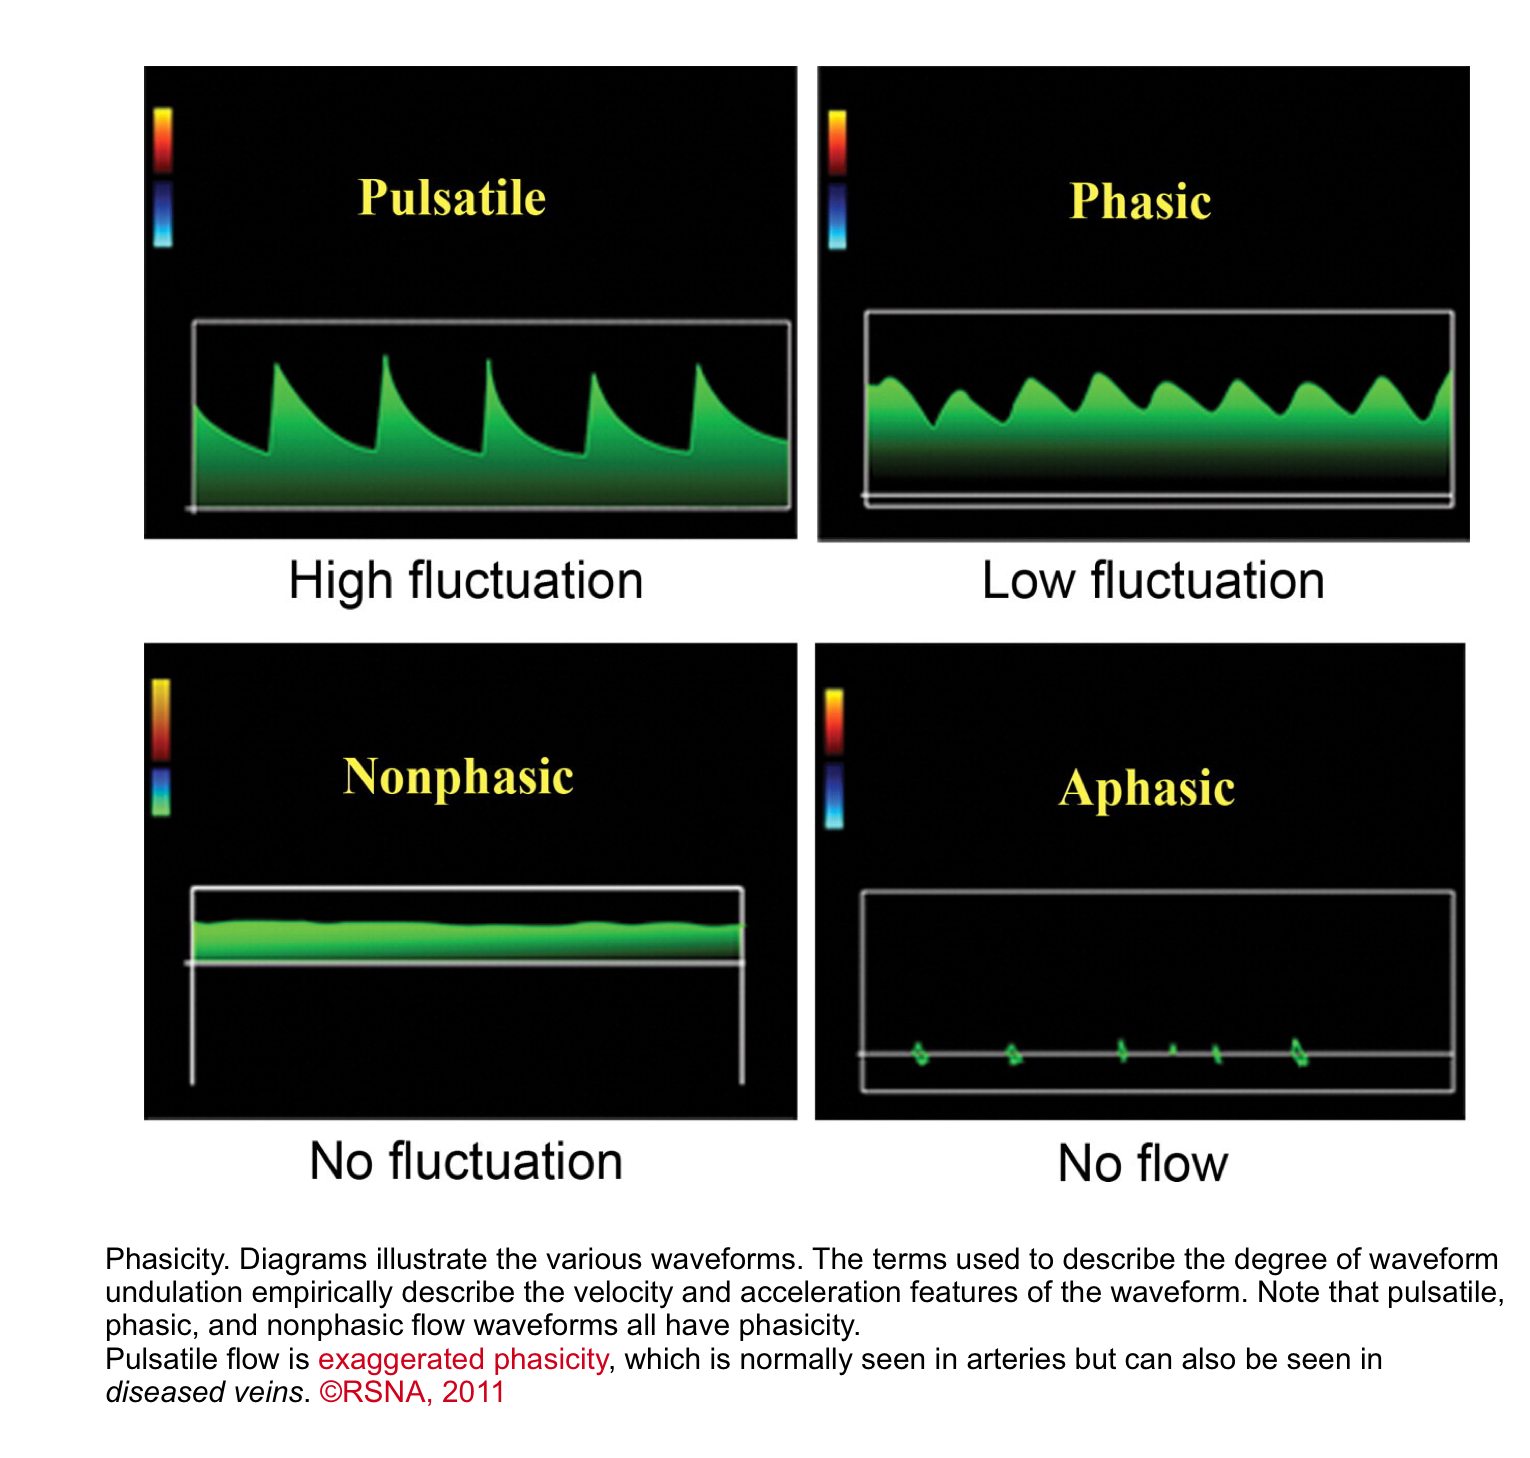

◾️Undulation
- Waveforms can be classified by the degree of undulation (phasicity), a spectrum that applies to both arteries and veins*.
- Pulsatile: Marked undulation; steep slopes; wide vertical range between inflections.
- ✅ This is typical for arteries, where the high-pressure surge of blood during ventricular systole creates a sharp peak, followed by a rapid deceleration.
- ⚠️ Venous Implication: When seen in peripheral veins, a pulsatile waveform is abnormal and indicates that high pressure from the right side of the heart is being transmitted backwards (retrograde). This is a hallmark of conditions like tricuspid regurgitation or right heart failure.
- Phasic: Mild undulation; shallow slopes; small vertical range between inflections
- This gentle undulation is due to normal respiratory or cardiac pressure changes
- ✅ This is the normal pattern for peripheral veins. Flow velocity increases and decreases smoothly as intrathoracic and intra-abdominal pressures change during inhalation and exhalation
- Clinical Significance: The presence of normal phasic variation confirms that the vein is patent and that the pressure changes from breathing are being transmitted properly.
- ⚠️ A loss of phasicity (a continuous, flat waveform) is a key sign of a central obstruction (like a deep vein thrombosis) blocking the normal flow
- Continuous (Nonphasic)
- Flat waveform; steady signal; no fluctuation. The waveform has flow but no velocity or acceleration changes
- Aphasic
- Absent spectral signal; no flow.
- Pulsatile: Marked undulation; steep slopes; wide vertical range between inflections.
◾️Phase quantification
- In the presence of a discrete change in the direction of the flow, the waveform can be called biphasic, triphasic, or tetraphasic.
- Monophasic: Waveform does not cross the zero-flow baseline; blood flows in a single direction throughout the cardiac cycle
- Multiphasic: Waveform crosses the zero-flow baseline; contains both forward and reverse velocity components.
Before interpreting any Doppler waveform, it is essential to understand the language of the spectral display. Every waveform- arterial or venous, normal or abnormal is described using a core set of terms that define its direction, velocity, acceleration, and spectral characteristics.
These terms are not just descriptors; they are the foundation of hemodynamic assessment at the bedside. The table below summarizes the key spectral Doppler terminology and what each term tells you about the underlying physiology.
Color Doppler (CD)
Color Doppler is a parametric display of pulsed Doppler signals; it displays color-coded blood flow velocities, by convention, mapped onto the B-mode (2D, M-mode, or 3D) image.
Main Features
◾️How it works
- Color Doppler processing is based on PW Doppler imaging technology; however, in color flow Doppler, the time shift between subsequent measurements is determined at multiple sample volumes along multiple scan lines. The calculated velocities are linked to a preset color scheme by means of a specific color map (displayed on the ultrasound image), according to which the direction of flow and its velocity amplitudes can be determined.
◾️Color convention
- By convention, flow away from the transducer is colored in blue, whereas flow towards the transducer is coded in red (BART: Blue Away, Red Towards).
- The color flow Doppler data are displayed superimposed on a 2D or M-mode image, allowing for visualization of flow patterns with additional information on the spatial location of the flow, nature of the flow (turbulence, direction of flow), geometry of potential connections between the heart chambers or great vessels, etc.
◾️Aliasing
- Due to the same basic principles of PW Doppler, color flow Doppler is also subject to aliasing. When the velocity exceeds the Nyquist limit, the color “wraps around”; high-velocity jets may appear as a mosaic of colors (red, blue, green, yellow). A high variance of velocity in a particular pixel is mostly displayed as shades of green, which is indicative of turbulent flow.
◾️Display
- The color flow Doppler display includes:
- Velocity scale — shows the Nyquist limit (typically 50–70 cm/s for cardiac imaging)
- Variance scale — shows the degree of turbulence (green)
- Color wheel — shows the relationship between velocity, direction, and aliasing
◾️Clinical applications
- Color Doppler is used in emergency and critical care for:
- Guiding spectral Doppler — placing the PWD sample volume or CWD cursor in the correct location
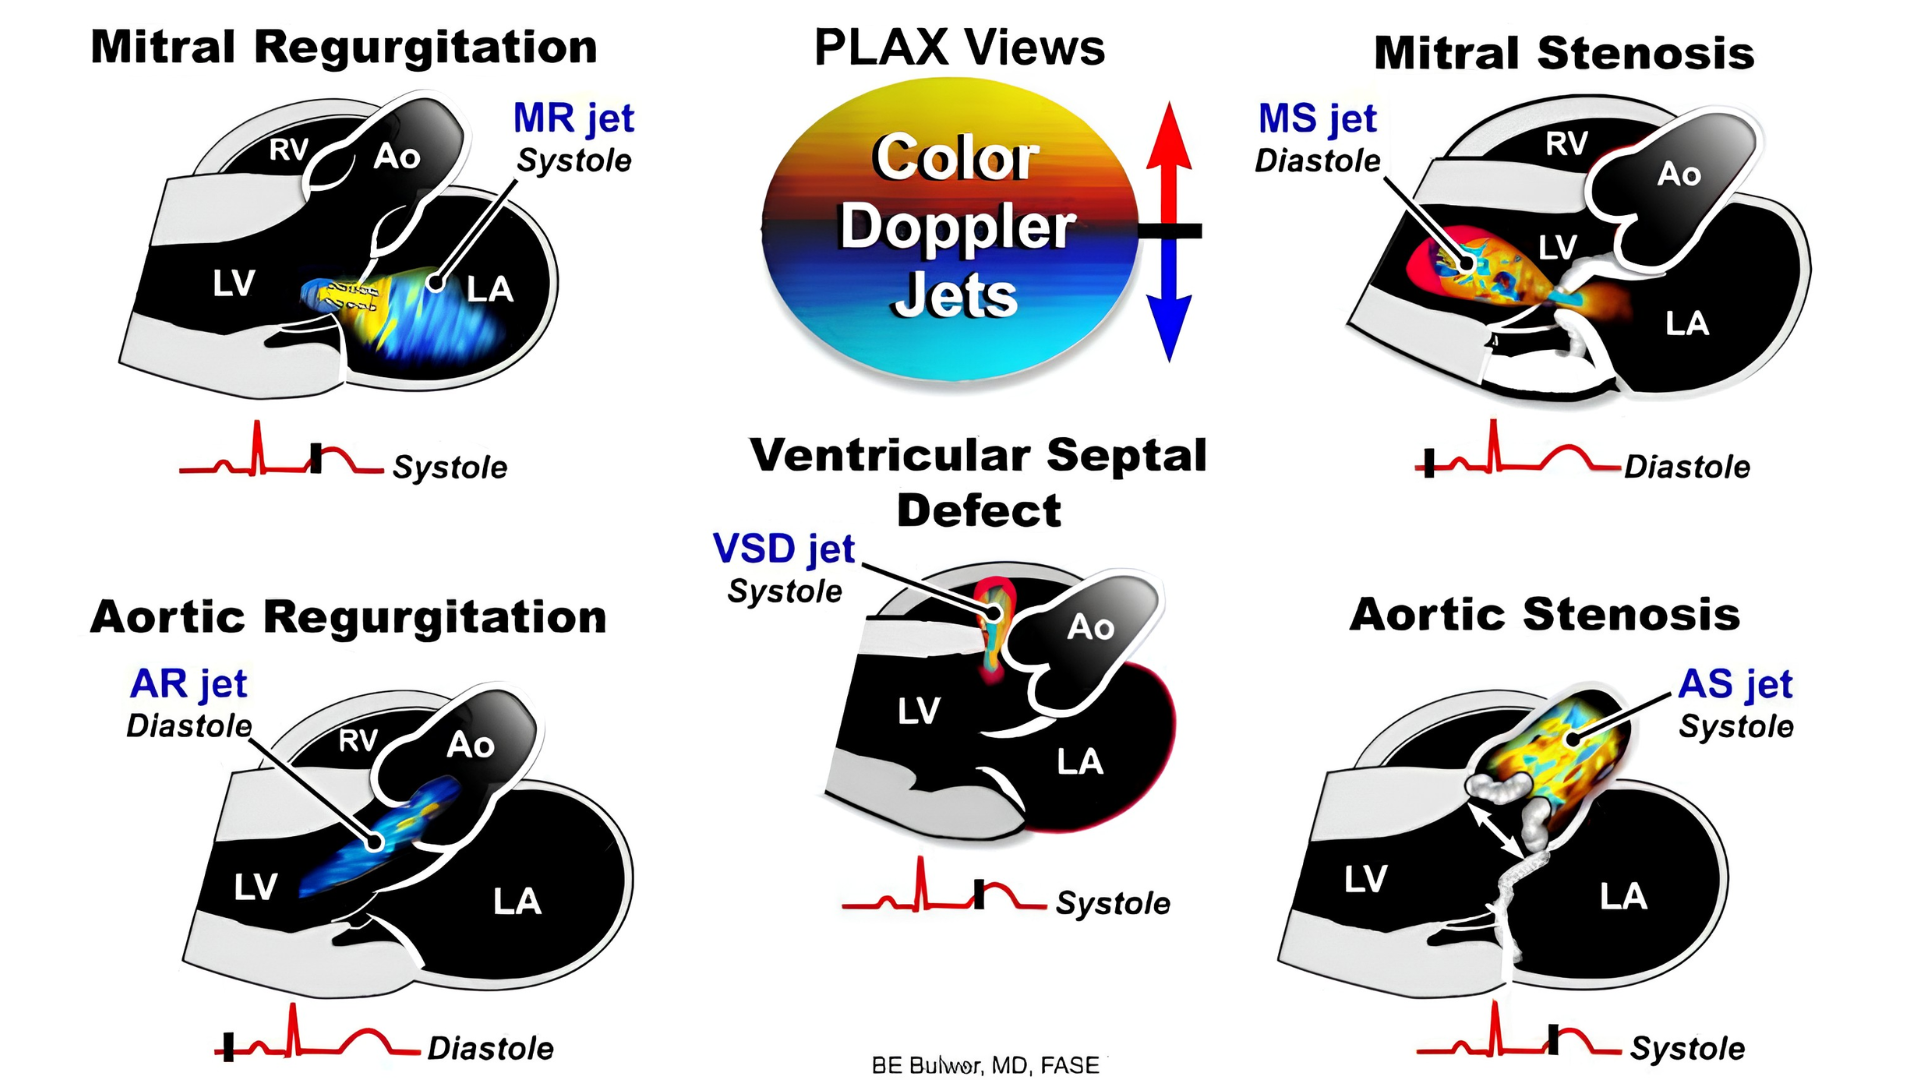
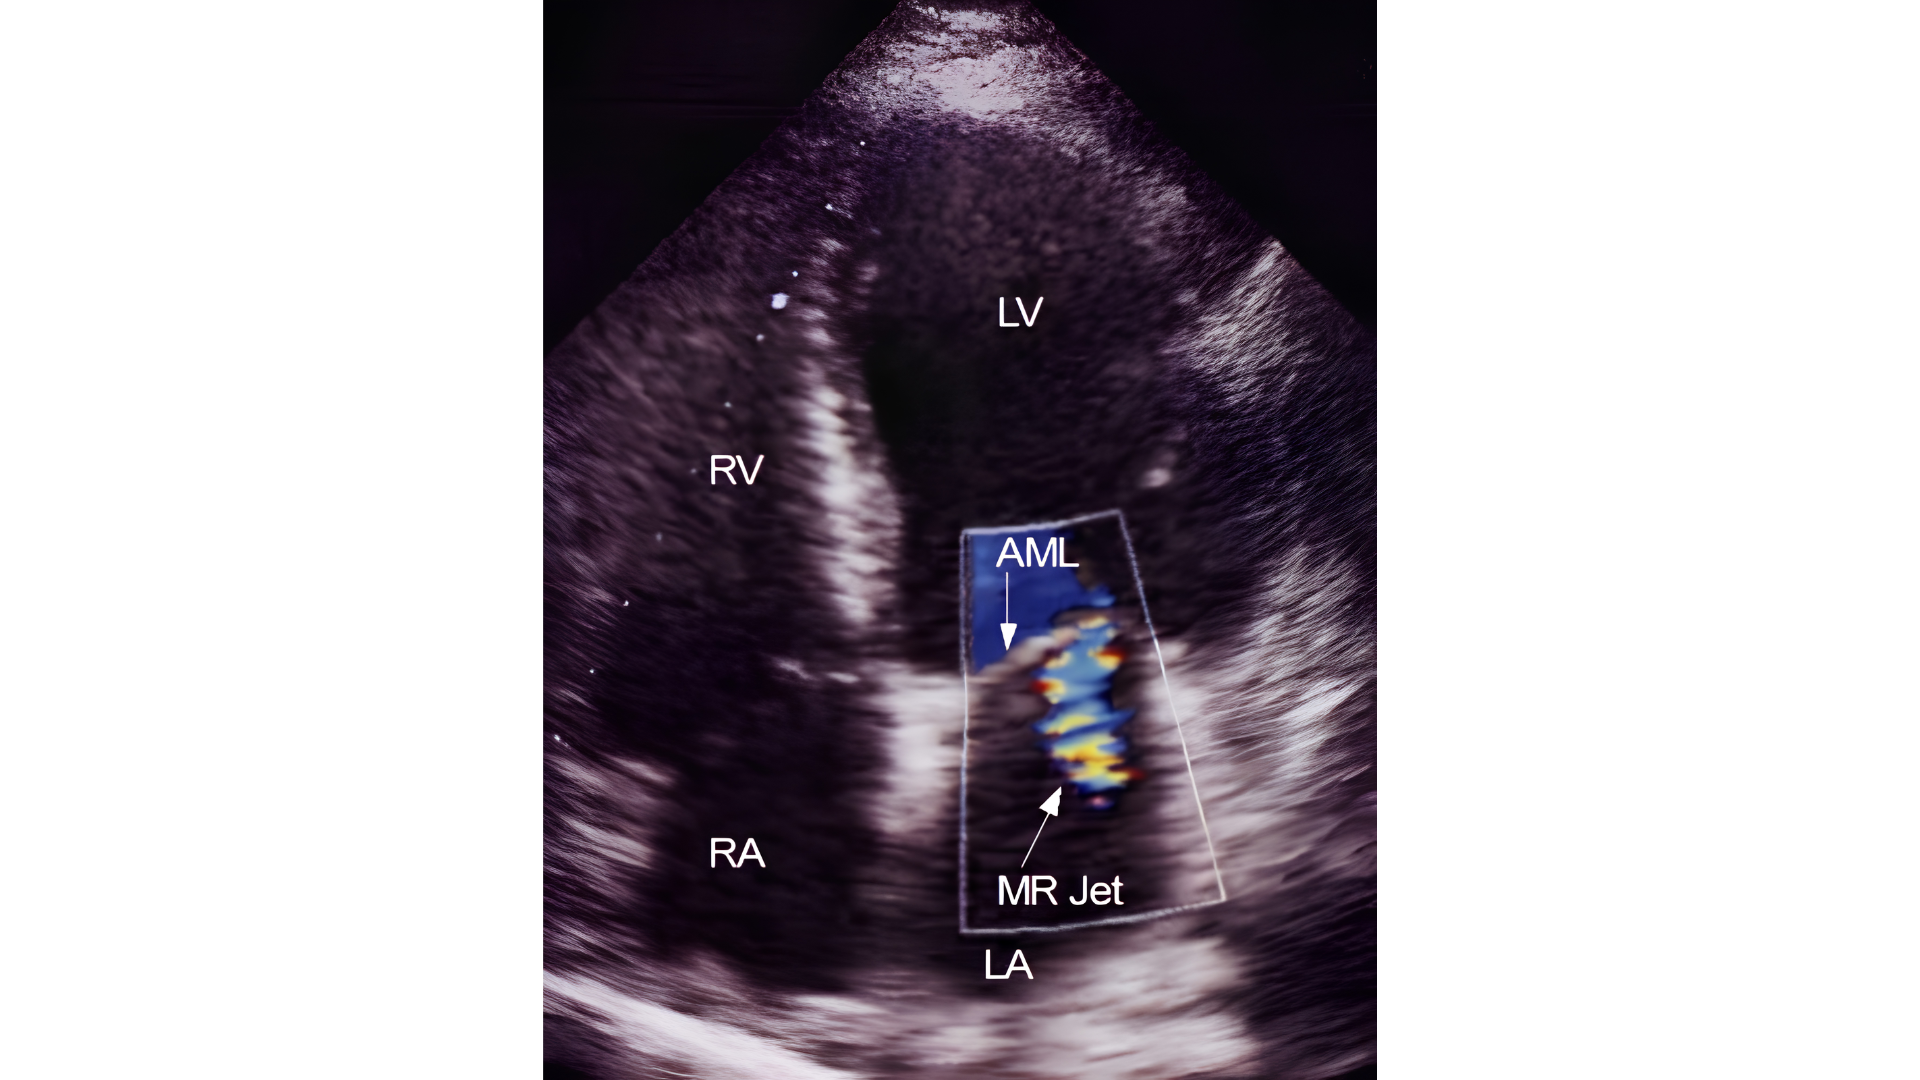
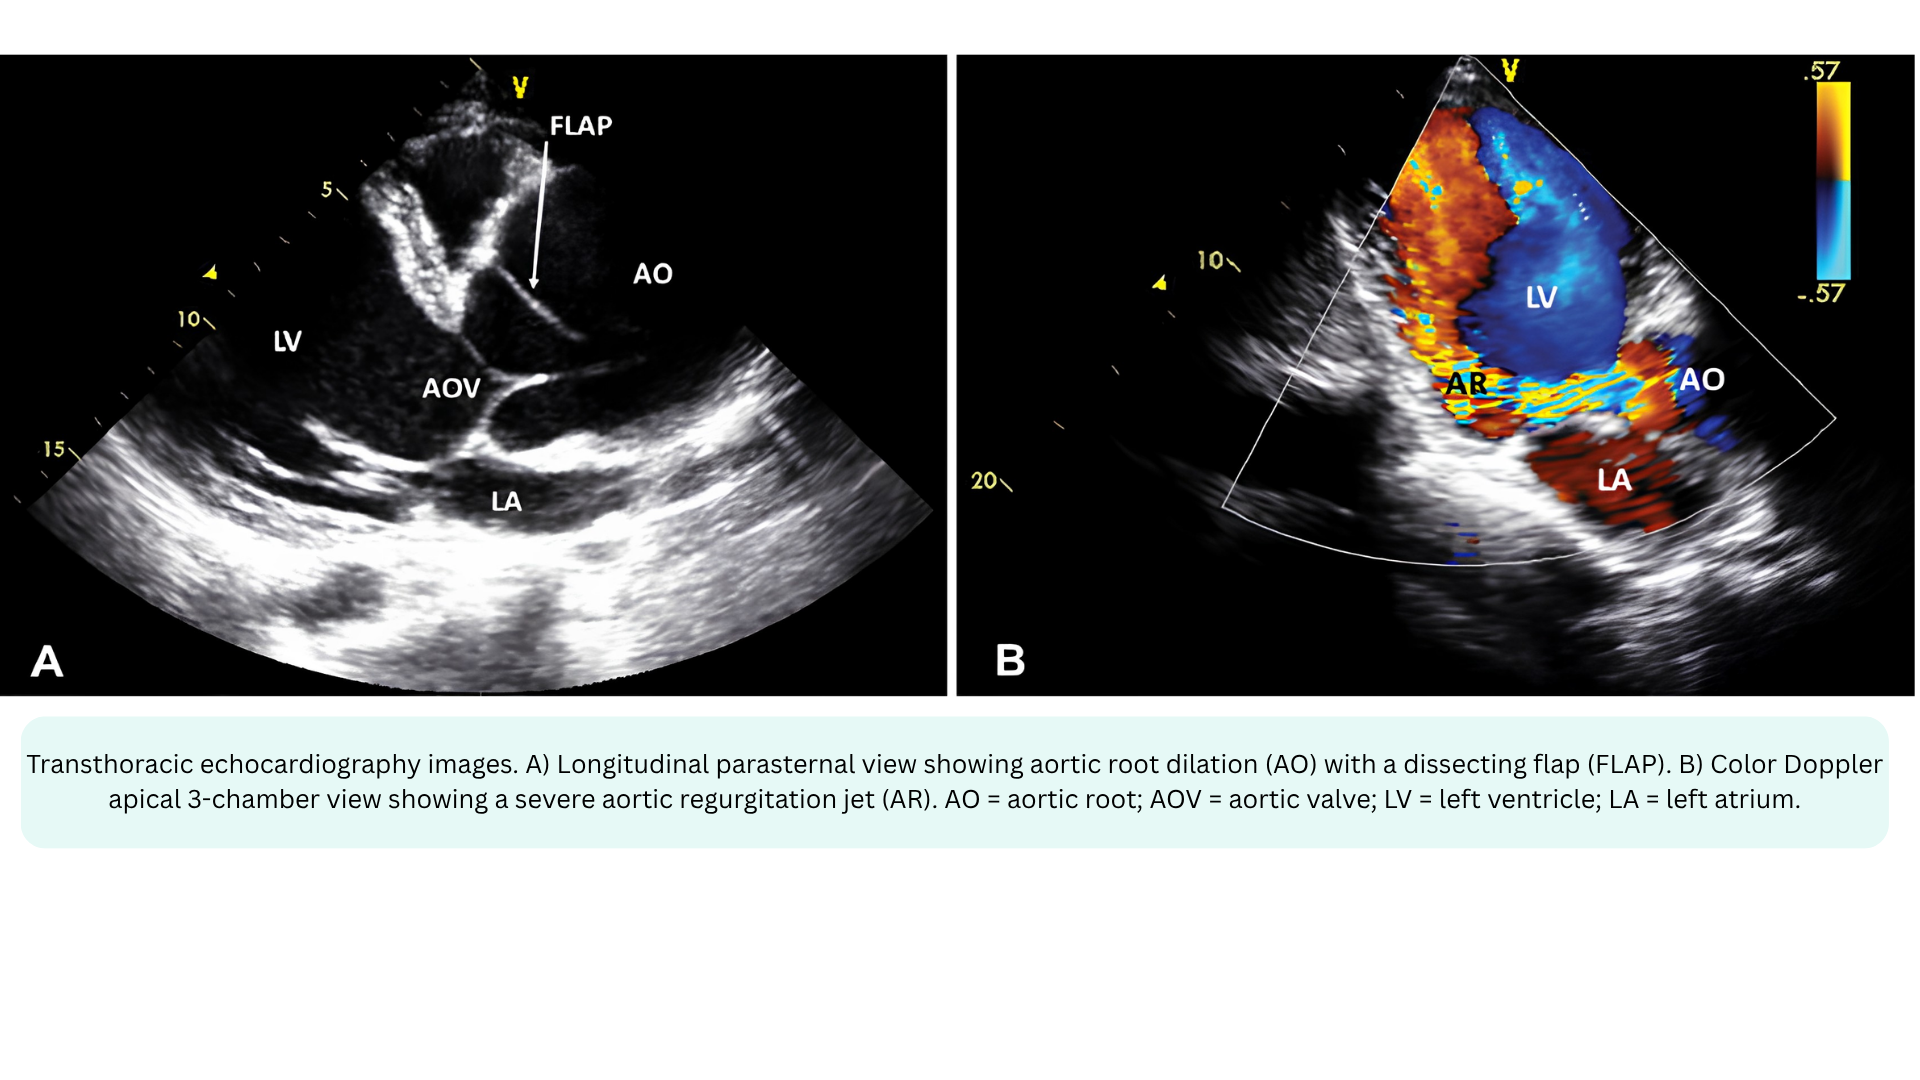
- Detecting valvular regurgitation — Mitral, Aortic, Tricuspid, Pulmonary.
- Detecting valvular stenosis — turbulent flow acceleration
- Assessing shunts — VSD, ASD, PDA
- Evaluating venous flow — hepatic vein, portal vein, pulmonary vein
- Identifying TR jet — for SPAP estimation
◾️Key limitation: Color Doppler is angle-dependent (like all Doppler modalities) and is subject to aliasing. It also has lower temporal resolution than PWD or CWD because it must process multiple sample volumes along multiple scan lines. The color box should be kept as small as possible to maintain frame rate.
📍Color Doppler in the I‑RUSH exam:
- Interface I (LV → Arteries) — Color Doppler over the LVOT to guide PWD sample volume placement for LVOT VTI
- Cardiac assessment: Color Doppler to assess for valvular regurgitation (mitral, aortic)
- Interface III (Capillaries → Venules) — Color Doppler over the hepatic veins to assess flow reversal (venous congestion)
- Interface IV (RV → PA) — Color Doppler over the tricuspid valve to identify the TR jet for CWD alignment
Pulsed-Wave Doppler (PWD)
Main Features
PWD measures velocity at one specific location, the sample volume you place on the 2D image
◾️Range resolution
- PWD has excellent range resolution, meaning it can tell you exactly where along the beam the velocity is coming from. This is its primary advantage.
◾️Max velocity / Aliasing
- PWD is limited by the Nyquist limit (half the pulse repetition frequency). When velocity exceeds this limit, aliasing occurs — the spectral waveform “wraps around” and becomes uninterpretable. This is its primary limitation.
◾️Display
- PWD produces a spectral waveform showing velocity over time. The envelope is typically narrow with a dark interior (laminar flow), though spectral broadening may occur if flow is turbulent. Depending on where you place the sample volume, you may see either the opening or closing valve click, but not both.
◾️How it works
- PWD transmits a pulse, waits for it to return, then transmits the next pulse. This “wait time” allows the machine to know exactly where the signal came from — but it also limits the maximum velocity that can be measured before aliasing occurs.
◾️What the area under the velocity-time envelope actually represents
- The area under the velocity-time envelope = stroke distance (i.e., the distance blood travels during that period).
- Velocity (m/s) × Time (s) = Distance (m)
- This is the basis of the VTI (Velocity-Time Integral), which is used to calculate stroke volume and cardiac output.
- 🧮The formula for stroke volume is SV (cm3 )= CSA(cm2) × VTI (cm),
- Where CSA is the cross-sectional area of the LVOT (πr²), and
- VTI is the velocity-time integral (the area under the spectral envelope).
◾️When to use PWD
- PWD is ideal for low-velocity, laminar flow where you need to know exactly where the velocity is coming from. Key applications include:
- LVOT VTI → Stroke Volume / Cardiac Output
- Sample just proximal to the aortic valve; normal LVOT velocity is 0.7–1.1 m/s
- RVOT VTI— normal 0.8–1.0 m/s; rounded, late-peaking contour
- Assessing diastolic function — mitral inflow(e’, a’)
- Pulmonary venous flow — S/D ratio
- Assessing LVOT dynamic obstruction
- LVOT VTI → Stroke Volume / Cardiac Output
Continuous-Wave Doppler (CWD)
Main Features
CWD measures velocity along the entire ultrasound beam path. It does not discriminate depth.
◾️Range resolution
- CWD has no range resolution. It cannot tell you where along the beam the velocity originated. This is its primary limitation.
◾️Max velocity / Aliasing
- CWD has no aliasing. Because it continuously transmits and receives ultrasound, there is no Nyquist limit and therefore virtually no limit to the measurable peak velocity.
- ✅This is its primary advantage.
◾️Display
- CWD produces a spectral waveform with a dense, filled-in envelope because it records all velocities along the entire beam path. Spectral broadening is prominent. The envelope is broad and bright because many velocities are being recorded simultaneously. Both opening and closing valve clicks are displayed.
◾️How it works
- CWD continuously transmits and receives ultrasound. The trade-off for unlimited velocity measurement is that you cannot localize the signal to a specific depth.
◾️When to use CWD
- CWD is essential for high-velocity, turbulent flow where you need the peak velocity but don’t need to know exactly where it originates. Key applications include:
- TRJV → Systolic Pulmonary Artery Pressure (PASP). The primary application for pulmonary pressure estimation
- Aortic stenosis gradient. Peak velocity converted to gradient via Bernoulli.
- Regurgitant jets. Mitral, aortic, tricuspid.
- Prosthetic valve gradients, when PWD would alias.
- VSD jets — high-velocity shunt flow.
Bernoulli equation
- The Concept
- Blood flow across a narrowing follows the conservation of energy — as blood speeds up through a stenosis, its pressure drops. The Bernoulli equation describes this relationship between velocity and pressure.
- The measured velocities of blood flow across a given valve can be used to assess pressure gradients between the relevant chambers based on conservation of energy; the Bernoulli equation relates pressure and velocity for fluids in chambers separated by an orifice.
- The Full Equation: The complete form has three parts:
- P₁ − P₂ = ½ρ(V₂² − V₁²) + flow acceleration + viscous friction
- ½ρ(V₂² − V₁²) represents convective acceleration: The pressure drop from speeding up
- Flow acceleration represents the pressure needed to overcome inertia as flow accelerates
- Viscous friction represents the energy lost to friction
- P₁ − P₂ = ½ρ(V₂² − V₁²) + flow acceleration + viscous friction
- The Simplified Equation: In daily practice, flow acceleration and viscous friction are ignored because they are negligible in most clinical situations:
- P₁ − P₂ = ½ρ(V₂² − V₁²)
- The Full Equation: The complete form has three parts:
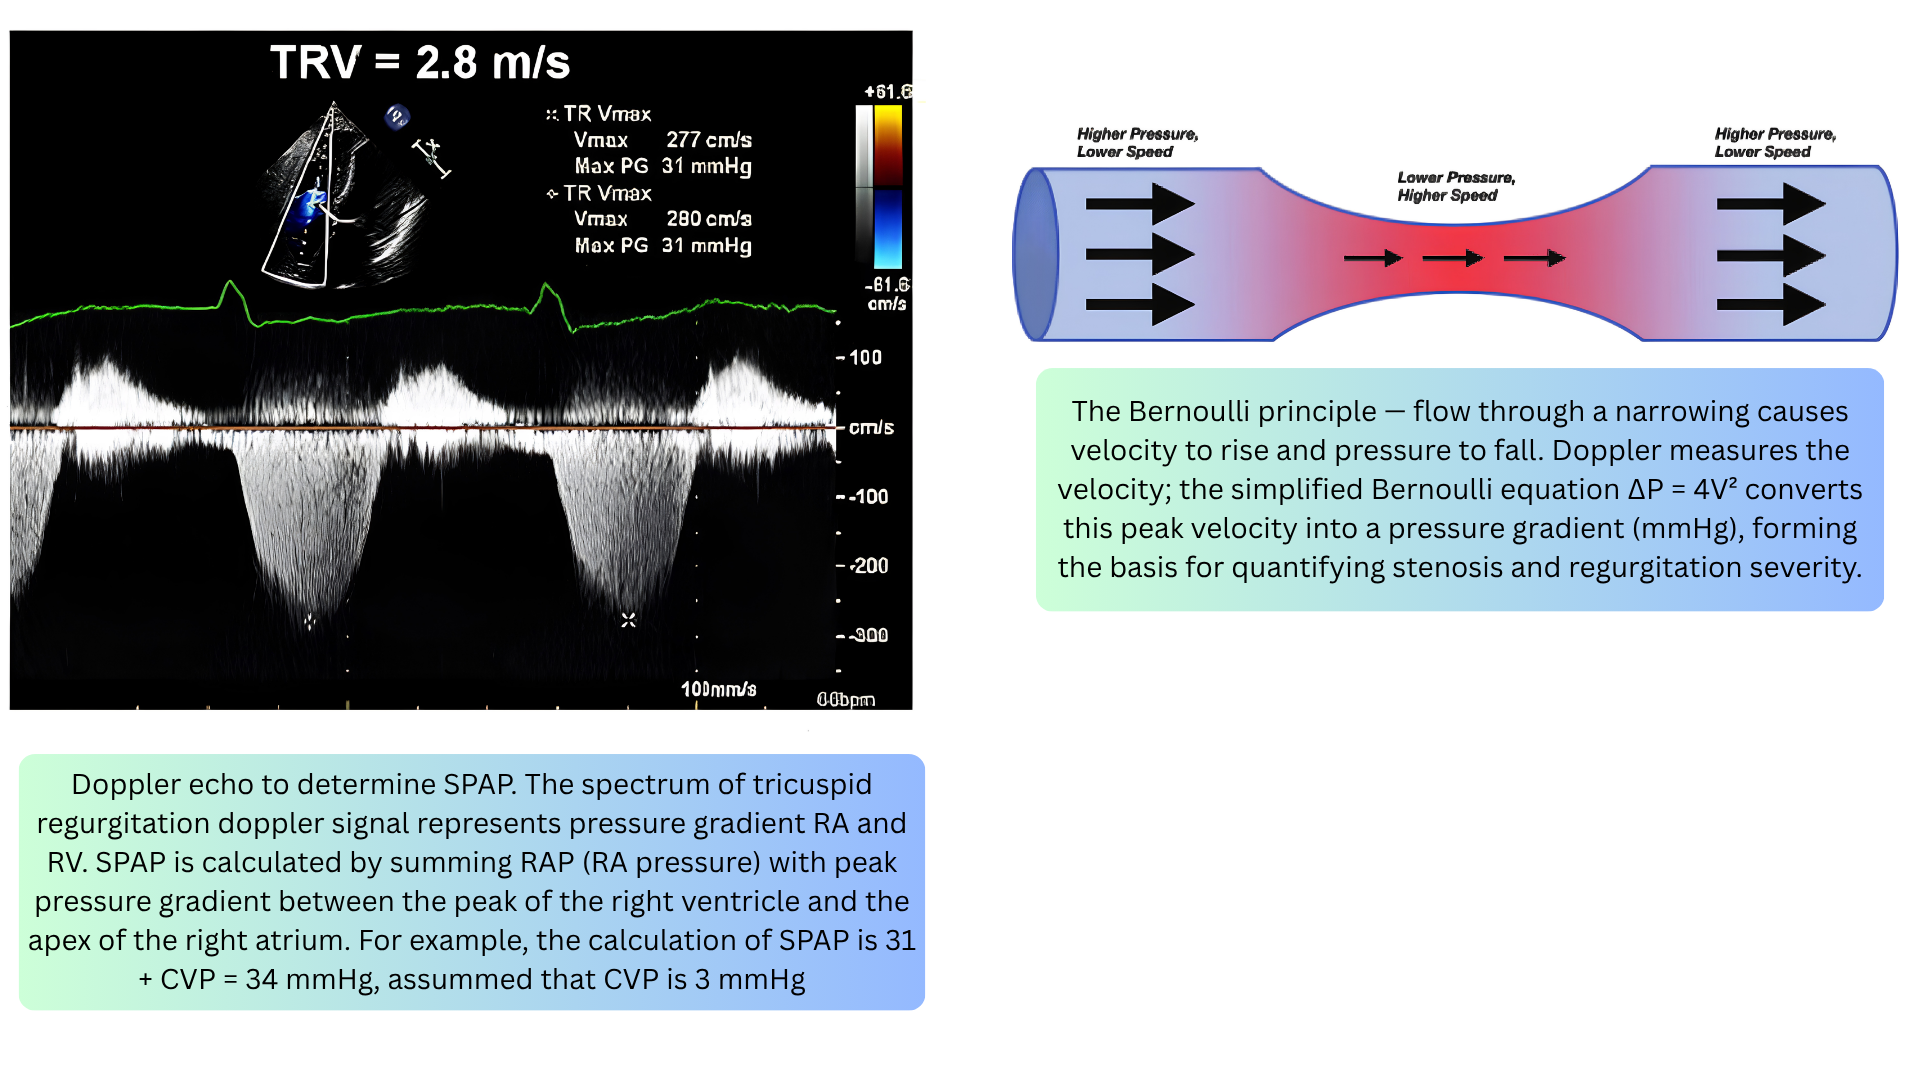
- The Bedside Equation: Proximal velocity (V₁) is usually low compared to the jet velocity (V₂) and can be ignored (acceptable when V₁ < 1 m/s). This gives the equation used at the bedside: ΔP = 4V²
- Where:
- ΔP = pressure gradient (mmHg)
- V = peak velocity of the jet (m/s)
- 4 = a constant derived from blood density and unit conversion
- For estimating PASP: measure peak TRJV by CWD (e.g., 3.0 m/s), calculate gradient (ΔP = 4 × (3.0)² = 36 mmHg), estimate RAP from IVC size/collapsibility (e.g., 10 mmHg), then SPAP = 36 + 10 = 46 mmHg.
- Where:
- 🚨Clinical Use
- Aortic stenosis — peak velocity → gradient
- Tricuspid regurgitation — TRJV → PASP
- Any stenosis or regurgitation — velocity → pressure drop
- The greater the velocity, the greater the pressure gradient.
- Importantly, it should be kept in mind that Doppler echocardiography enables the measurement of velocity, from which pressures and flows are inferred; the absolute pressures in cardiac chambers can only be measured invasively.
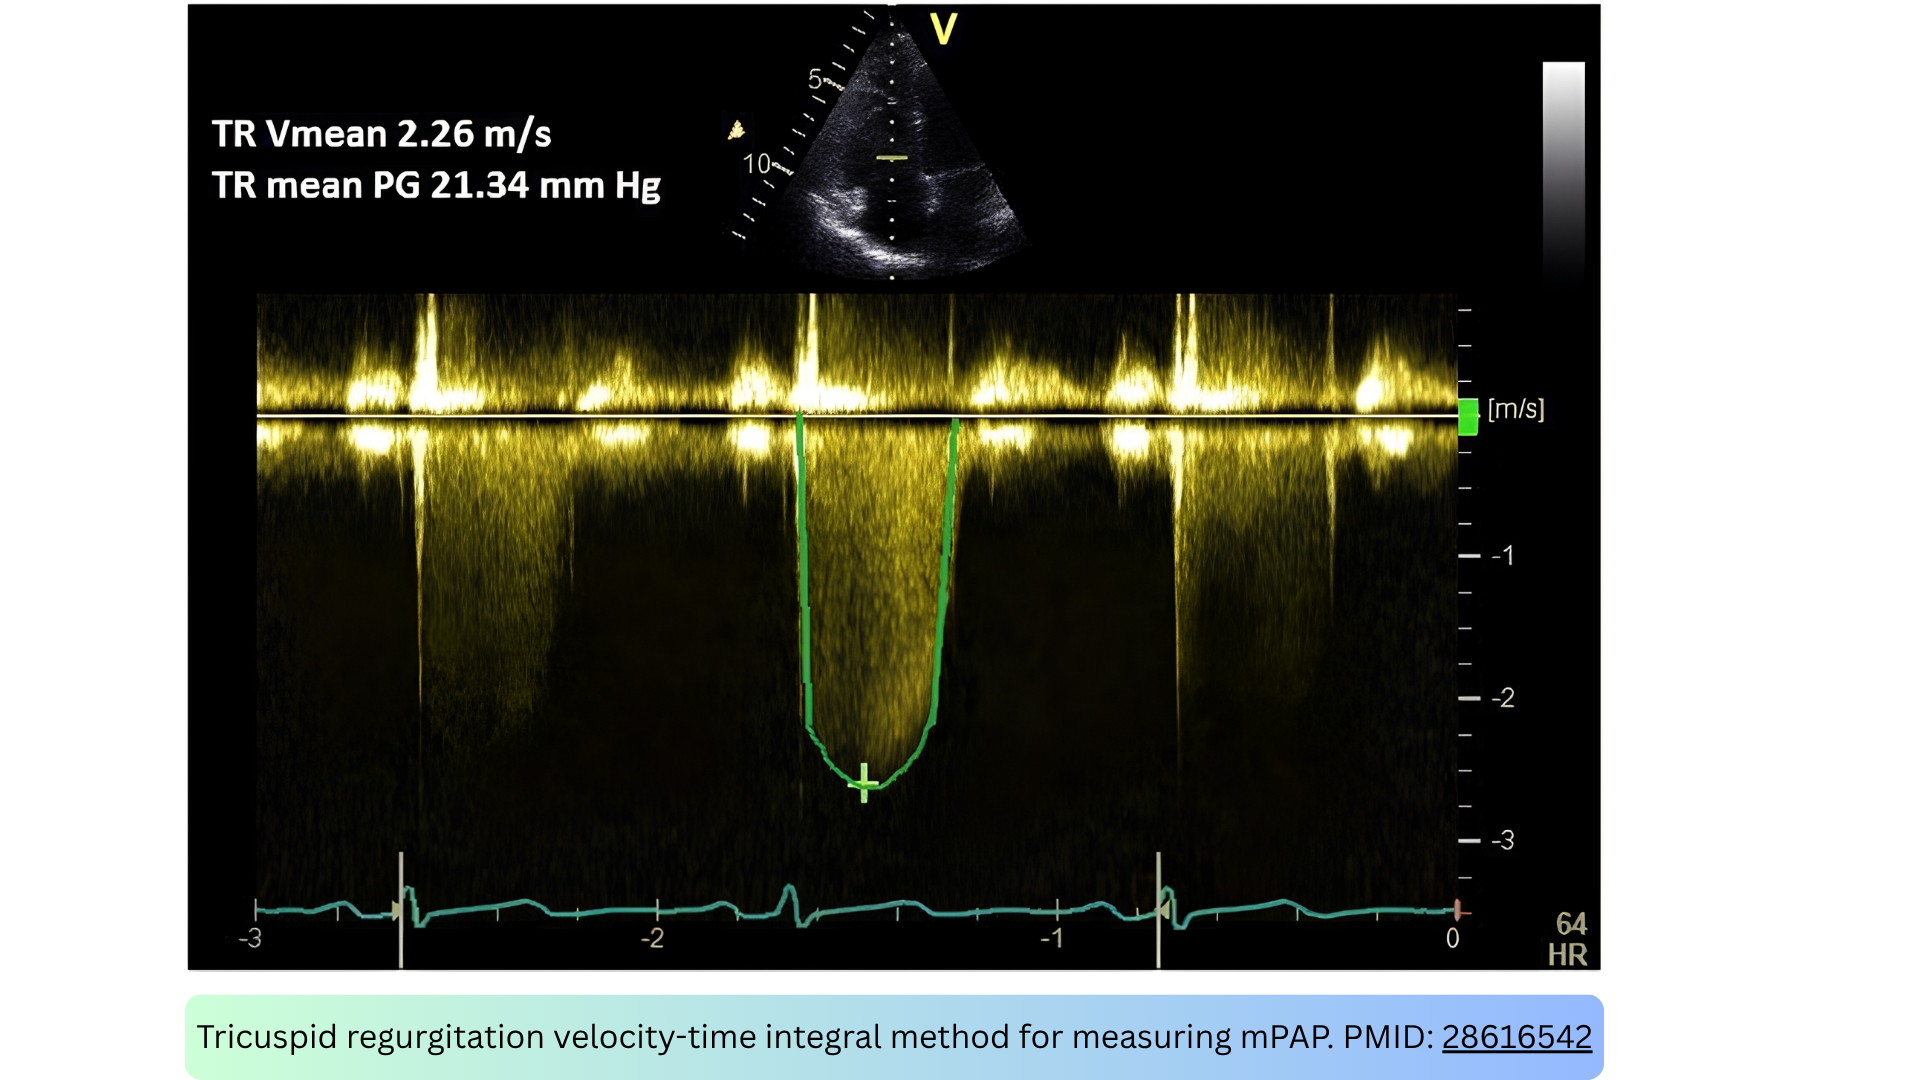
🚨Mean pulmonary artery pressure (mPAP) by TRJV VTI *
- CWD traces the TR jet, and the mean pressure gradient (mean ΔP) is derived from the velocity-time integral (VTI). Right atrial pressure (RAP) is then added:
- mPAP = mean ΔP + RAP
- This method correlates closely with catheter-measured mPAP *.
Continuity of flow equation
- The Concept
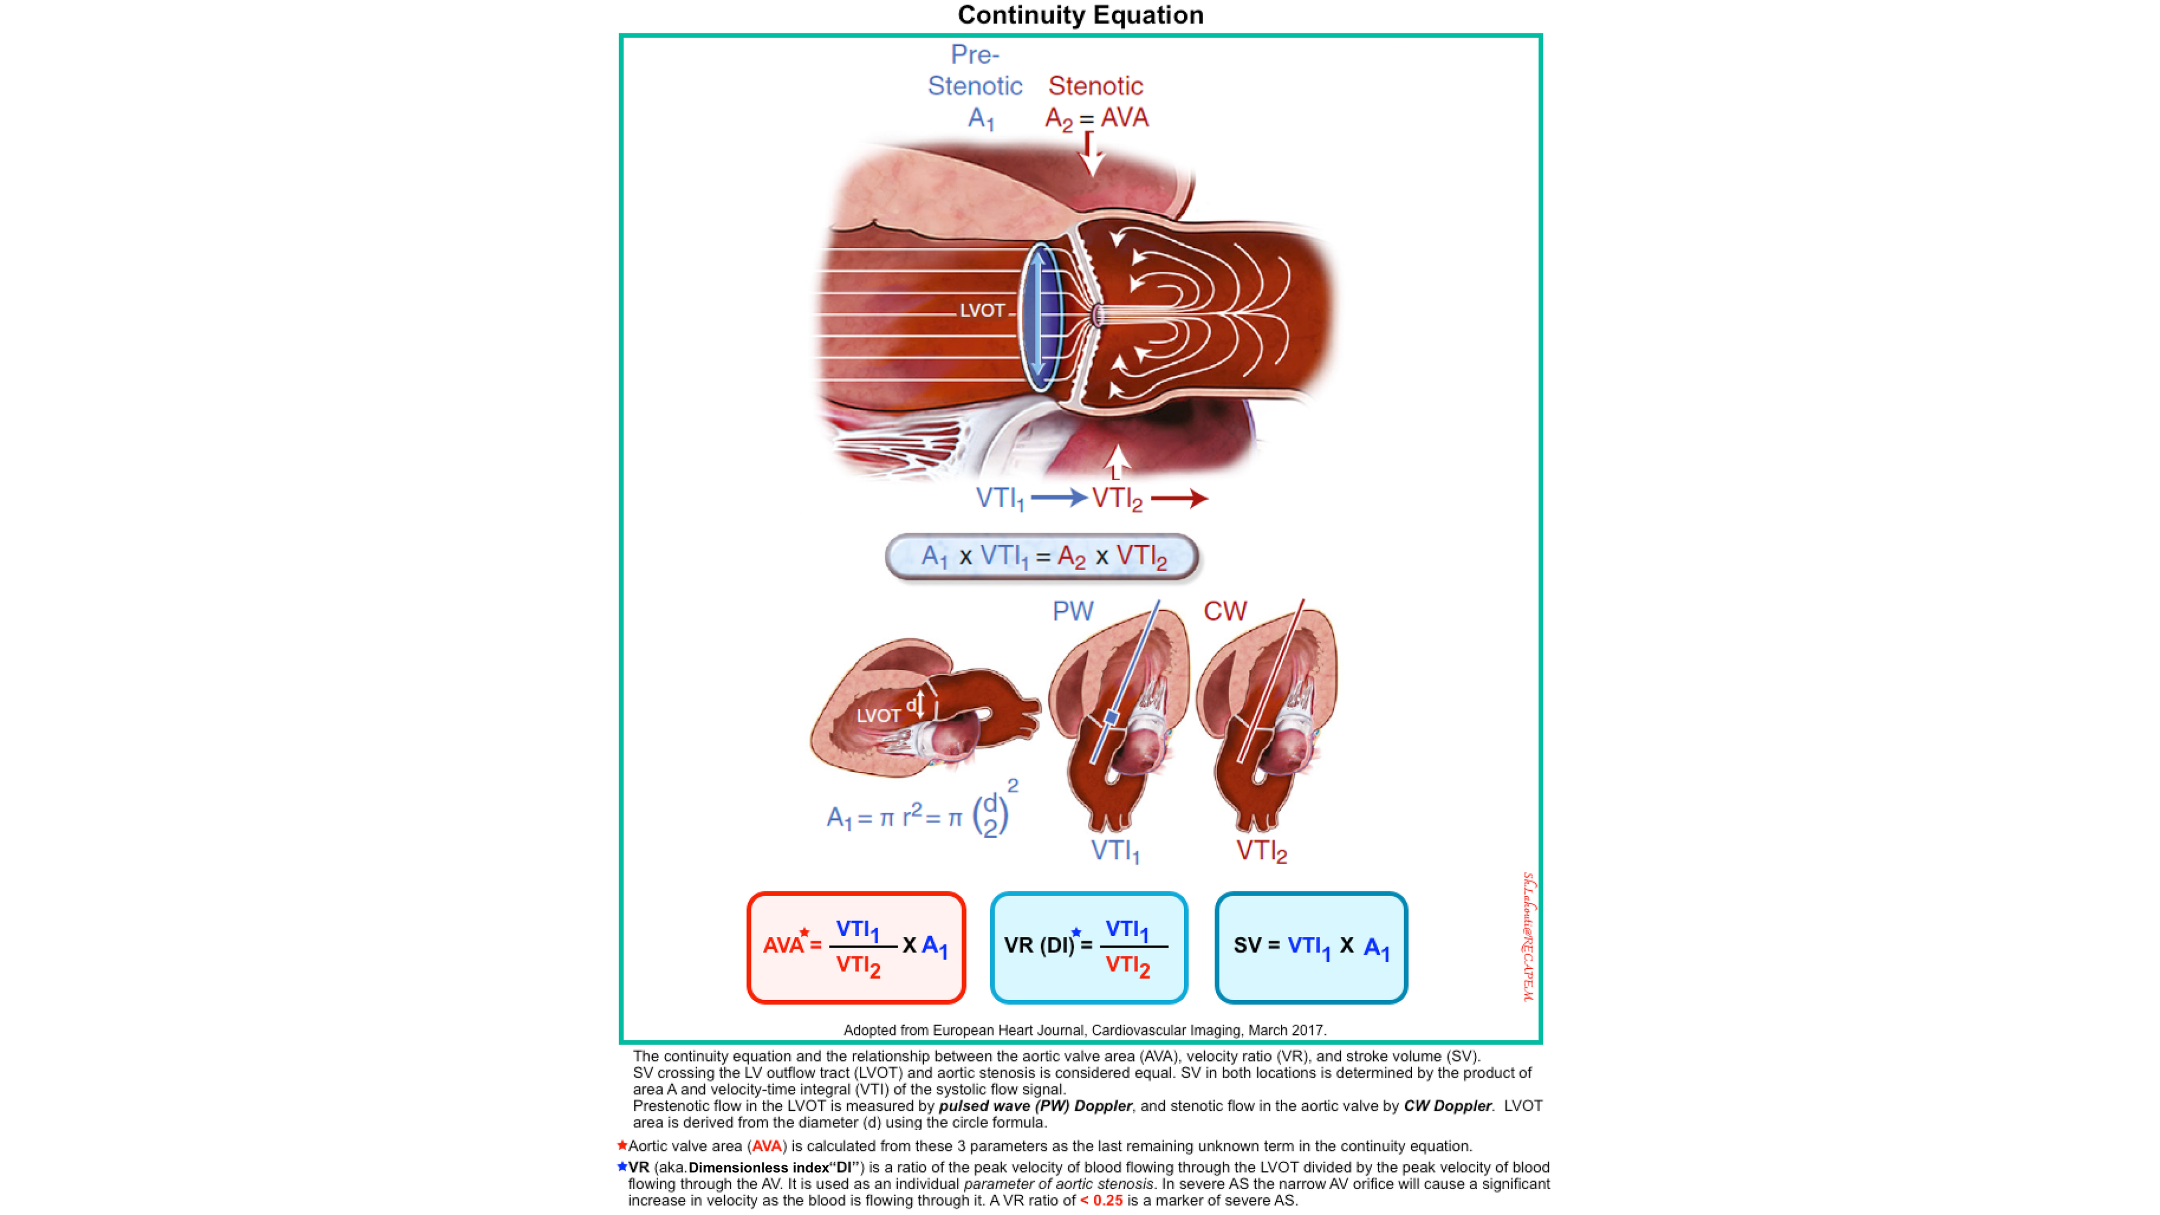
- The continuity of flow equation states that the same volume of blood flows through every cross-section of a tube (the heart), assuming no fluid is lost (i.e., no shunt).
- In simple terms: what goes in must come out. If a tube narrows, the blood must speed up to get through — but the total flow (volume per beat) stays the same.
- How Is Flow Calculated? Flow is calculated by multiplying two things:
- CSA: Cross-sectional area of the orifice (cm²)
- VTI: Velocity-time-integral (cm)
- Flow = CSA × VTI
- Where VTI is the area under the Doppler spectral envelope (velocity × time = distance).
- Why It Matters Clinically
- Sometimes the cross-sectional area of a diseased valve (like a stenotic aortic valve) is difficult to measure directly. So instead, we use the continuity equation:
- Flow through the LVOT = Flow through the aortic valve
- Which gives us:
- LVOT VTI × LVOT-Area = AV VTI × AV-Area
- Rearranged to solve for the aortic valve area: AV-Area = (LVOT VTI × LVOT-Area) / AV VTI
- Clinical Use
- Aortic stenosis — calculate valve area when direct planimetry is not possible
- Stroke volume — SV = CSA × VTI
- Cardiac output — CO = SV × HR
- Shunt quantification — Qp/Qs ratio
- The bottom line: Flow is conserved; if you know the area and velocity at one point, you can calculate the area at another point.
Tissue Doppler Imaging (TDI)
Main Features
TDI measures the velocity of myocardial tissue motion, not blood flow. It is a specialized form of PWD that detects the low-velocity, high-amplitude signals of moving myocardium rather than the high-velocity, low-amplitude signals of blood.
◾️Range resolution
- TDI has excellent range resolution, like PWD. You place the sample volume on a specific myocardial segment (e.g., the lateral mitral annulus, septal annulus, or RV free wall).
◾️Max velocity / Aliasing
- TDI measures low velocities (typically < 20 cm/s), so aliasing is rarely an issue. The velocities are an order of magnitude lower than blood flow velocities.
◾️Display
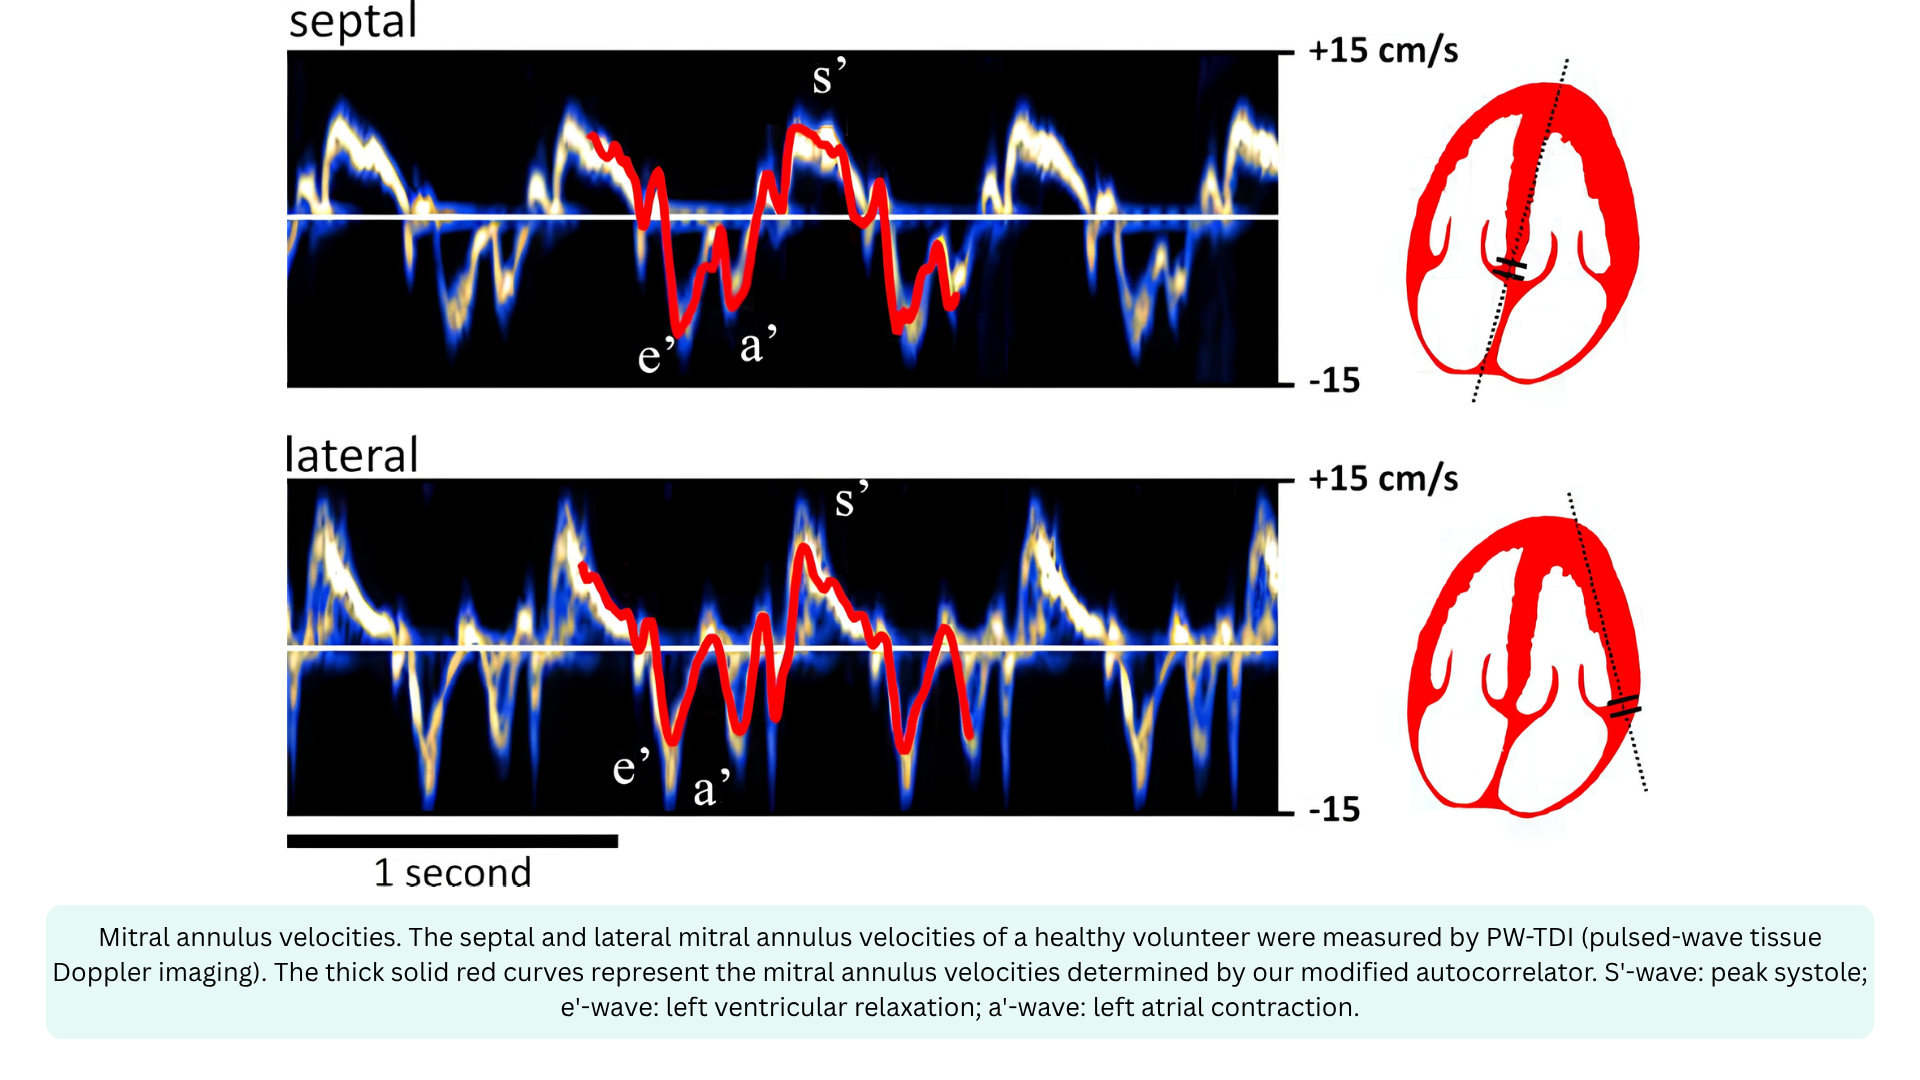
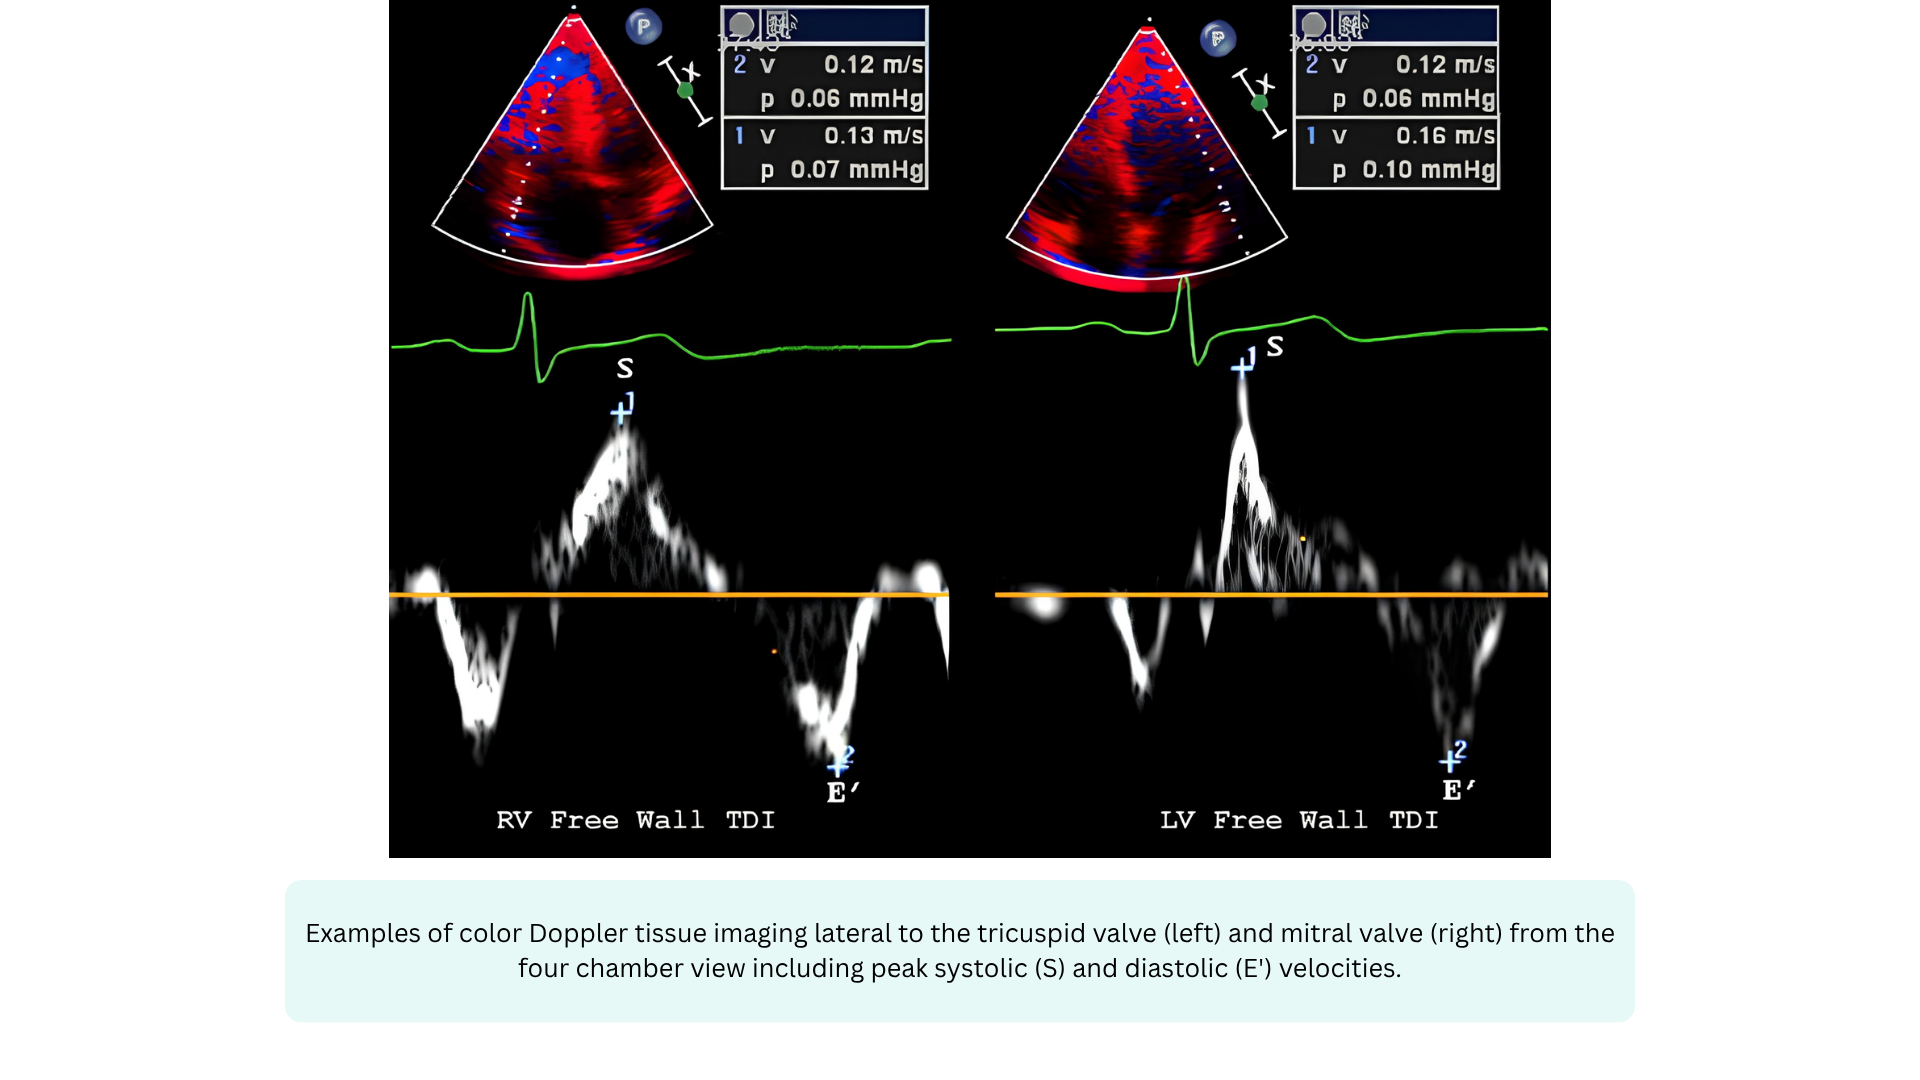
- TDI produces a spectral waveform with a narrow, dark envelope. The velocities are displayed in cm/s (not m/s). The waveform typically shows three waves:
- s’ — systolic myocardial contraction (positive wave)
- e’ — early diastolic myocardial relaxation (negative wave)
- a’ — late diastolic myocardial contraction from atrial kick (negative wave)
◾️How it works
- TDI uses a lower-frequency, higher-amplitude filter to detect the motion of the myocardium itself. Because the myocardium moves slowly but with high amplitude, the gain and filter settings are adjusted to reject the high-velocity, low-amplitude blood flow signals and capture the low-velocity, high-amplitude tissue signals. This is why TDI is sometimes called “the Doppler of the heart muscle.”
◾️Spectral broadening in TDI
- TDI envelopes are typically narrow and dark, because myocardial motion is relatively uniform within a segment. Spectral broadening is minimal unless there is regional wall motion abnormality or significant dyssynchrony.
◾️When to use TDI
- TDI is essential for assessing myocardial function, both systolic and diastolic. Key applications include:
- Assessing diastolic function (myocardial e’, a’)
- e’ velocity is a load-independent index of myocardial relaxation; the E/e’ ratio estimates LV filling pressures (LVEDP)
- Systolic function assessment
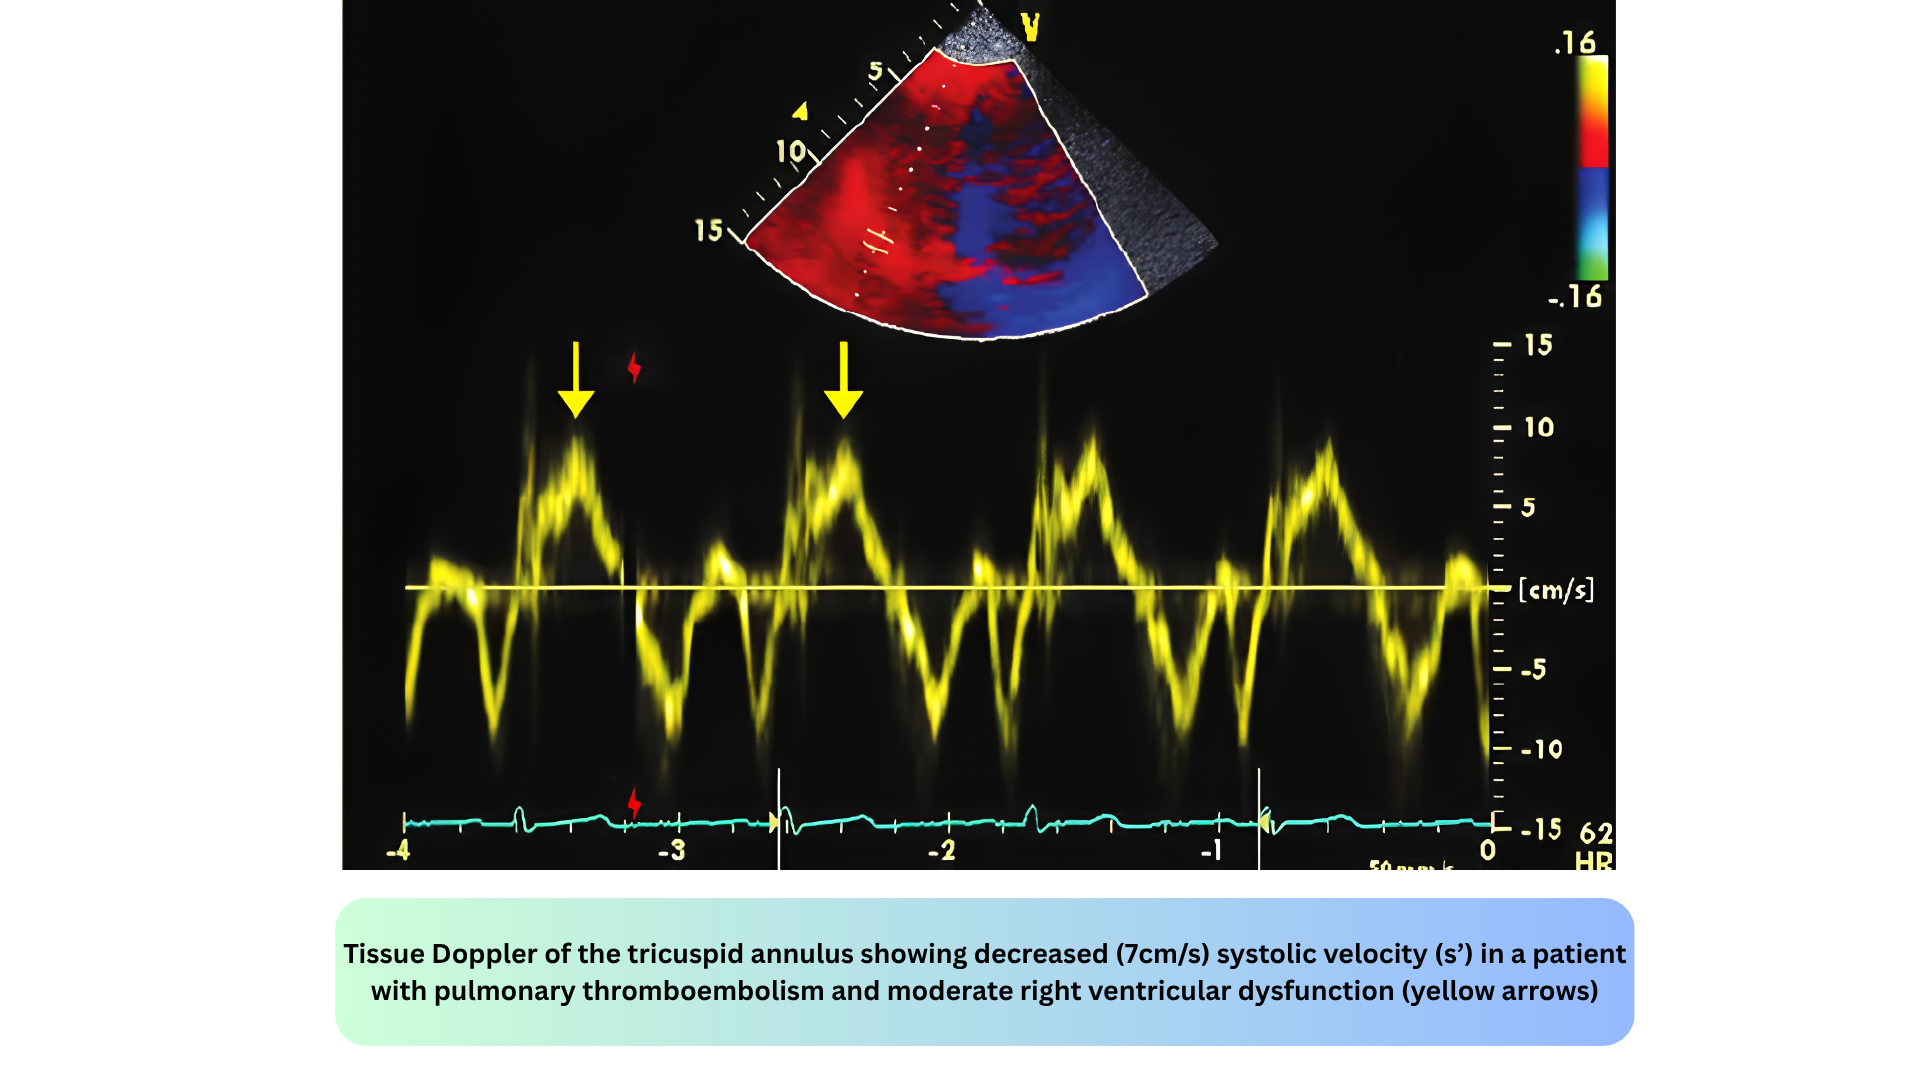
- s’ velocity is a marker of longitudinal systolic function; s’ < 6 cm/s suggests impaired systolic function
- RV function assessment
- RV s’ velocity assesses RV systolic function (normal range > 9.5 cm/s)
- Dyssynchrony assessment
- TDI can detect mechanical dyssynchrony in heart failure patients
- Constrictive pericarditis vs. restrictive cardiomyopathy
- TDI helps differentiate these conditions
- Assessing diastolic function (myocardial e’, a’)
◾️Key values:
- Lateral mitral annular e’
- Normal > 10 cm/s; abnormal < 10 cm/s
- Septal mitral annular e’
- Normal > 7 cm/s; abnormal < 7 cm/s
- E/e’ ratio
- Normal < 8; elevated > 14 suggests elevated LVEDP
- S’ (peak systolic velocity) at the lateral mitral annulus
- Normal > 6 cm/s
- S’ (peak systolic velocity) at the lateral tricuspid valve annulus
- Normal > 10 cm/s.
◾️The E/e’ ratio is particularly important in emergency and critical care. It provides a noninvasive estimate of LV filling pressure, which is essential for distinguishing cardiogenic from non-cardiogenic pulmonary edema.
- In the I‑RUSH exam, TDI is used to assess Interface Ia (LV Preload → LVEDP) and to identify patients with diastolic dysfunction who are at risk of fluid intolerance.
Power Doppler
Main Features
Power Doppler is a technique that uses the amplitude of the Doppler signal to detect moving matter. Power Doppler:
- Is independent of velocity and direction of flow, so there is no possibility of signal aliasing
- Is independent of angle, allowing detection of smaller velocities than color Doppler, facilitating examinations in certain technically challenging clinical settings
- Has a higher sensitivity than color Doppler, which makes a trade-off with flash artifacts
◾️Range resolution. Power Doppler has range resolution within the color box, meaning it can show you where flow is present.
◾️Max velocity / Aliasing: Power Doppler does not measure velocity, so aliasing is not applicable.
◾️Display
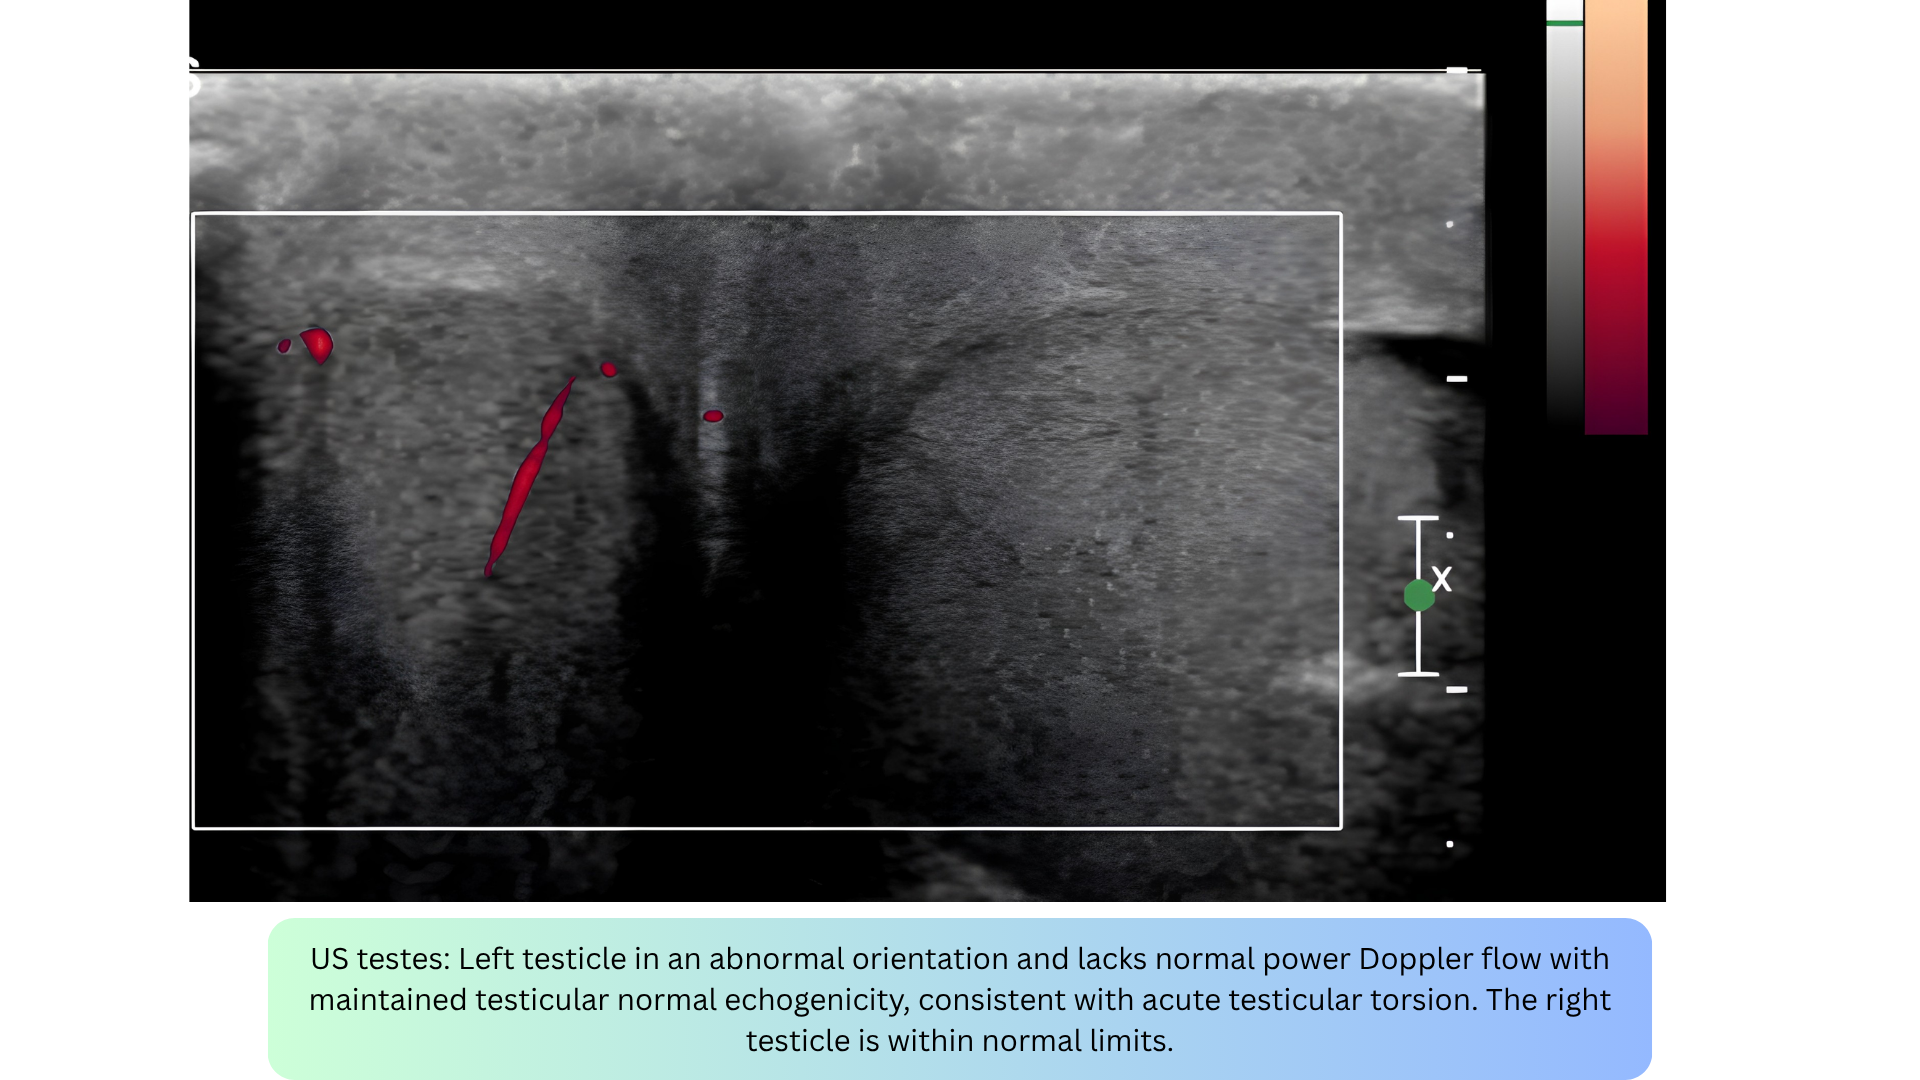
- Power Doppler produces a color intensity map (usually a single color) showing the presence and strength of flow. It does not produce a spectral envelope, so spectral broadening does not apply.
◾️Direction info
- Power Doppler provides no directional information. You cannot tell if flow is toward or away from the transducer.
◾️Velocity info
- Power Doppler provides no velocity information. You cannot tell how fast flow is moving.
◾️How it works
- Power Doppler integrates the total power of the Doppler signal rather than the frequency shift. This makes it more sensitive to slow flow and less angle-dependent, but it provides no velocity or directional information.
◾️When to use Power Doppler
- Power Doppler is for detecting slow/low flow where velocity and direction are not needed — just “is there flow here?”
- It is particularly useful when examining superficial structures, like thyroid, testis, renal grafts, and subcutaneous lesions. It may be used to look for tumor vessels, to evaluate tiny low-flow vessels and detect subtle ischemic areas.
- Key applications include:
- Myocardial perfusion — detecting slow capillary flow
- Subtle valvular regurgitation — low-velocity jets
- Placental flow — obstetrics
- Renal perfusion — nephrology
- Tumor vascularity — oncology
- Inflammatory hyperemia — musculoskeletal
Key limitation: Power Doppler cannot tell you how fast flow is moving or in which direction, only that flow is present.
Artifacts in Doppler Ultrasound
◾️Noncoaxial Intercept Angle Artifact
- What it is: Underestimation of true velocity when the ultrasound beam is not parallel to blood flow.
- Appearance: No specific visual pattern other than a lower-than-expected velocity compared to recordings from other windows.
- Mechanism: Based on the Doppler equation, V = (ΔF × C) / (2F₀ × cosθ). When θ = 0°, cosθ = 1 and maximum velocity is recorded. As θ increases from 0° to 90°, cosθ decreases from 1 to 0, progressively underestimating velocity. At θ = 90°, no velocity is detected.
- Magnitude of error:
- θ < 20° → error < 6%
- θ = 60° → error ~50%
- θ = 90° → no signal
- 🚨Clinical relevance
- This is one of the most important potential errors in velocity measurement. Aortic stenosis recordings should be obtained from multiple windows (apical, right parasternal, suprasternal) to ensure the highest velocity is captured.
- How to fix it?
- Adjust the transducer to minimize the intercept angle; use alternative imaging windows; use a nonimaging (pencil) probe from multiple windows; focus on the densest portion of the signal (modal velocity).

◾️Aliasing
- Occurs when the Doppler frequency shift exceeds the Nyquist limit (half the pulse repetition frequency) *.
- Seen in: PWD and Color Doppler (not CWD or Power Doppler).
- In color Doppler, aliasing appears as a mosaic of colors (red, blue, green, yellow), often mistaken for high-velocity turbulent flow.
- In PWD, the spectral waveform “wraps around” to the opposite side of the baseline, peaks that should be above appear below, and vice versa.
- How to fix: Increase the PRF/scale, shift the baseline, or switch to CWD (which never aliases).
- Clinical pearl: Aliasing is not always bad; it can flag a high-velocity jet that needs CWD interrogation.
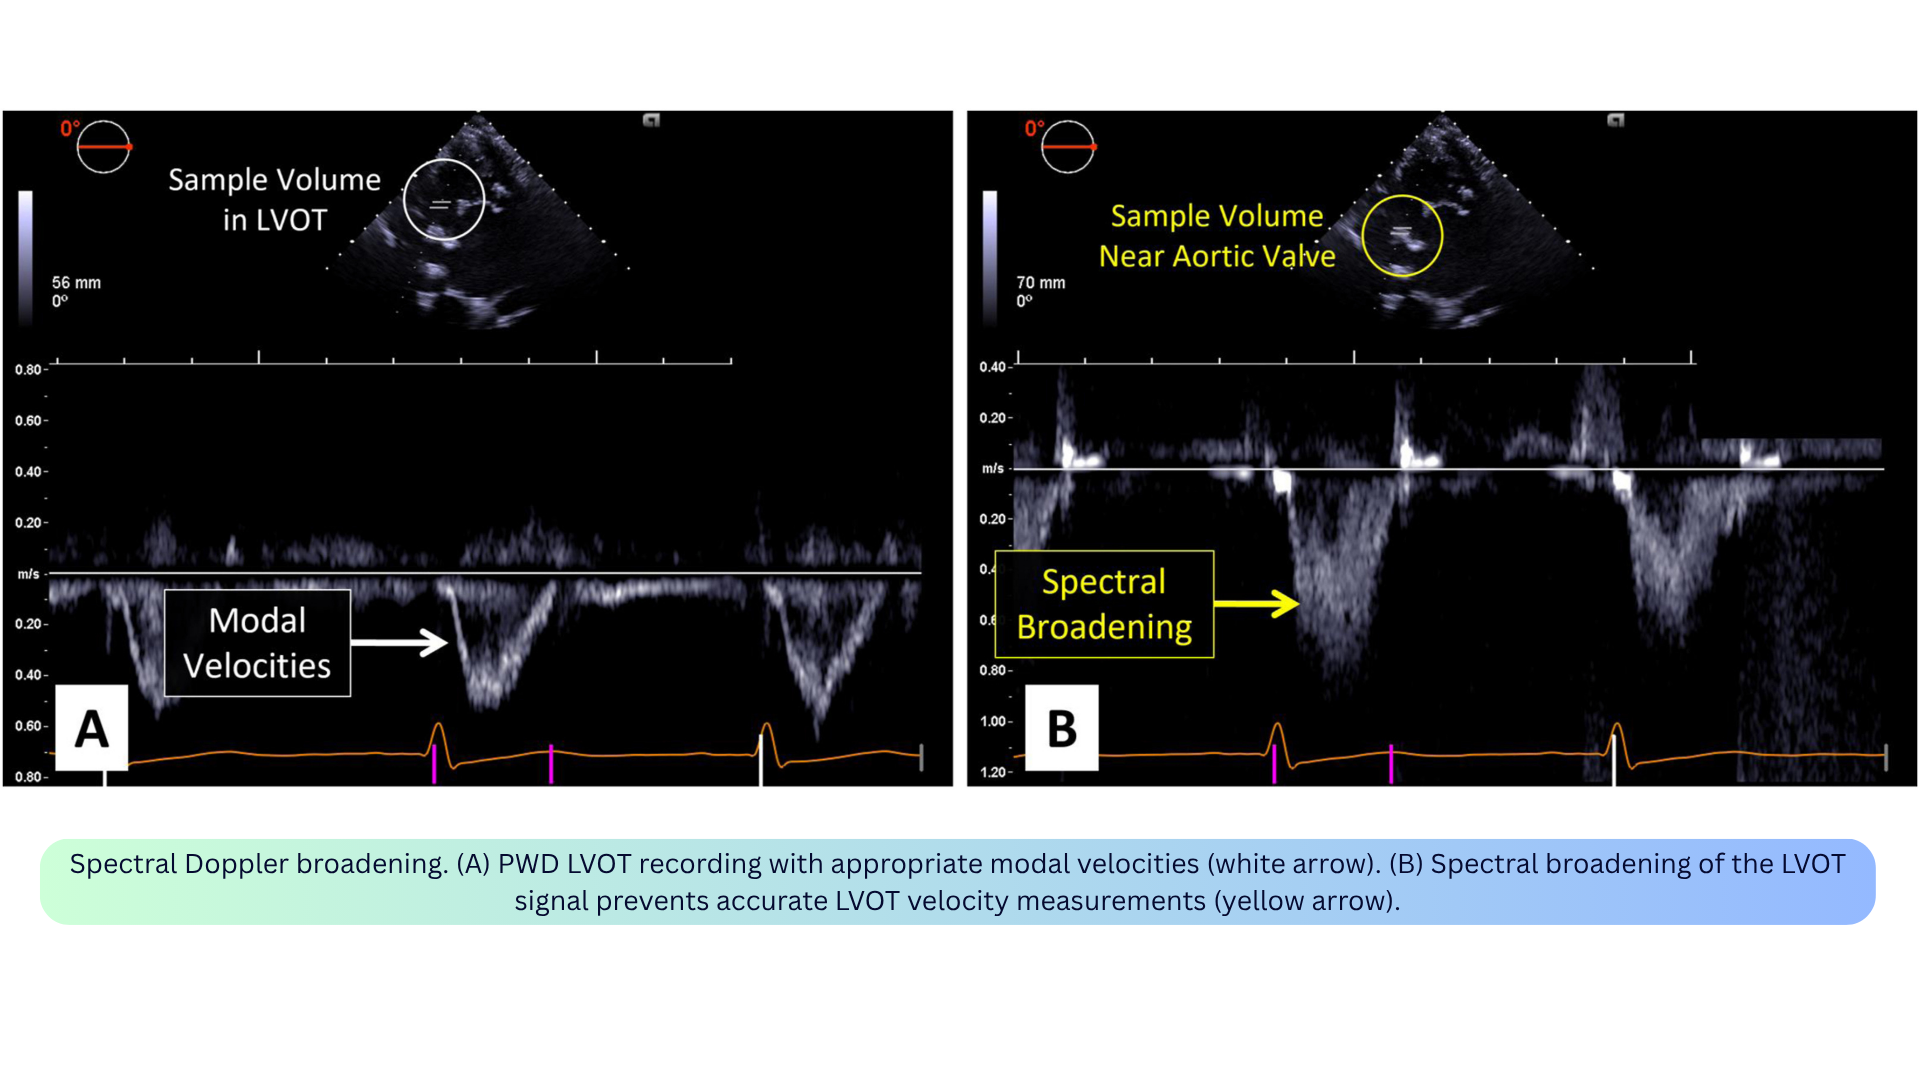
◾️Spectral Broadening / Transit Time Effect
- What it is: “Filling in” of the spectral window due to a range of velocities being recorded simultaneously within the sample volume.
- Appearance: A broad, filled-in envelope. The fine linear signals at the peak are called the “beard,” while the true flow velocity outline is the “chin.”
- Mechanism: Not all red blood cells move at the same speed or direction within the sample volume. The transit time effect, as targets move through the beam, they return slightly different Doppler frequencies blurs the spectral curve. Turbulent flow amplifies this because a wider range of velocities is sampled at once.
- Clinical relevance:
- The fine linear “beard” signals are transit-time artifacts and should not be included in velocity measurements.
- Focus on the densest portion (modal velocity) for accurate measurement.
- Particularly problematic in aortic stenosis assessment and LVOT VTI measurement.
- How to fix: Focus on the modal velocity (densest part of the envelope); adjust the intercept angle; use optimal gain settings.
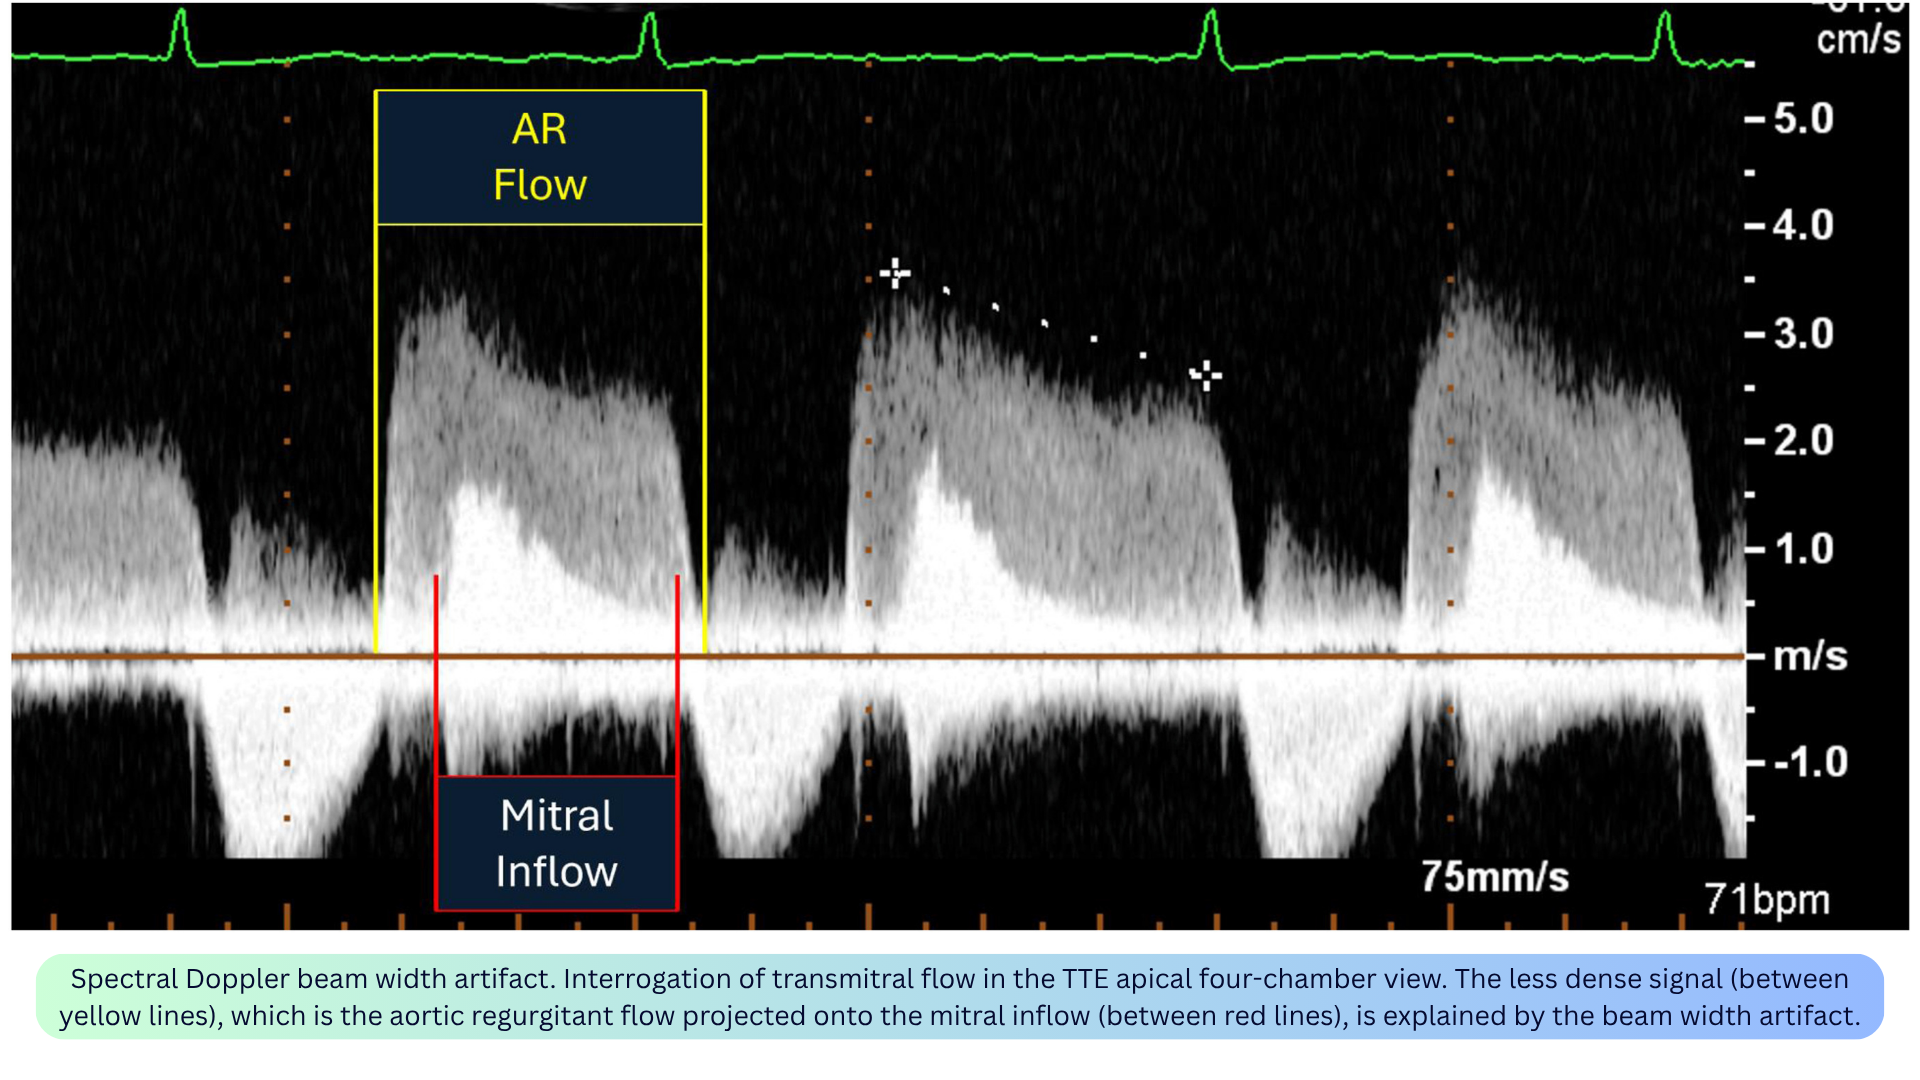
◾️Spectral Doppler Beam Width Artifact
- What it is: Superimposition of adjacent flow signals into a single Doppler waveform because the ultrasound beam has a 3D volume but is displayed in a single tomographic plane.
- Appearance: Two distinct flow signals appear superimposed on one spectral tracing (e.g., AR jet overlapping mitral inflow; MR jet contaminating TR jet).
- Mechanism: Blood flow outside the imaging plane but within the 3D volume of the beam is interpreted as if located in the same imaging plane and displayed as superimposed signals.
- Clinical relevance:
- May lead to superimposition of distinct flow jets, complicating accurate velocity and gradient assessment.
- Examples: AR jet overlapping LV inflow; MR jet contaminating TR jet (especially medially directed MR); MR jet contaminating LVOT obstruction waveforms in HOCM.
- Useful application: This mechanism allows simultaneous recording of LV inflow and outflow, enabling measurement of isovolumic relaxation time.
- How to fix: Limit the sample volume size; avoid far-field interrogation; interrogate from different imaging windows.
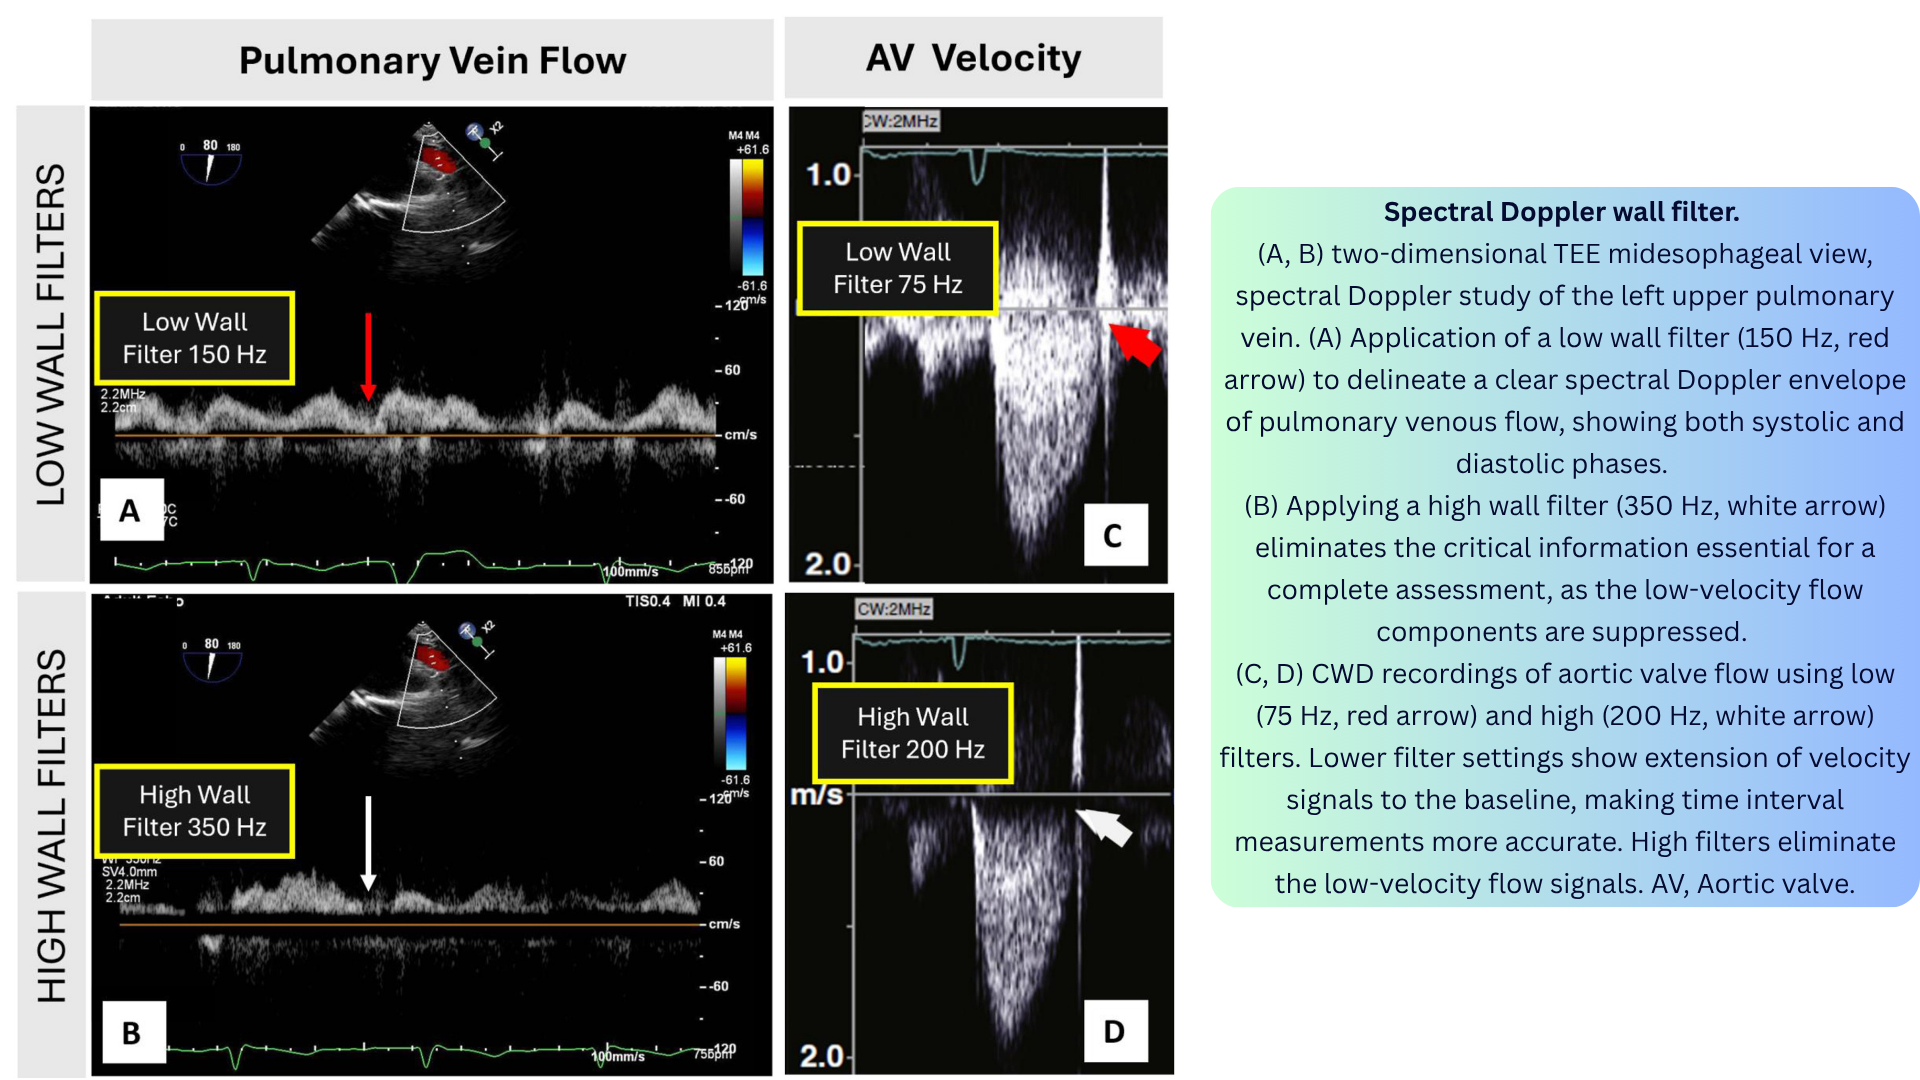
◾️Spectral Wall Filter Artifact
- What it is: A high-pass wall filter eliminates low-velocity flow signals near the zero baseline, potentially removing clinically important information.
- Appearance: With a high filter, low-velocity signals near the baseline disappear. With a low filter, they are preserved, but wall motion signals may clutter the display.
- Mechanism: Wall filters are used to eliminate low-velocity, high-amplitude signals from cardiac chamber walls when measuring blood flow. However, when set too high, they also eliminate low-velocity blood flow signals.
- Clinical relevance:
- Important when assessing low-flow states (e.g., pulmonary vein flow, low-velocity regurgitant jets).
- Affects accuracy of time-interval measurements.
- In tissue Doppler imaging, the filter settings are reversed: high-velocity filters suppress blood velocities to enhance tissue signals.
- How to fix: Adjust the wall filter to display the start and end of the flow signal of interest. Use low filter settings (e.g., 75–150 Hz) for pulmonary vein flow; higher settings for high-velocity jets.
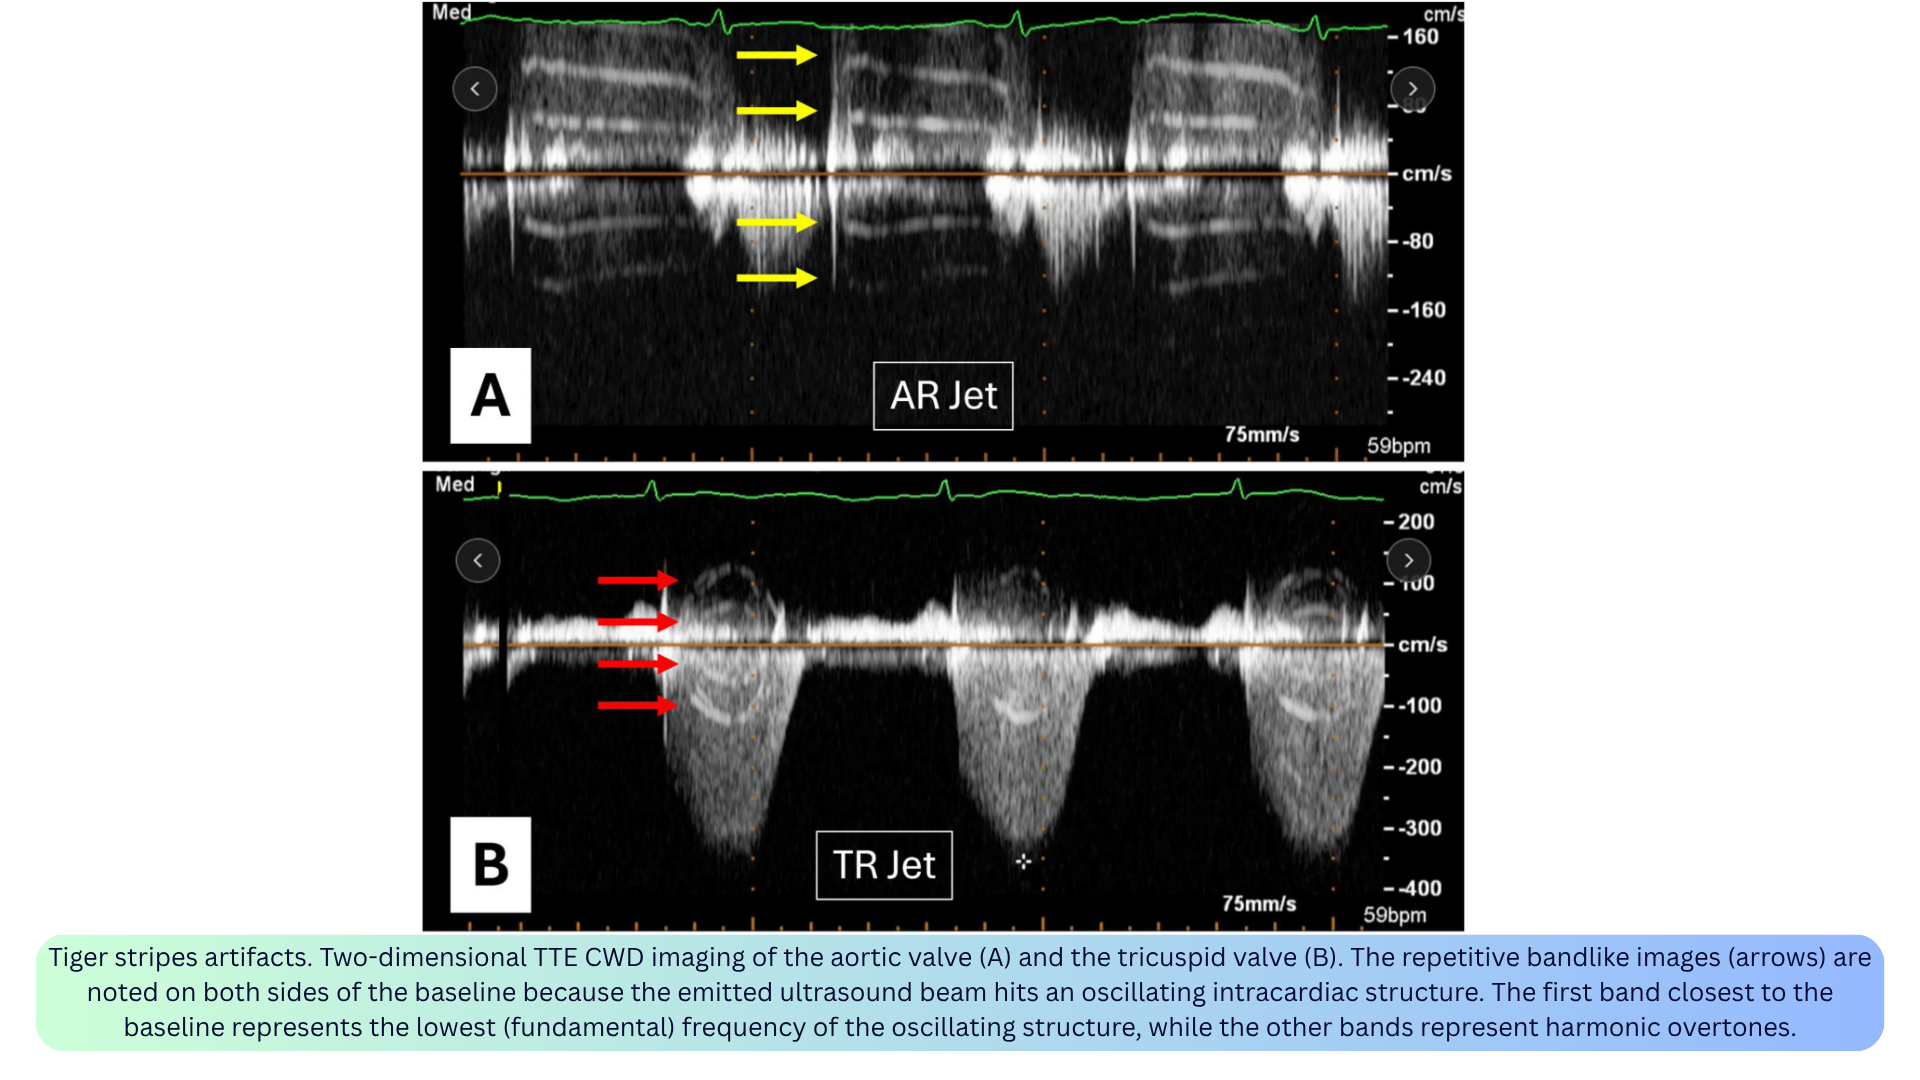
◾️Tiger Stripes Artifact
- What it is: Alternating bright and dark parallel lines on both sides of the Doppler waveform, resembling a tiger’s stripes.
- Appearance: Ladder-like bands nearly parallel to the baseline, appearing on both sides of the spectral tracing.
- Mechanism: Occurs when the emitted ultrasound beam encounters an oscillating intracardiac structure. The first band closest to the baseline represents the lowest (fundamental) frequency of the oscillating structure, while subsequent bands represent harmonic overtones.
- Clinical relevance:
- Reported with native valve regurgitation, flail prosthetic valve leaflets, ruptured papillary muscle, Lamb’s excrescences, and pacemaker leads.
- Can be a diagnostic clue — prompts a search for the oscillating structure.
- How to fix: Recognize the artifact; look for the underlying oscillating structure.
◾️Spectral Mirroring
- What it is: A symmetric duplication of the true flow signal on the opposite side of the baseline.
- Appearance: The mirrored signal is typically fainter than the true signal and appears on the opposite side of the baseline.
- Mechanism: Two mechanisms: (1) ultrasound system misinterpretation of received signals when a flow is near a highly reflective surface (e.g., pleural or pericardial lining), or (2) interrogation of flow at a near-perpendicular angle.
- Clinical relevance: Can mimic reversed flow — always confirm with the true signal. Can lead to erroneous interpretation of flow direction and velocity.
- How to fix: Reduce gain/power; adjust beam alignment to avoid the strong reflector; ensure optimal alignment of the Doppler beam with blood flow.

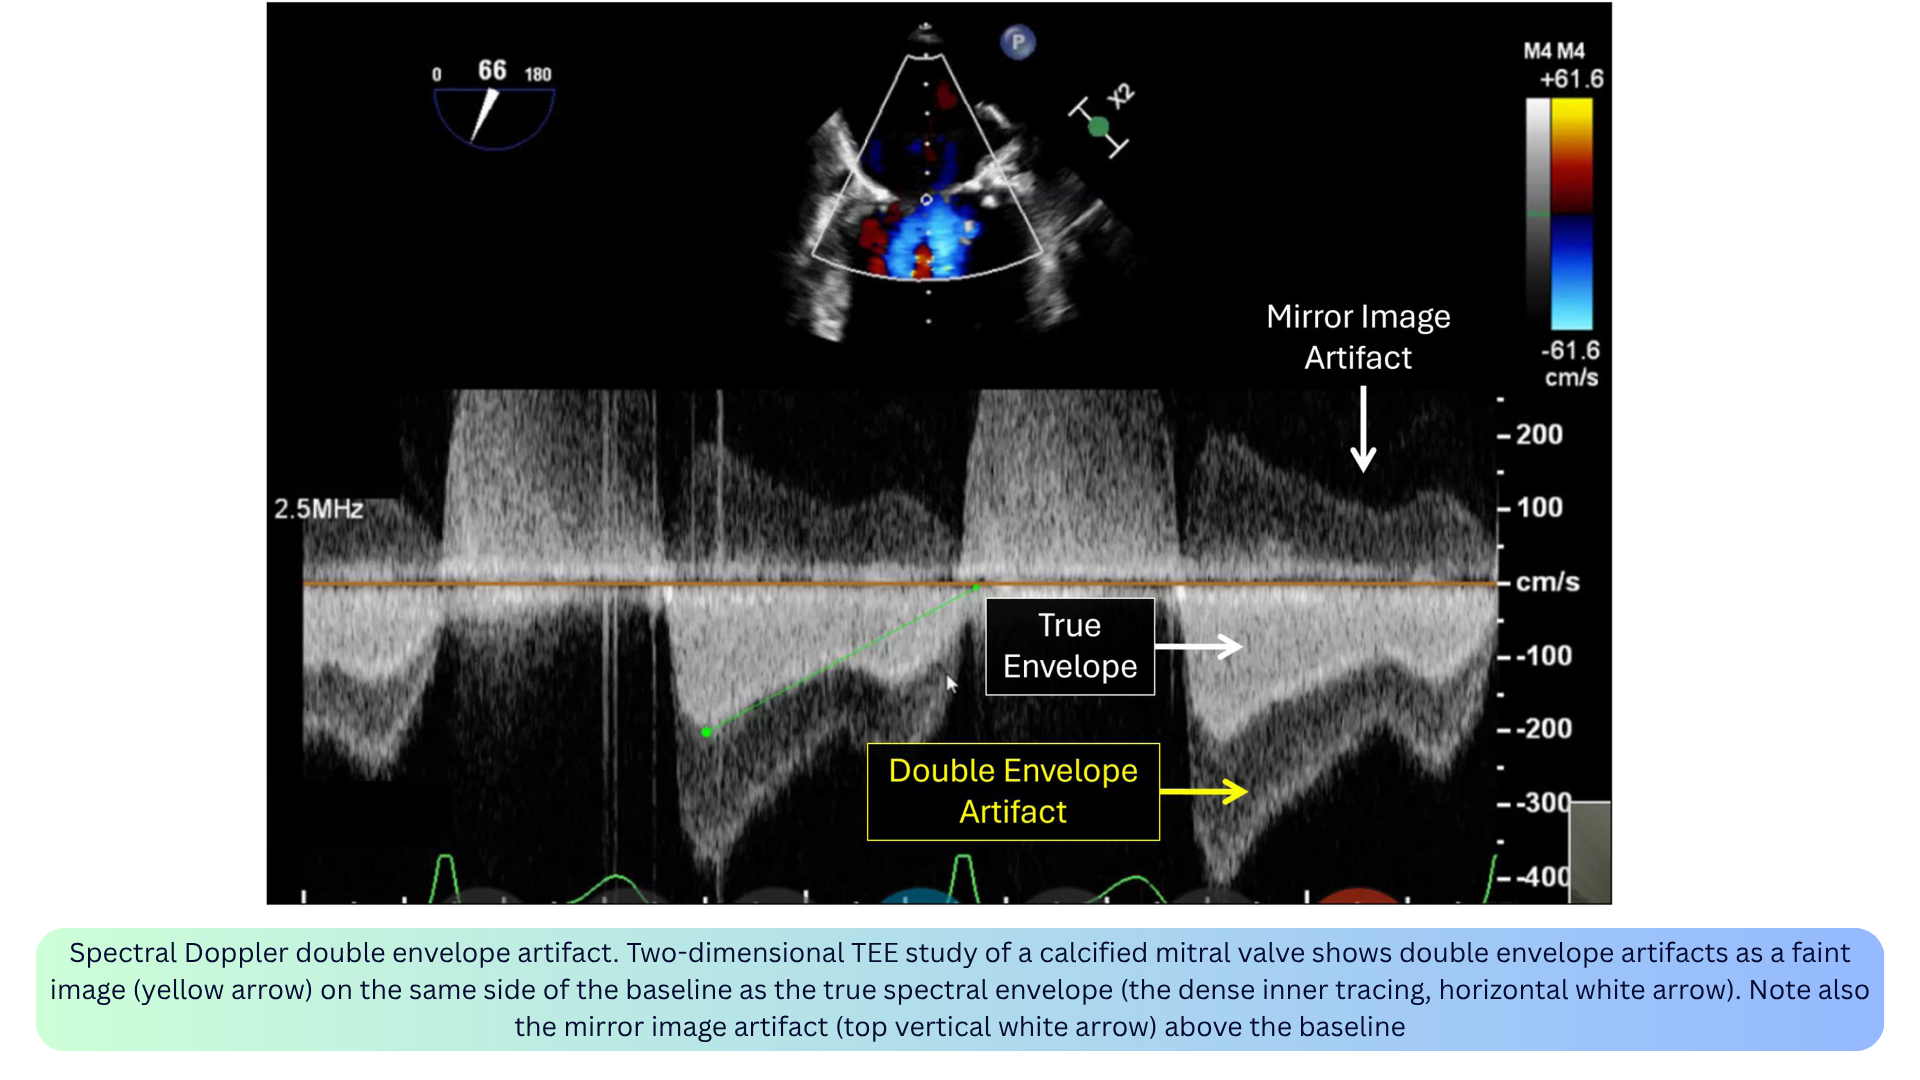
◾️Double Envelope
- What it is: A faint duplicate of the spectral envelope, usually appearing just outside or alongside the true envelope.
- Appearance: A faint duplication of a denser spectral Doppler jet (typically with CWD). The velocity of the outer duplicated envelope is exactly double the modal velocity of the inner denser envelope.
- Mechanism: Conceptually described as both a reverberation/duplication artifact from a strong reflector occurring in high flow states and a higher Doppler gain. Complex fluid mechanics (e.g., wall jet) have also been suggested.
- Clinical relevance:
- May occur during interrogation of a densely calcified mitral valve or mitral valve prosthesis, particularly by TEE.
- May cause gradient overestimation for native or prosthetic mitral valve assessment.
- Can overestimate gradients if mistaken for the true envelope — trace the denser envelope.
-
How to fix: Decrease the gain; adjust the imaging plane to minimize the artifact.
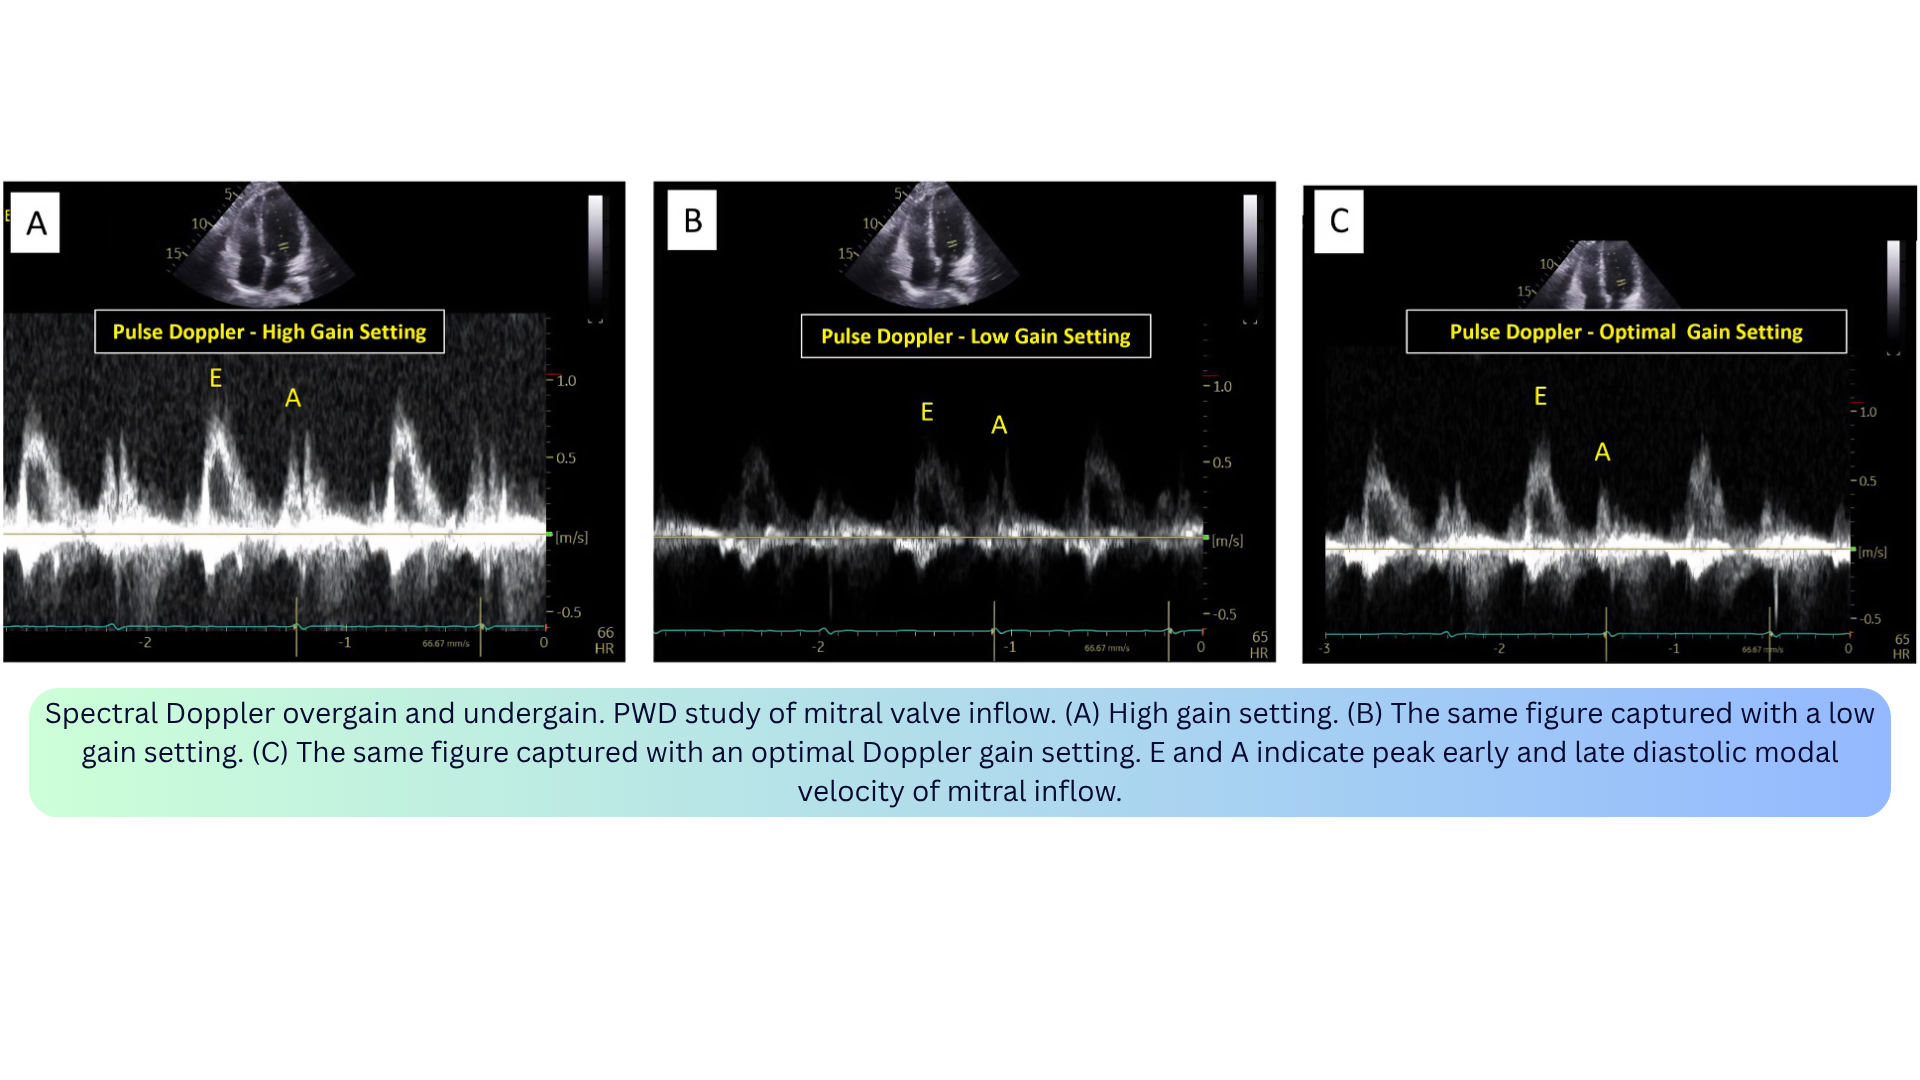
◾️Overgain / Undergain
- What it is: Improper amplification of the returning Doppler signal.
- Appearance:
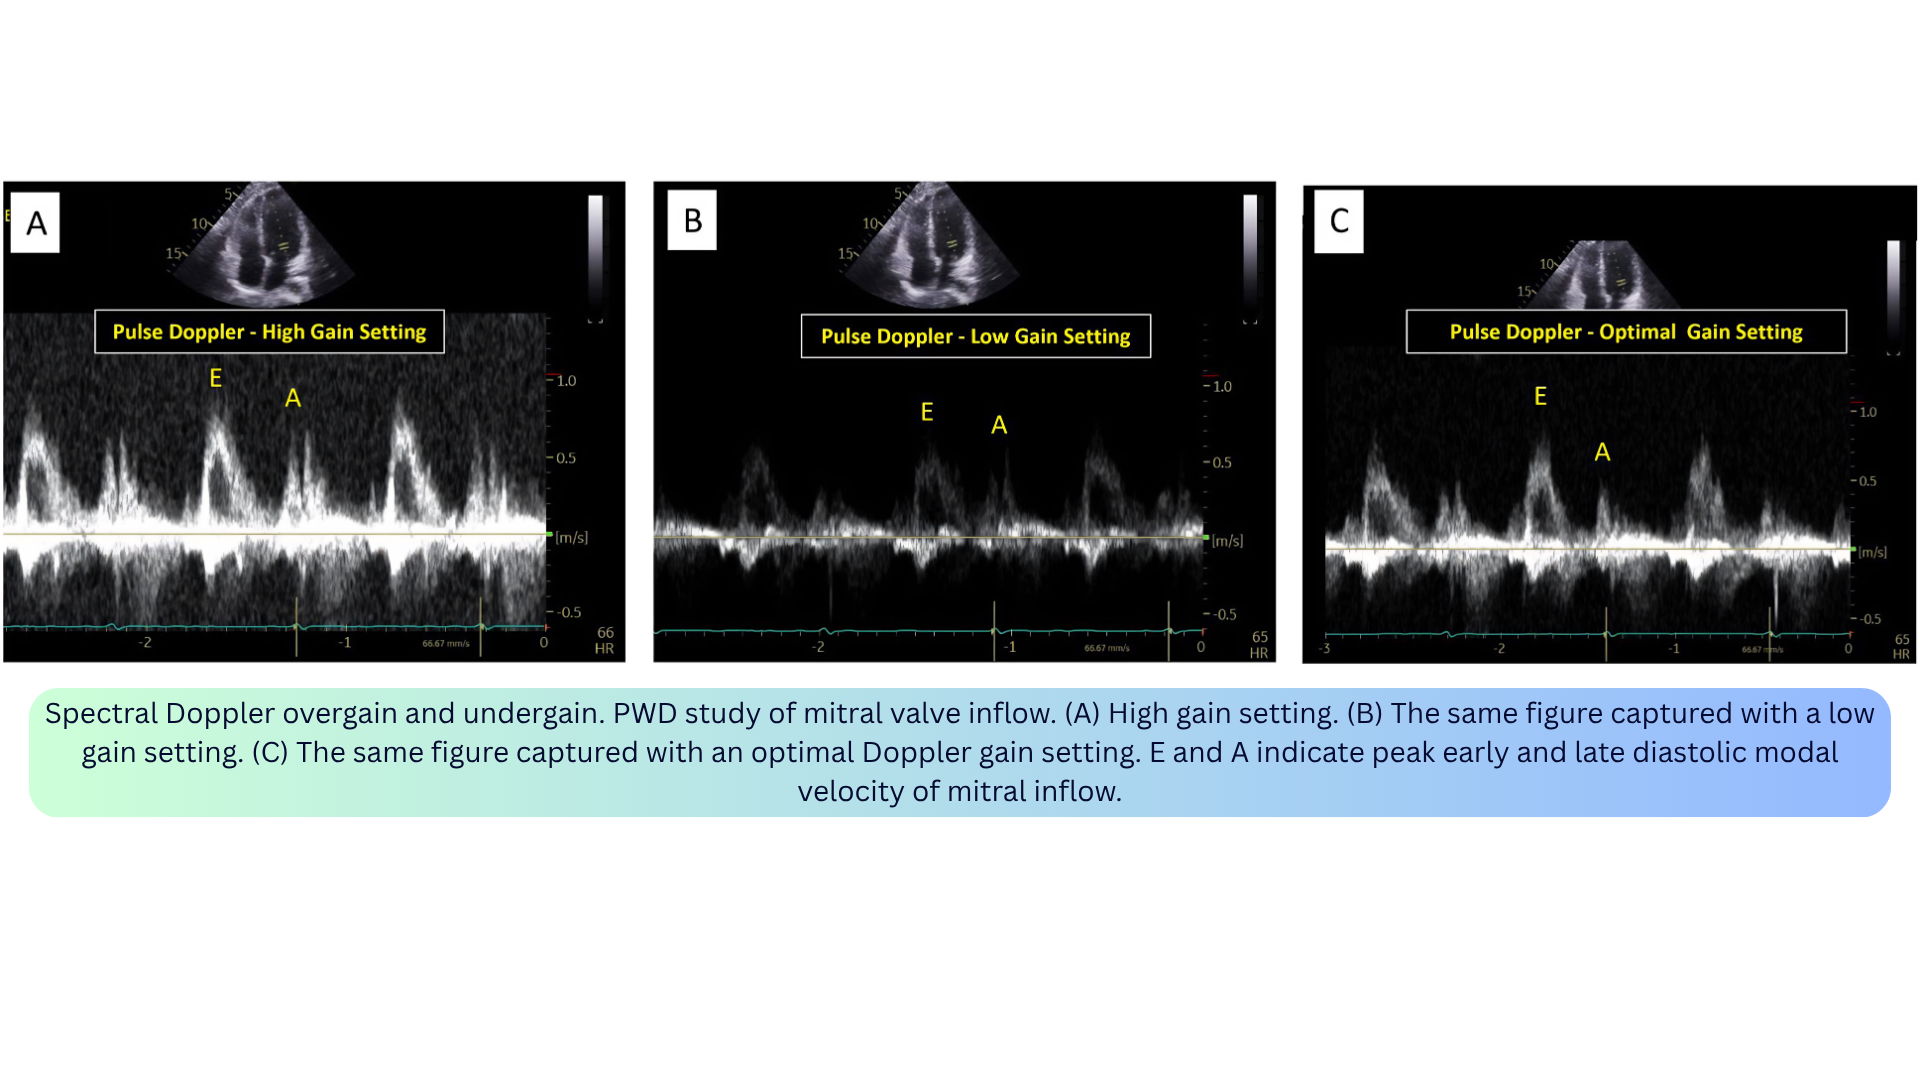
- Overgain: Excessive noise, brighter signal, falsely elevated velocities (e.g., TR or aortic stenosis jet), spectral broadening, filled-in window.
- Undergain: Less bright signal, loss of low-amplitude information (e.g., faint diastolic flow may disappear).
- Mechanism: Overgain = excessive amplification; undergain = insufficient amplification.
- Clinical relevance:
- Overgain can overestimate velocity measurements, leading to unnecessary diagnostic or therapeutic interventions.
- Undergain can result in missing important low-amplitude information.
- Optimal gain is the minimum required to display the full envelope without noise.
- How to fix: Start with high gain, then reduce until the background is clean and the window is visible. The densest portion of the spectral Doppler signal should be measured.

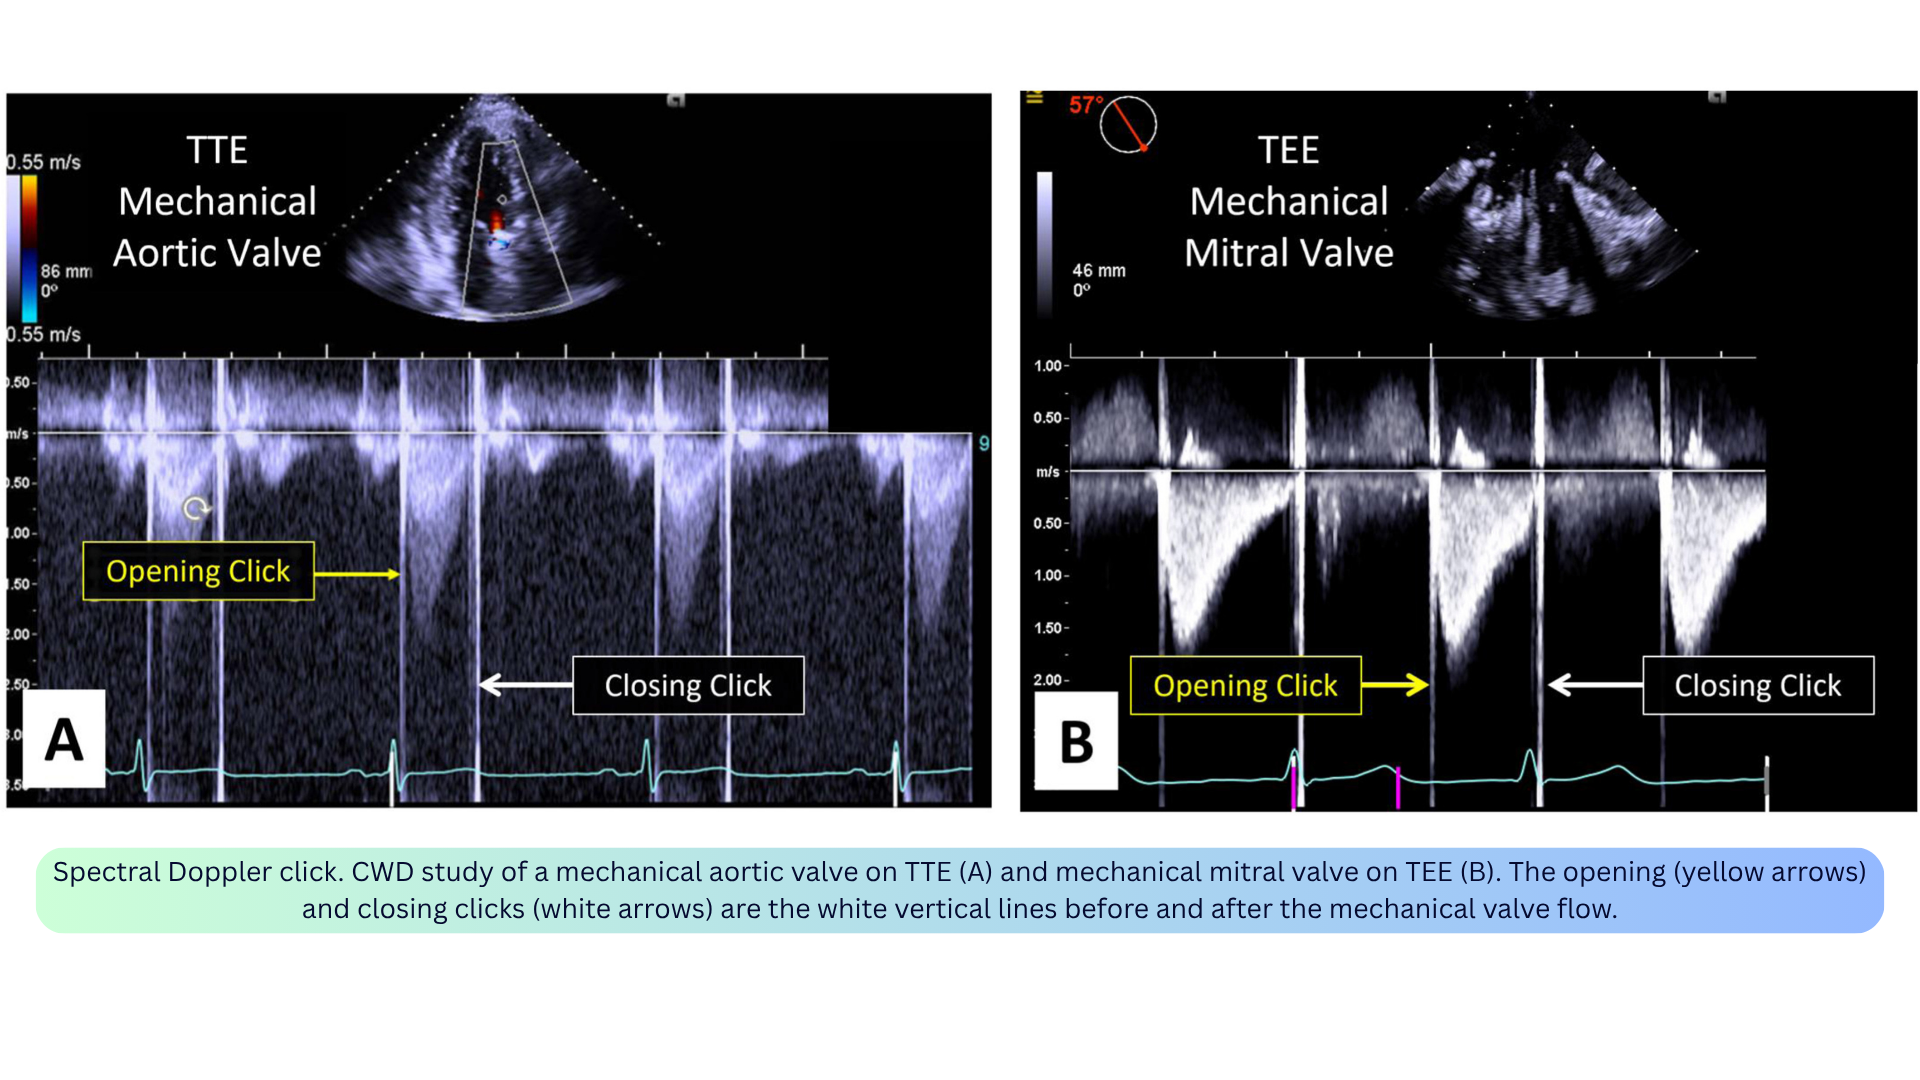
◾️Spectral Doppler Click (Artifact-Like Phenomenon)
- What it is: Opening and closing clicks of mechanical prosthetic valves — a true finding, not a true artifact, but sometimes improperly referred to as an artifact.
- Appearance: Prominent vertical white lines before and after the mechanical valve flow on CWD.
- Mechanism: High-amplitude oscillations from the mechanical leaflets.
- Clinical relevance: The absence of these prominent clicks may suggest prosthetic valve dysfunction and warrants further investigation.
- How to interpret: Recognize as a normal finding for mechanical prostheses; their absence is the abnormal finding.
◾️Color Doppler Aliasing
- What it is: Inaccurate representation of velocity and direction when flow exceeds the Nyquist limit.
- Appearance: The aliased flow displays as the brightest hue of the color and in the opposite color of the color map (e.g., from brightest red to brightest blue). May appear as a mosaic of colors (red, blue, green, yellow).
- Mechanism: Color Doppler is derived from PWD and has similar limitations. Aliasing occurs when the moving targets’ frequencies are greater than twice the PRF.
- Clinical relevance:
- Normal LVOT flow can exhibit aliasing if velocity exceeds the Nyquist limit.
- Can be beneficial for quantifying flow by the PISA method — intentionally induced by shifting the baseline to create a distinct aliased hemispheric boundary.
- How to fix: Shift the baseline; maximize the velocity scale; decrease the sector depth; decrease the emitted ultrasound frequency.
- Clinical pearl: Aliasing is a useful clue for identifying potentially abnormally high velocities in the heart.

◾️Color Doppler Blooming
- What it is: The color signal extends beyond the vessel wall — the vessel appears larger than it actually is (“color bleed”).
- Appearance: Color map extending beyond true anatomical boundaries; can give a false impression of flow within soft tissues.
- Mechanism: Typically happens with high-gain settings.
- Clinical relevance: Can overestimate the severity of regurgitation or the size of a shunt; can obscure tissue pathology of vessel walls or other structures.
- How to fix: Lower color gain to just above the noise level; increase the wall filter.
- Clinical pearl: Blooming can overestimate the severity of regurgitation or the size of a shunt.
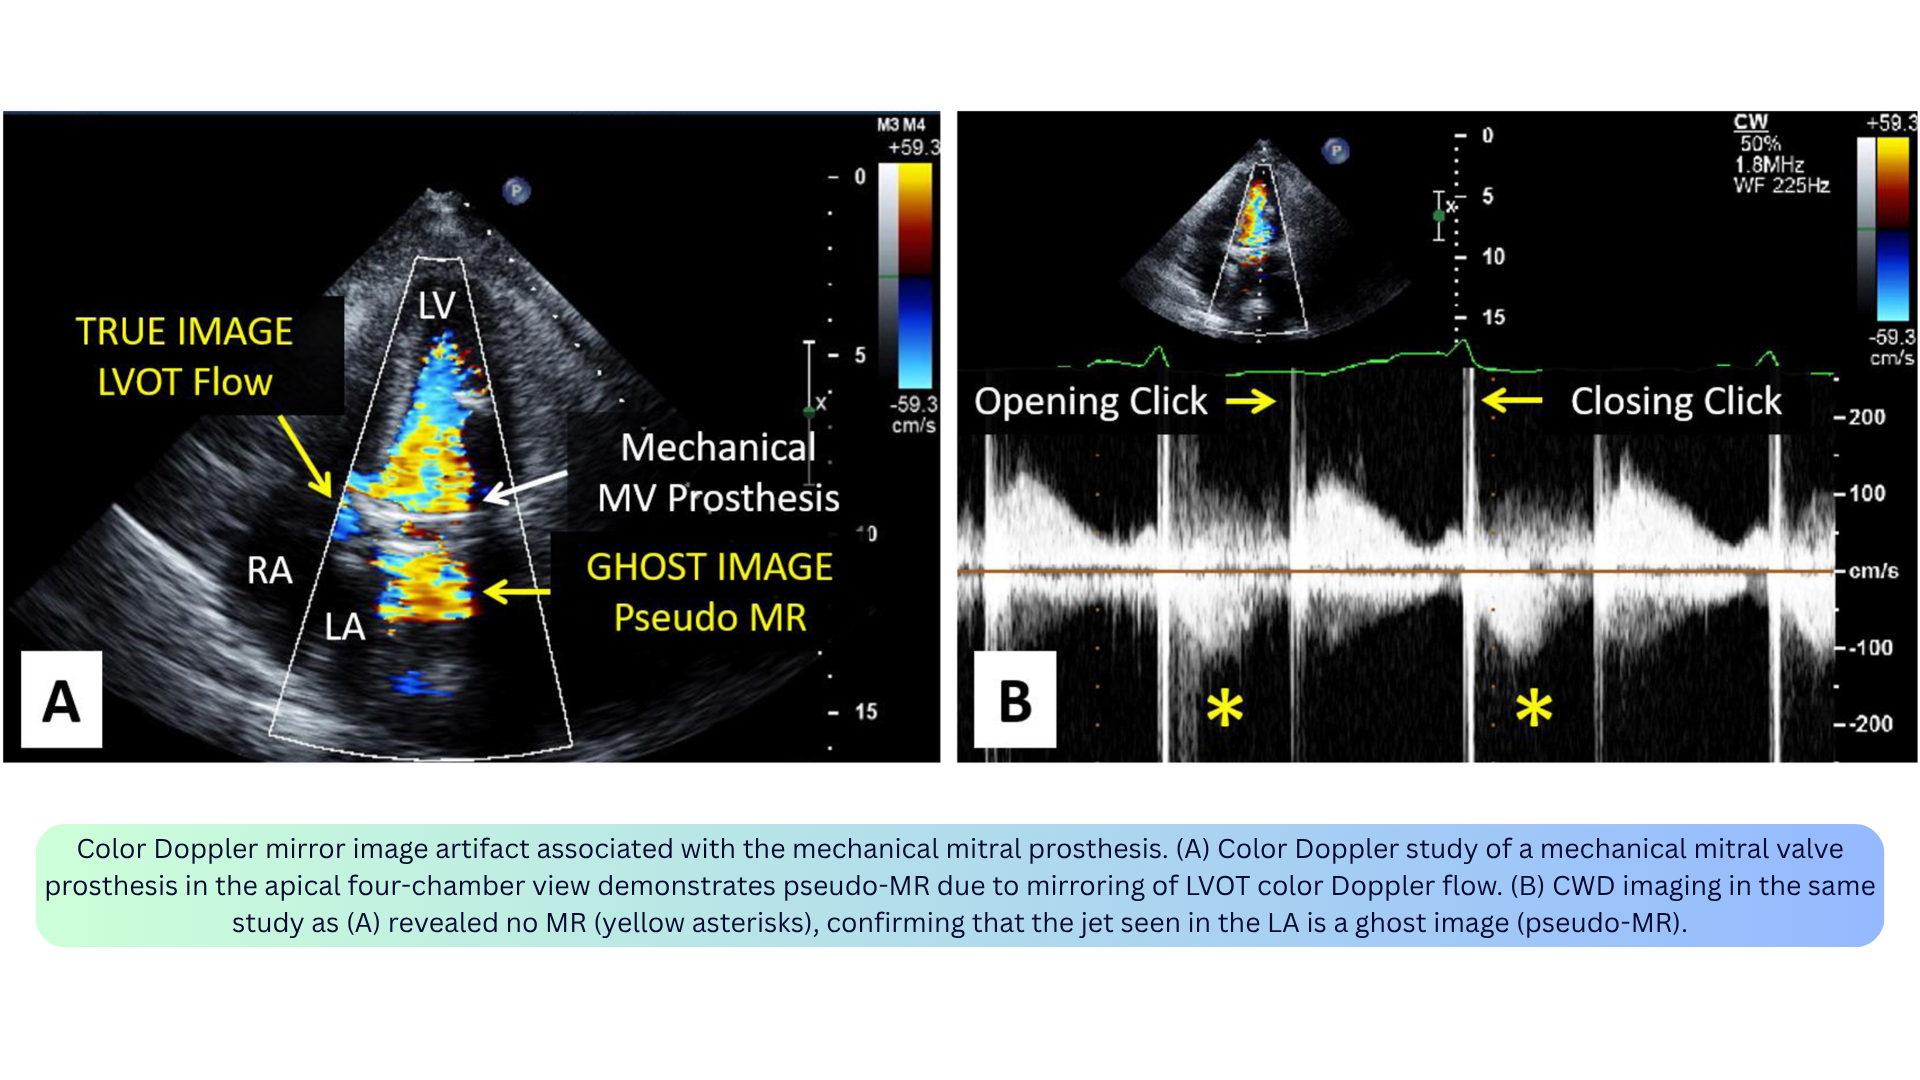
◾️Color Doppler Mirror Artifact
- What it is: A false mirrored image of the actual color Doppler flow, inverted in the axial direction and seen on the opposite side of a strong specular reflector.
- Appearance: A ghost image of color Doppler flow appearing on the opposite side of a strong reflector (e.g., pericardium, pleural lining).
- Mechanism: Similar to 2D mirror artifacts — the emitted Doppler pulses are mirrored at the level of the reflector and misinterpreted by the transducer as originating from distal to the reflector.
- Clinical relevance:
- Can simulate a significant mitral regurgitant jet in the LA in patients with calcific aortic stenosis (parasternal long-axis view).
- “Double-barreled” IVC from subcostal window or “double-barreled” aorta from suprasternal window.
- Pseudo-MR: Mirroring of LVOT flow into the LA in patients with mechanical mitral valve prostheses can give the false impression of severe prosthetic MR.
- Distinguished from true MR by: examining the PWD velocity waveform, absence of LV proximal flow convergence region, and distance between the prosthesis and artifactual flow equal to the distance between the mirroring prosthesis and the LVOT.
- How to fix: Use alternative imaging planes; decrease color Doppler gain settings; suspect when flow jets appear in unusual locations or lack proximal flow convergence or vena contracta.
◾️Color Doppler Reverberation and Refraction
- What it is: Color Doppler reverberation is seen at a certain distance distal to the actual jet. Color Doppler refraction occurs when the color jet is simultaneously refracted and copied onto an artifactual double image.
- Appearance: Color Doppler signal appearing distal to the true jet (reverberation) or on a refractile double image (refraction).
- Mechanism: Reverberation: backscattered pulses of a high-flux jet undergo additional reflection within the body. Refraction: occurs in the setting of a 2D refraction artifact — when applying color Doppler on the double image, the color Doppler jet is simultaneously refracted.
- Clinical relevance: May erroneously be mistaken for true anatomic flows.
- How to fix: Use alternative imaging planes; decrease color Doppler gain.
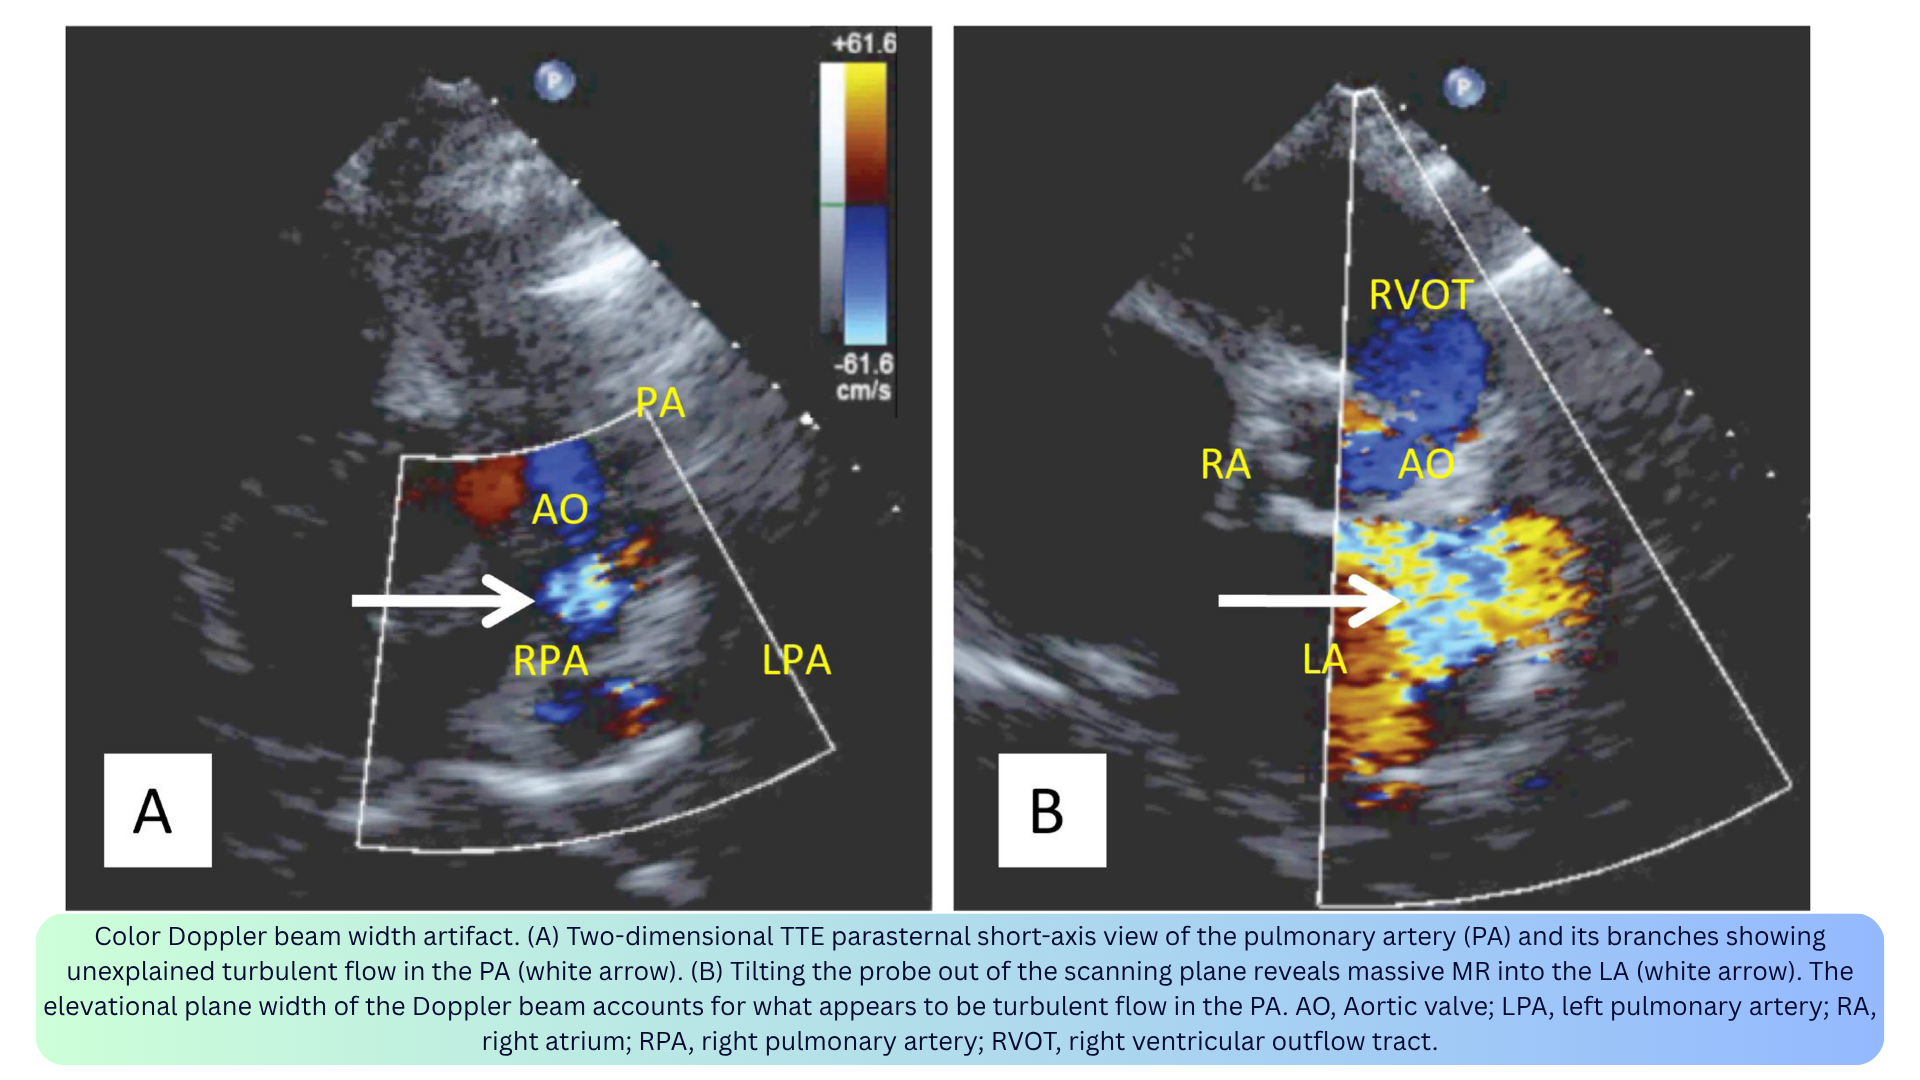
◾️Color Doppler Beam Width and Slice Thickness Artifacts
- What it is: Blood flowing outside the imaging plane but within the elevation width of the ultrasound beam may be misinterpreted by the system as being within the imaging plane.
- Appearance: Color Doppler signal visualized outside the imaging plane (e.g., MR jet appearing as systolic flow in the pulmonary artery; turbulent LVOT flow mistaken for TR — “pseudo-TR”).
- Mechanism: The ultrasound beam has a 3D volume but is displayed in a single tomographic plane. Out-of-plane flow within the beam’s elevational width is displayed as if in-plane.
- Clinical relevance:
- Can lead to diagnostic dilemmas and confusion.
- Pseudo-TR lacks the typical TR direction and vena contracta.
- The origin of the color Doppler flow may be misinterpreted.
- How to fix: Adjust the focal zone; scan the imaging field for out-of-plane flow jets; use alternative imaging windows.
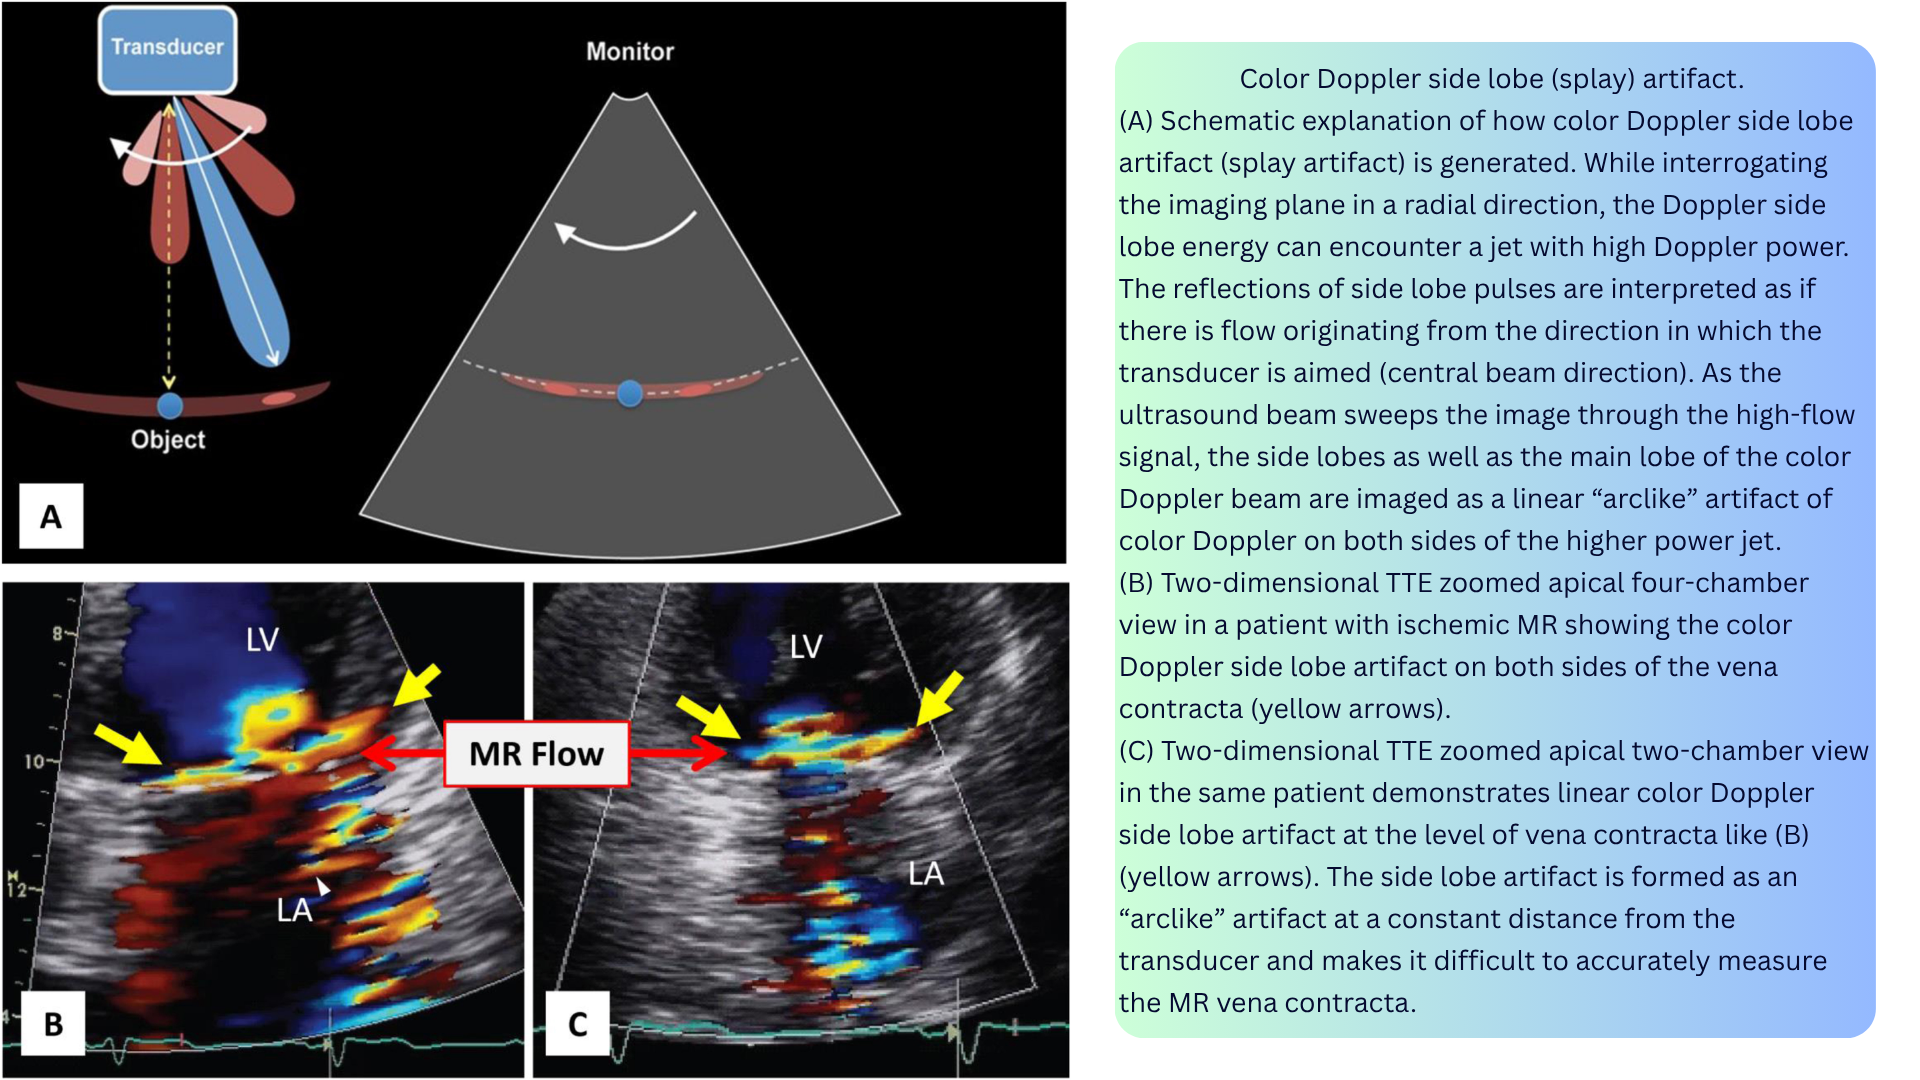
◾️Color Doppler Side Lobe Artifact / Color Splay
- What it is: Linear “arc-like” color Doppler images or symmetric color Doppler images on both sides of a strong color jet.
- Appearance:
- Arc-like artifact at a constant distance from the transducer.
- Symmetric color signals on both sides of a strong reflector (e.g., at the vena contracta of significant AR).
- In eccentric MR, side lobe artifact can be an indirect clue to significant MR — called color Doppler splay.
- Mechanism: Low-energy pulses in the side lobes of the ultrasound beam are typically dissipated in tissue without causing artifacts. However, a high-flux jet (e.g., severe MR) can reflect low-energy Doppler pulses from the side lobes back toward the transducer, causing the artifact.
- Clinical relevance:
- Can make it difficult to accurately measure the MR vena contracta.
- Can be an indirect marker of significant MR when the jet is eccentric and otherwise underestimated.
- Important to avoid misdiagnosing an aortic regurgitant jet for a fistula or abnormal flow.
- How to fix: Decrease color Doppler gain settings.
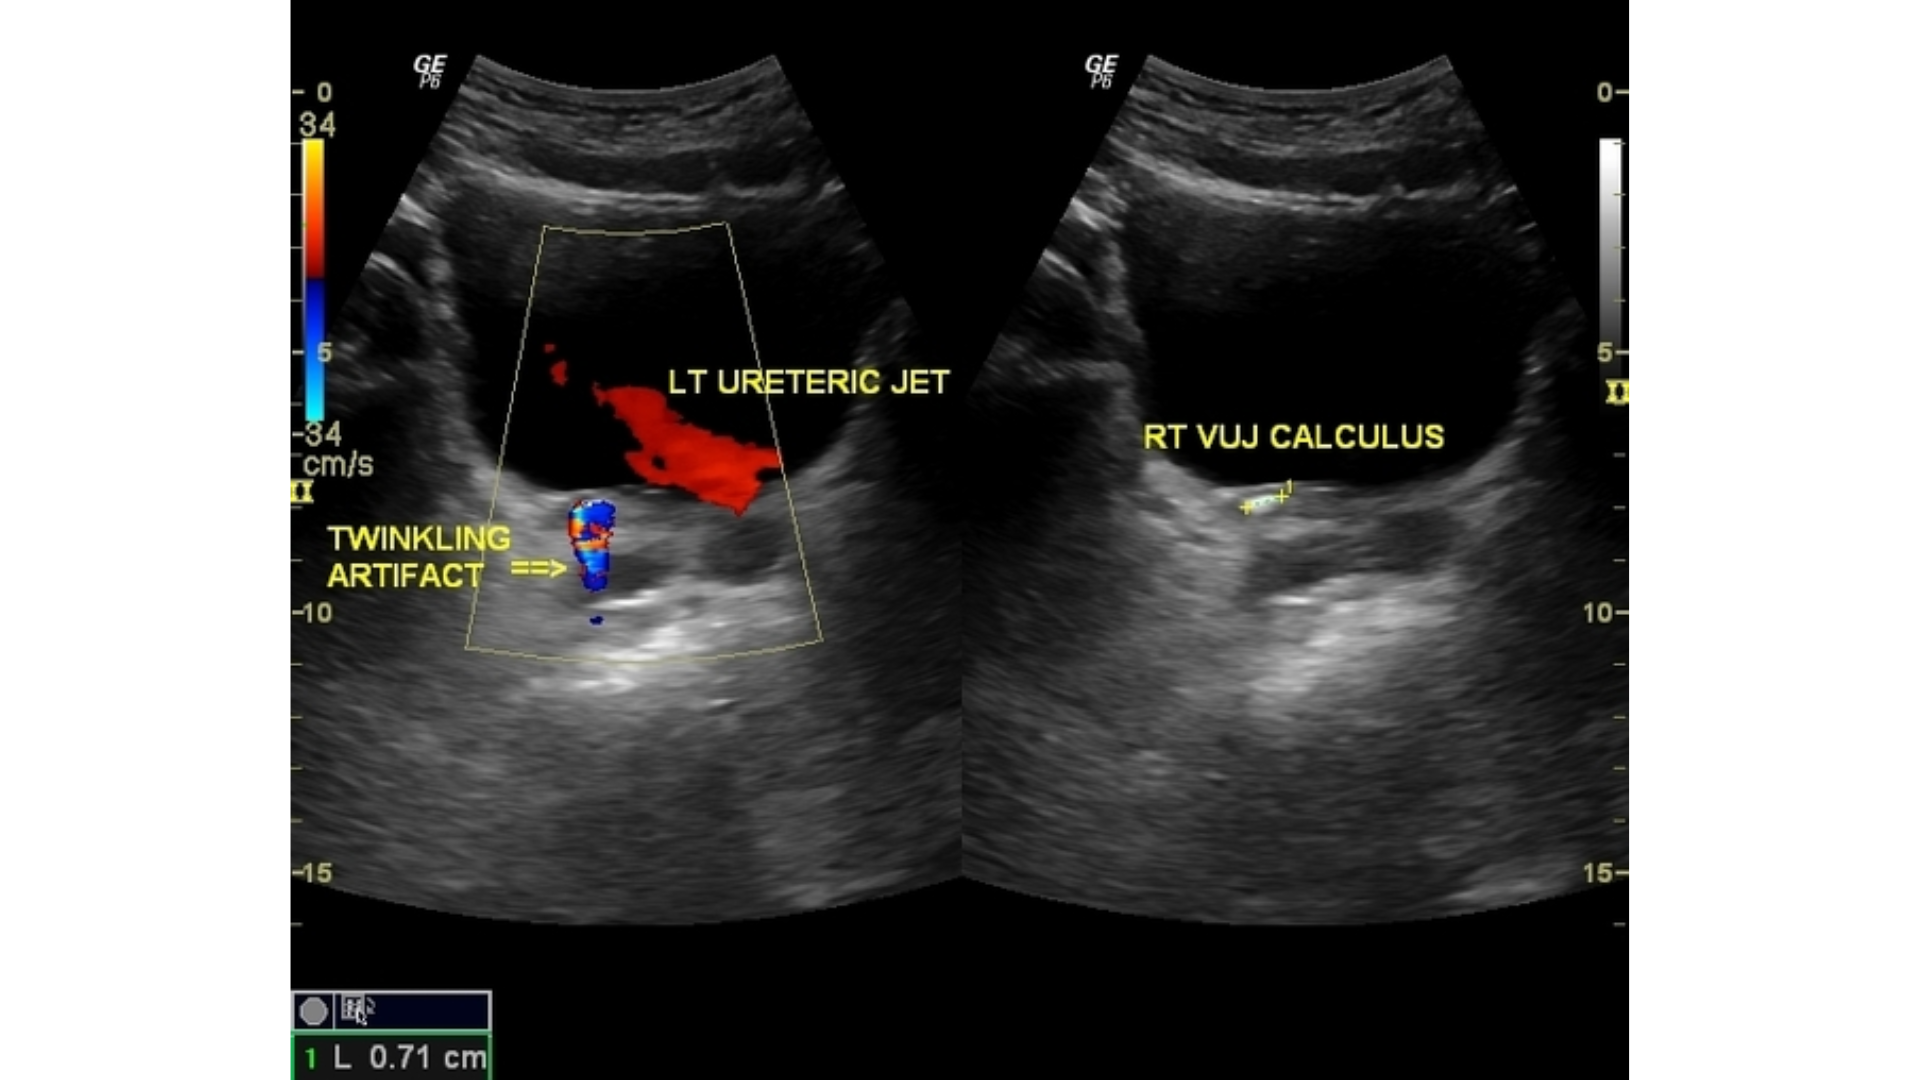
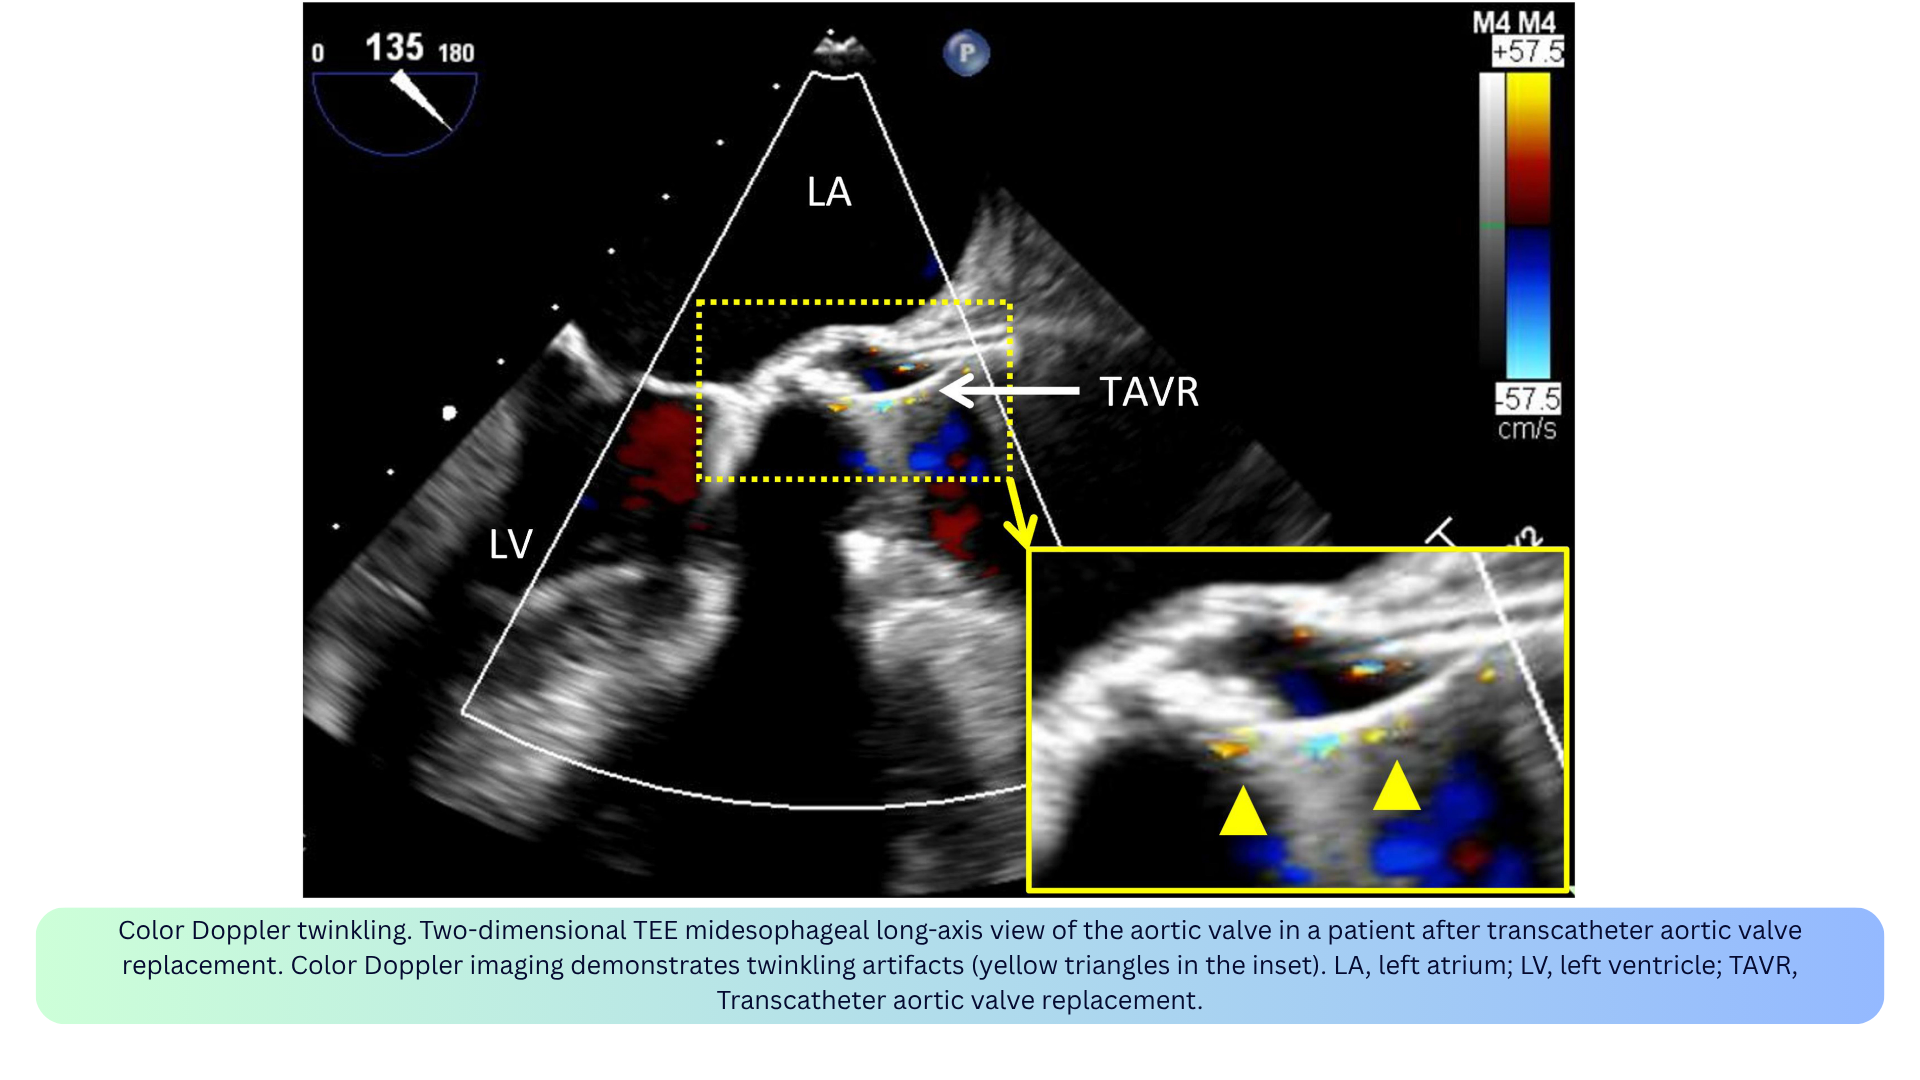
◾️Color Doppler Twinkling
- What it is: A rapidly alternating red/blue color signal appearing behind a stationary object (e.g., calcification, stones, rough surfaces).
- Appearance: Focal, rapidly changing color Doppler signal close to calcifications or devices.
- Mechanism: Caused by a complex interaction of the ultrasound beam with rough or calcified surfaces; dependent on machine settings.
- Clinical relevance:
- Can be misinterpreted as true vascular flow, leading to misdiagnosis.
- Can be diagnostically useful — helps identify stones or calcifications.
- Post-TAVR: can be seen when assessing paravalvular leakage.
- How to fix: Confirm with spectral Doppler — true flow has a phasic waveform; twinkling does not. Twinkling persists when the color velocity scale is increased, while blood flow signals tend to disappear.
◾️Color Doppler Flash
- What it is: Random bursts of color from tissue or fluid motion, not blood flow.
- Appearance: Transient, non-physiologic color signals.
- Mechanism: Caused by patient or transducer motion, or by cardiac motion.
- Clinical relevance: Flash is not flow — do not confuse it with a jet.
- How to fix: Increase the wall filter; minimize patient/transducer motion.

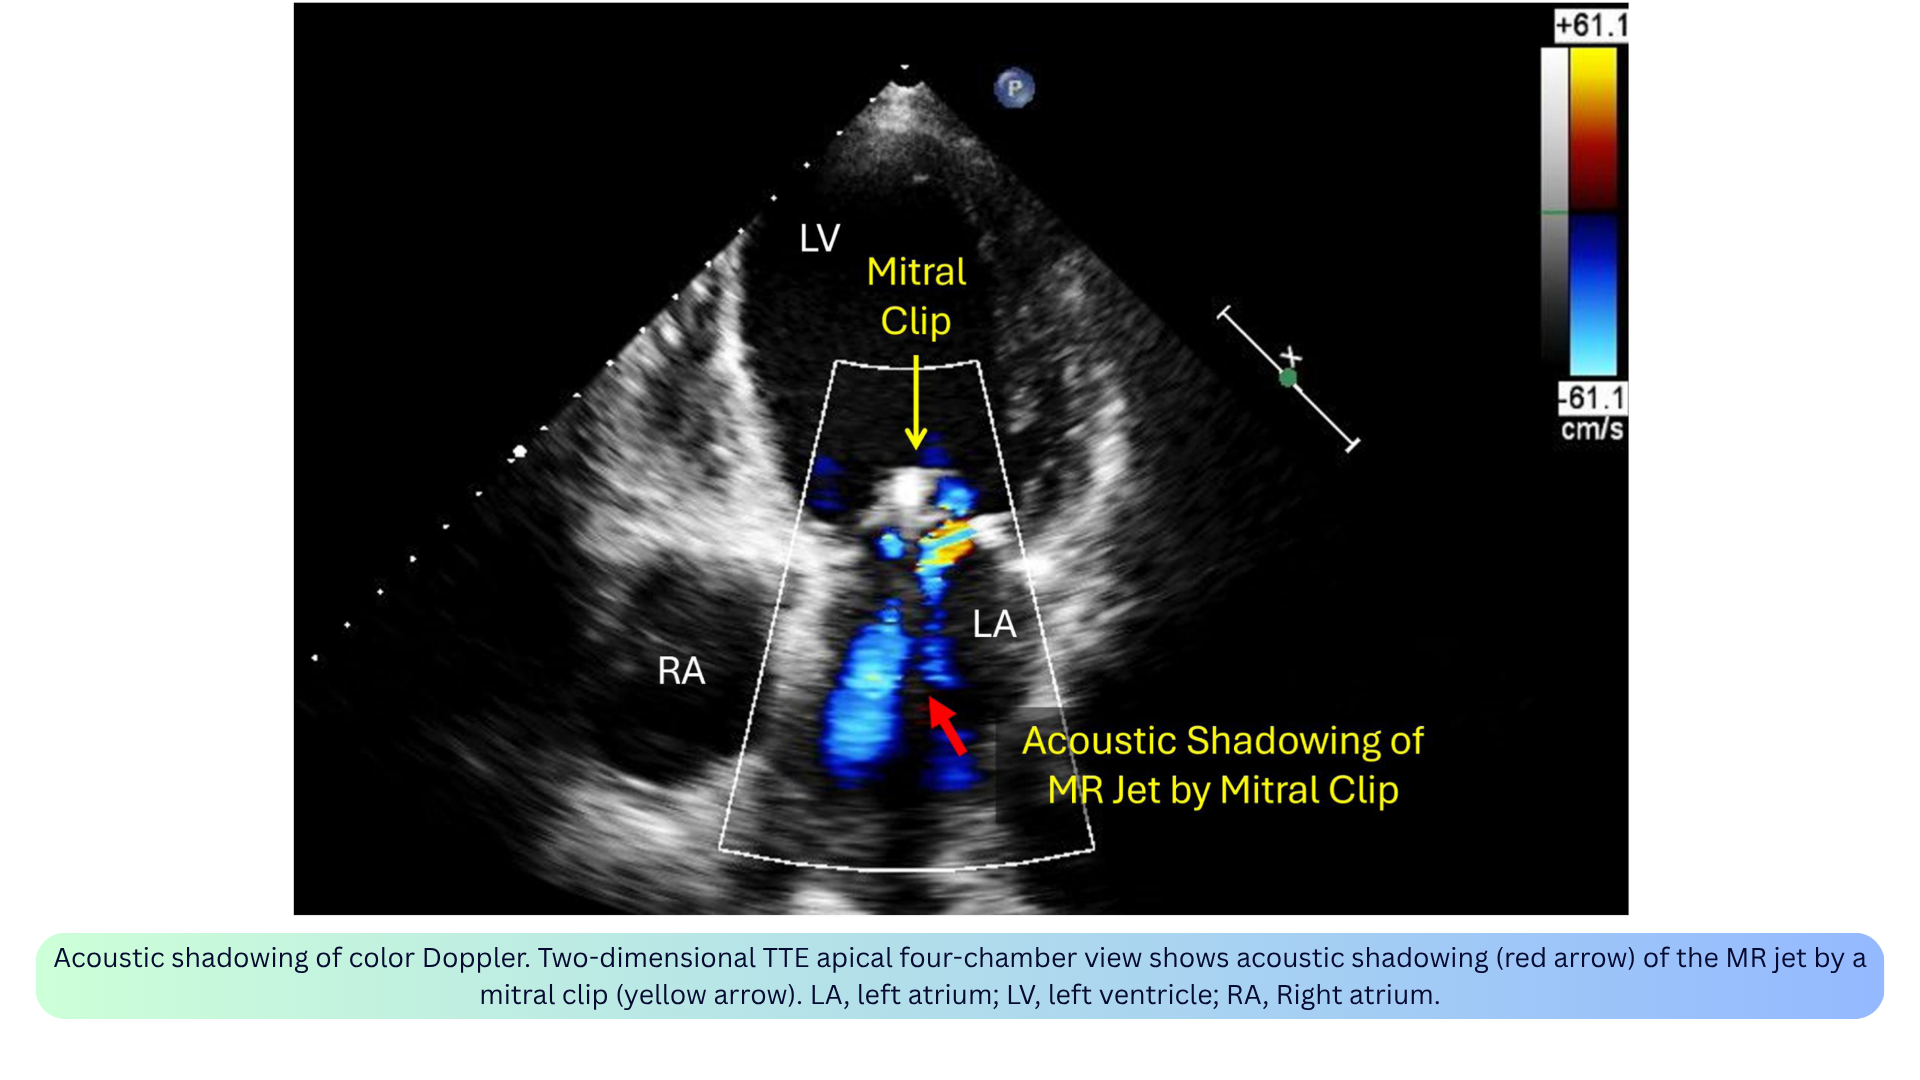
◾️Color Doppler Acoustic Shadowing
- What it is: Absent or reduced color signal distal to a strong reflector (e.g., prosthetic valve, calcium, dense tissue).
- Appearance: A pie-shaped hypoechoic or anechoic sector of absent color distal to a strong reflector.
- Mechanism: The reflector blocks the ultrasound beam, preventing Doppler signals from passing through.
- Clinical relevance:
- Can mimic absence of flow — always confirm with spectral Doppler from a different angle.
- May lead to underestimation of regurgitation severity (e.g., MR jet shadowed by a mitral clip or mechanical prosthesis).
- Only the sewing rings and struts of a bioprosthetic valve cause shadowing; the leaflets themselves do not.
- How to fix: Recognize as artifact; use alternative views (e.g., right parasternal or subcostal views to avoid shadowing by a mitral prosthesis).
- Aliasing is the most important artifact to recognize in PWD — it tells you the velocity exceeds the Nyquist limit and you need CWD or a larger scale.
- Not all artifacts are bad — twinkling identifies stones, aliasing flags high-velocity jets.
- Some artifacts mimic pathology — spectral mirroring can look like reversed flow; double envelope can overestimate gradients.
- Optimization prevents most artifacts — proper gain, scale, wall filter, and beam alignment solve the majority of issues.
How to Optimize the View
✅Align the Beam with Flow
- Keep the ultrasound beam parallel to the direction of blood flow.
- If the angle is less than 20°, the velocity error is less than 6%.
- If the angle is more than 20°, you will underestimate velocity and gradients.
- Use color Doppler to guide alignment — find the jet, then aim the spectral cursor along it.
✅Choose the Right Modality
- Low-velocity, laminar flow (LVOT, mitral inflow, pulmonary veins) → PWD.
- High-velocity, turbulent jets (TRJV, aortic stenosis, regurgitation) → CWD.
- Slow/low flow (perfusion, subtle regurgitation) → Power Doppler.
- Myocardial motion (diastolic function, RV function) → TDI.
- Venous congestion (hepatic, portal, intrarenal veins) → VExUS PWD.
✅Adjust Gain and Filters
- Start with too much gain, then reduce until the background is clean.
- Use the “reject” and “filter” controls to remove low-amplitude noise from myocardium and valves.
- Avoid blooming — an over-gained envelope falsely widens the signal.
✅Set the Velocity Scale (PRF)
- High PRF for high velocities (avoids aliasing).
- Low PRF for low velocities and distant flows (improves sensitivity).
- HPRF with caution — it creates multiple sample volumes along the beam.
✅Fix Aliasing
- Shift the baseline — increases the measurable velocity in one direction.
- Increase the PRF — raises the Nyquist limit.
- Switch to CWD — never aliases, but loses depth information.
- In color Doppler, aliasing appears as a mosaic of colors (red, blue, green, yellow) — reduce the color box size or increase the PRF.
✅Match the Sample Volume to the Site
- Place the PWD sample volume exactly where you want to measure velocity.
- Keep the sample volume small (2–5 mm) for PWD — larger volumes reduce range specificity.
- Measure the CSA at the same level as the Doppler sample — errors in diameter are squared, so small mistakes matter.
✅Average Over Three Cycles
- Use 3 consecutive cardiac cycles for all measurements.
- In atrial fibrillation or irregular rhythms, use more beats (5–10) to capture the average.
✅Optimize Color Doppler
- Keep the color box small — larger boxes reduce frame rate.
- Set the Nyquist scale to match the flow — high for MR/AR, low for pulmonary veins.
- Reduce color gain until background noise disappears.
- Watch for green — this indicates turbulence, which is a clue to pathology.
✅Optimize VExUS Doppler
- Use a curvilinear probe (2–5 MHz) with an abdominal preset.
- Enable PWD with angle correction (<60°) and appropriate wall filters.
- Place the PWD sample volume 1–2 cm within the hepatic vein, in the main portal vein, and in the renal cortex.
- Keep the patient supine and ask them to hold their breath at end-expiration.
✅Use Contrast When the Signal Is Weak
- Agitated saline or microbubble contrast can enhance faint signals (e.g., TRJV, pulmonary venous flow).
- This is especially helpful when the jet is difficult to align or the envelope is incomplete.
‼️Remember the Pitfalls
- Angle > 20° → underestimation of velocity and gradients.
- Wrong PRF → aliasing (PWD) or poor sensitivity (low-velocity flow).
- Too much gain → blooming and overestimation of jet size.
- Too large a sample volume → loss of range specificity in PWD.
- CSA measured at the wrong level → inaccurate stroke volume and valve area.

Add comment