

22 November 2022, by Shahriar Lahouti. Peer reviewed by Mojtaba Chardoli.
CONTENTS
- Preface
- Case scenario
- Normal diastolic function
- Pathophysiology and causes of diastolic dysfunction
- Echocardiographic assessment of diastolic function
- Grading diastolic dysfunction
- Approach to diagnosis of heart failure with preserved ejection fraction (HFpEF)
- Other practical use of diastology
- Pearls & Pitfalls
- Appendix
- Media
- Further going
- References
Preface
Assessment of left ventricular (LV) diastolic function is essential for diagnosis of heart failure with preserved ejection fraction (HFpEF) and also for evaluation of patient’s hemodynamics. Comprehensive echocardiographic exam for diastolic dysfunction recommended by American society of echocardiography is not feasible and not helpful in the emergency department and critical care setting. Rather than going for different echocardiographic measurements, what you need to consider is whether the 👉 left atrial pressure is increased or not. This can be achieved just by mitral inflow and tissue Doppler measurements which will be discussed in this post.
Case scenario
A 61-year-old female with a past history of poorly controlled hypertension, diabetes and COPD presents to the ER with severe shortness of breath but without chest pain. Her initial vital signs are as follows: Temp 38.2 C, HR 90, BP 108/51, RR 26, SpO2 88 % on 6L. She has no known history of heart failure. On examination, faint expiratory wheezes bilaterally are audible. ECG shows no acute ischemic changes. POCUS reveals:
- IVC: Plethoric
- Lung: Bilateral diffuse B-lines
- LVEF >50% (E-Point Septal Separation is ~3mm)
- No evidence of RV strain
- No severe mitral/aortic valvular disease.
👉Q: Is this pneumonia or cardiogenic pulmonary edema? (see here).
Normal diastolic function
Cardiac function is critically dependent upon diastolic physiologic mechanisms to provide adequate LV filling (cardiac input) in parallel with LV ejection (cardiac output) *.
- Diastole is the relaxed phase of the cardiac cycle when the chambers of the heart are re-filling with blood. During diastole, the left ventricle (LV), left atrium (LA), and pulmonary veins form a common chamber, which is continuous with the pulmonary capillary bed.
- Diastology refers to evaluation of diastolic function of the LV. In essence, it is is just a question of “how compliant LV is“?
- The healthy LV myocardium is compliant. Normal relaxation of the contracted myocardium and concomitant distensibility of the LV (the ease with which the LV expands); produce a suction effect that pulls blood into the ventricle thereby promoting diastolic filling.
- The normal compliant LV is easily distensible, offering minimal resistance to LV filling over a normal volume range.
- As a result, LV filling can normally be accomplished by very low filling pressures in the left atrium and pulmonary veins, preserving a low pulmonary capillary pressure (<12 mmHg).
- Loss of normal LV diastolic relaxation and distensibility, due to structural and functional causes, impairs LV pressure decline and filling, resulting in increases in LV diastolic pressure, left atrial pressure, and pulmonary venous pressures, which directly increase the pulmonary capillary pressure.
- If pulmonary capillary wedge pressure is high enough, it causes dyspnea, exercise limitation, pulmonary congestion, and edema.
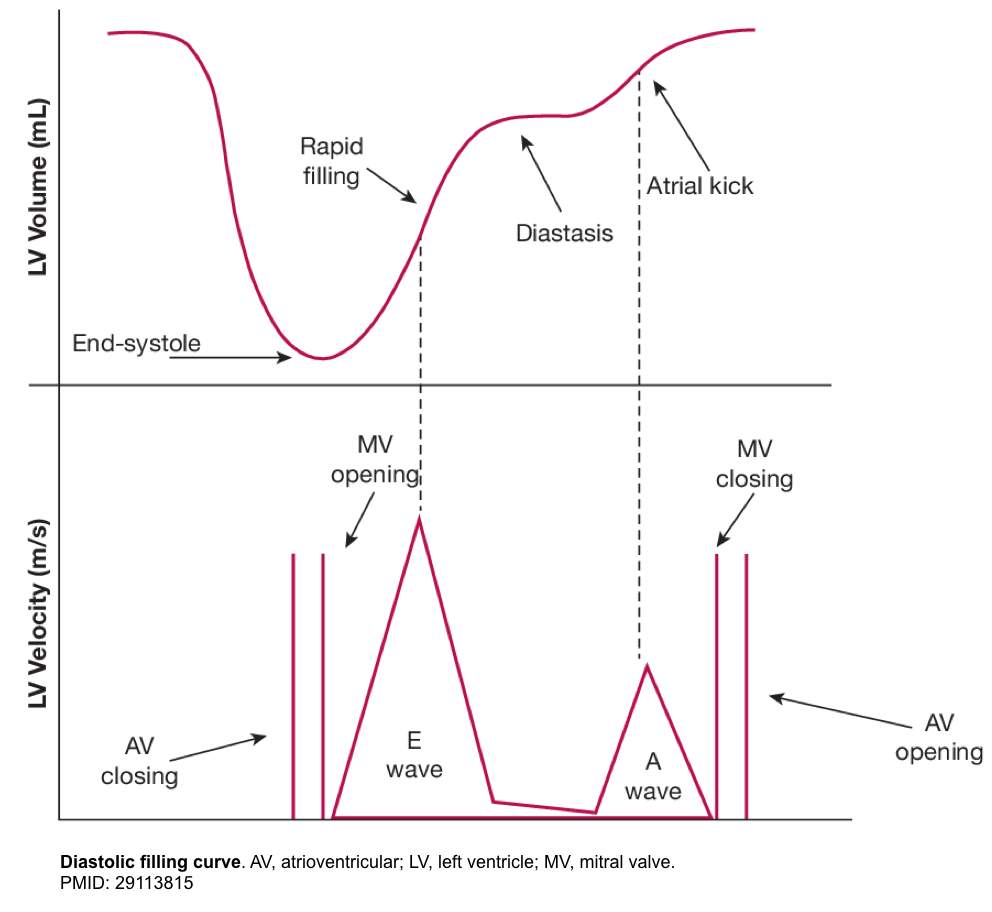
- The normal LV has a characteristic pattern of relaxation and filling. Diastole take places through the following 4 phases (figure below).
- LV relaxation
- This is time interval between aortic valve closure and mitral valve opening. While LV relaxation is taking place, the LV volume is not changing (mitral valve is closed), hence it is called isovolumetric relaxation.
- Early rapid diastolic filling (E wave)
- In a normal heart, LV is perfectly capable to both relax and expand (compliant LV). This will allow the blood to be suctioned (pulled) into the LA.
- In normal physiologic condition, most of the blood (~80%) is suctioned into the LV during this phase passively.
- The rate of LV filling ( LV inflow velocity) is greatest in this phase and is responsible for the normally tall E wave of the trans-mitral inflow Doppler echocardiogram.
- Diastasis:
- During the later phase of diastole, the rising LV pressure hampers passive trans-mitral flow of blood to the LV. This will account for slowing of the LV filling.
- Atrial kick (A wave)
- In late diastole, the atrial contraction will pump the remaining left atrial blood (~20%) into the LV.
- Since most of the left atrial blood is already suctioned during early diastole, the velocity imparted by the atrial contraction (the A wave of the trans-mitral inflow Doppler echo) is relatively low, and the normal E/A wave ratio is greater than ~1 in adult.
- LV relaxation
Pathophysiology and causes of diastolic dysfunction
The full discussion of pathophysiology and causes of diastolic dysfunction is beyond the scope of this discussion. The highlights of the potential comorbidities and some common causes of HFpEF and the corresponding pathophysiologies are mentioned here *.
- Longstanding diabetes: Increased left ventricular stiffness
- Long standing hypertension: Left ventricular hypertrophy, increased left ventricular stiffness
- Chronic kidney disease: Chronic volume overload
- Grade II obesity (BMI>35 kg/m2): Concentric remodeling, systemic inflammation, epicardial fat deposits
- Atrial fibrillation: Impaired atrial contraction, atrial cardiomyopathy *
- Coronary arterial disease: Subendocardial ischemia *
- Hypertrophic * and restrictive cardiomyopathies
- Constrictive pericarditis
- Valvular heart disease
- Severe aortic stenosis: LV concentric remodeling or hypertrophy leads to slowed myocardial relaxation in early diastole, low chamber compliance, and increased myocardial stiffness.
- Severe aortic regurgitation: LV remodeling (hypertrophy, slowed relaxation, increased chamber stiffness) in response to volume overload.
- Severe mitral regurgitation
👉Compared with HFrEF, patients with HFpEF are older, more often women and more commonly have a history of hypertension and atrial fibrillation, while a history of myocardial infarction is less common *.
Echocardiographic assessment of diastolic function
The essential task for frontline provider in critical care setting is to determine if the left atrial pressure (LAP) is increased or not. LAP is also known as:
- Pulmonary capillary wedge pressure (PCWP).
- Left ventricular end diastolic pressure (LVEDP).
The core of HFpEF diagnosis is the demonstration of elevated LAP.
- Elevated LAP signifies a high pressure in central circulation system.
- This can also be seen in patients with HFrEF and patients with pure volume overload.
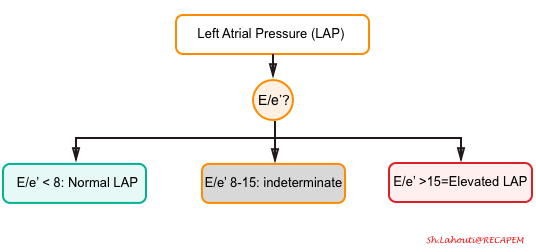
It has been shown that echocardiographic measurement of E/e’ ratio correlates best with LAP (see below).
How to use echocardiography to estimate LAP?
- You must have Pulse Wave Doppler and Tissue Doppler capability on your ultrasound system.
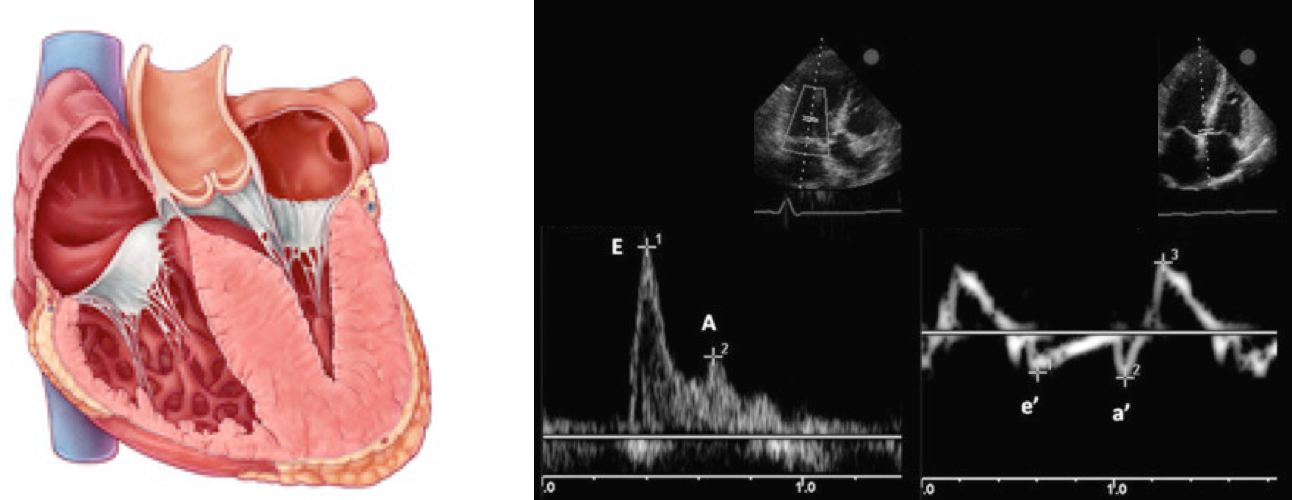
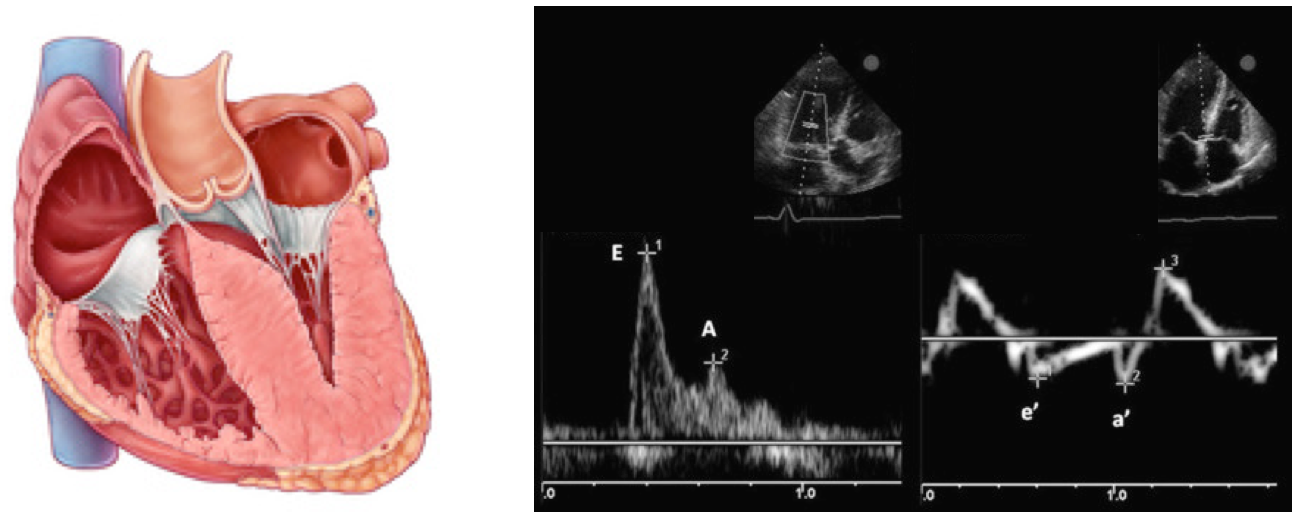
- Pulse Wave Doppler allows you to measure the velocity of blood flow (at a single point) as it enters the left ventricle at the mitral leaflet tips (apical 4-chamber view)
- Since blood is flowing from the left atrium into the left ventricle it will be going TOWARDS the probe and there will be an UPWARD deflection of the Pulse Wave Doppler signal. This will result in the E and A waves.
- Tissue doppler is used to assess LV muscle movement.
- It allows you to measure the speed of left ventricular muscle relaxation during diastole. This will allow you to see how “stiff” the left ventricle is. A normal heart will relax quickly during diastole and a stiff heart will have a slower speed of muscle relaxation.
- How to set the tissue Doppler gate:? The two validated areas where you can place the Tissue Doppler sample gate are at the septal or lateral portions of the mitral annulus. Using the septal annulus is easier to obtain. This will produce two downward deflections; e’ and a’.
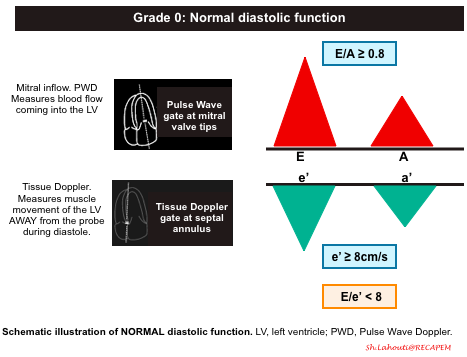
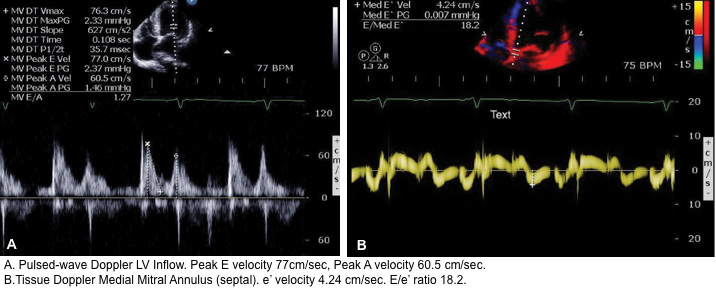
Normal Doppler waveforms: The normal diastolic profile of the LV and (E, e’ waves) is shown below.
How to estimate and interpret the measurements
- LAP can be estimated echocardiographically by measuring E/e’ ratio.
- Different cutoff values have been used depending on the site of e’ measurement (septal vs. lateral e’).
- E/e’ ratio of >15 suggests elevated LAP (using septal e’).
- The cutoff for Lateral E/e’ is > 13 and for the average E/e’ is >14 *.
- E/e’ <8 is considered normal LAP.
- E/e’ between 8-15 is indeterminate.
- This range can be used as a spectrum. A value closer to 8 suggests a lower LAP, and a value closer to 15 is suggestive for a higher LAP.
- Further echocardiographic evaluation is warranted for diagnosis of diastolic dysfunction (LA volume, TR Jet velocity).
- E/e’ ratio of >15 suggests elevated LAP (using septal e’).
- Different cutoff values have been used depending on the site of e’ measurement (septal vs. lateral e’).
- Keep in mind that E/e’ is not equal to LAP. The Nagueh formula can estimate LAP based on the E/e’ ratio *.
- Nagueh formula: LAP= (1.24 * E/e’) + 1.9
- Simplified to LAP = E/e’ + 4.
- 👉However the E/e’ cutoffs are enough to remember for clinical use to identify elevated LAP.
- In appropriate clinical context (e.g. dyspneic patients with cardiovascular risk factors and presence of bilateral B-lines on lung ultrasound), an elevated LAP is suggestive for cardiogenic pulmonary edema.
If measurement of e’ is not technically feasible, evaluation of E/A ratio may be informative. This is described below👇.
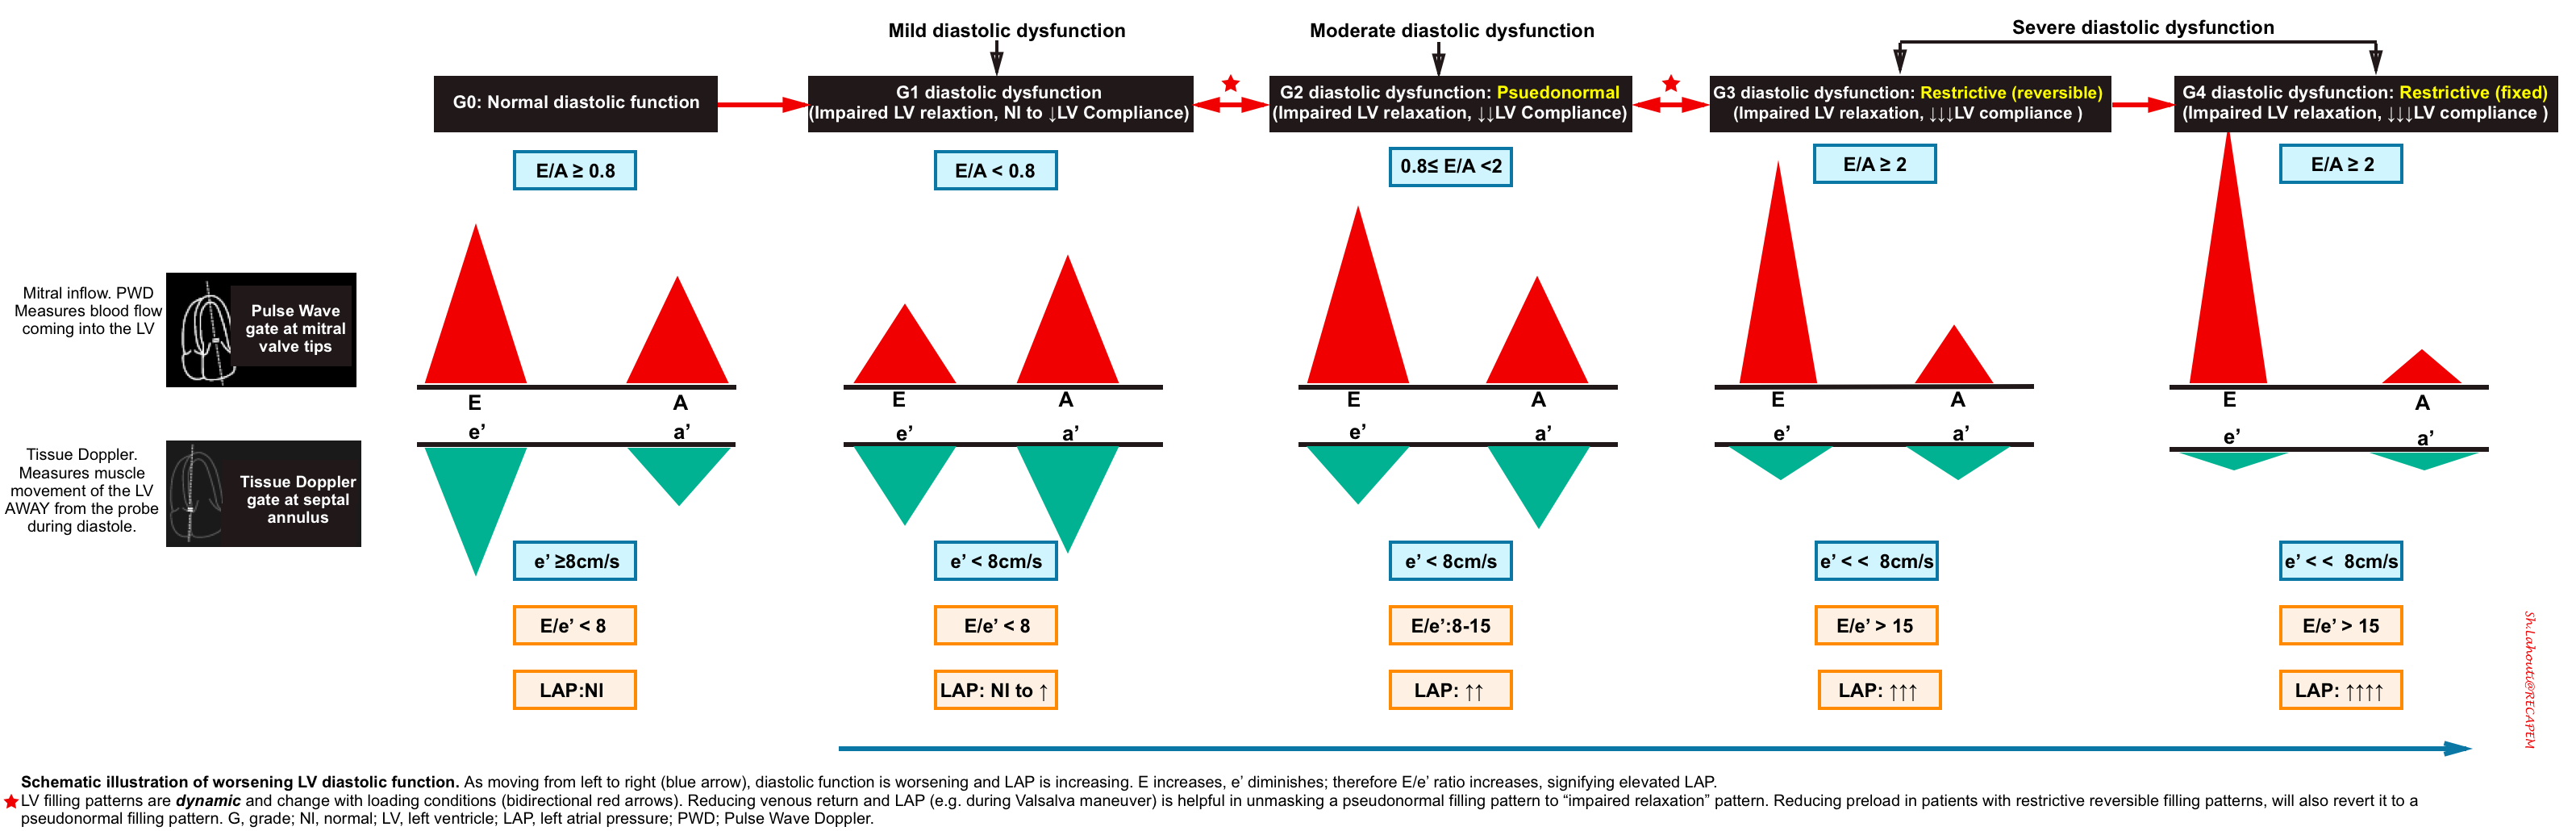
Grading diastolic dysfunction
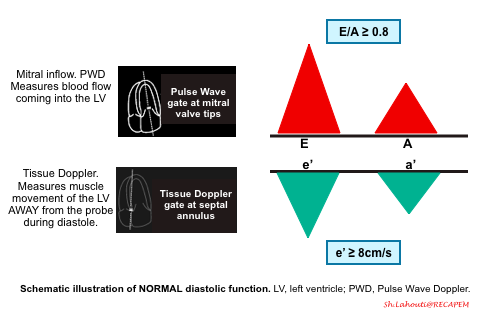
Grade 0. Normal diastolic function
- Normal diastolic function is seen in healthy hearts, where most of the blood flow into the left ventricle occurs during early diastolic filling from the passive “PULL” of the left ventricle as it relaxes and expands.
- Mitral Inflow Pattern: E/A ratio ≥ 0.8
- As most of the blood flow to the LV take places early in diastole from passive pull of the LV relaxation, The E wave amplitude is large, comparing to small A wave.
- Tissue Doppler pattern: e’ ≥8cm/sec
- Since the healthy LV myocardium is relaxing normally (quickly), the e’ velocity on Tissue Doppler will be a large negative deflection of ≥ 8cm/sec (for septal e’).
- If you use the lateral annulus e’ the normal value is >10 cm/s.
- Since the healthy LV myocardium is relaxing normally (quickly), the e’ velocity on Tissue Doppler will be a large negative deflection of ≥ 8cm/sec (for septal e’).
- E/e’ ratio ≤8
- The E/e’ ratio has been found to be fairly sensitive in evaluating the degree of diastolic dysfunction. The LOWER the ratio the better the diastolic function. This makes sense since the ratio is inversely proportional to the e’. So the higher the e’ (better diastolic function/muscle relaxation) the lower E/e’ ratio.
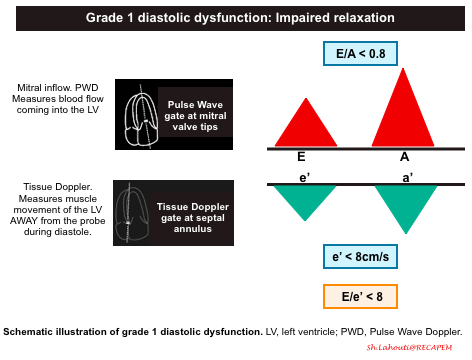
Grade 1 diastolic dysfunction: Impaired relaxation
- Pathophysiologic background
- The primary problem is impaired relaxation of the left ventricle.
- Mitral Inflow Pattern: E/A < 0.8
- Impaired LV relaxation results in a decrease of the normal “PULL” during early ventricular diastole and you will end up seeing a smaller amplitude E wave. The remaining blood is then pumped into the left ventricle during the atrial kick, resulting in a larger A wave.
- Tissue Doppler pattern: e’ < 8cm/s
- LV relaxation impairment results in smaller amplitude e’ velocities.
- E/e’ ratio < 8
- Since amplitude of both E and e’ waves are decreased, the relative ratio is preserved.
- Since both Grade 0 and Grade 1 Diastolic Dysfunction will have E/e’ ratio < 8, you will have to rely on your E/A ratio. Grade 0 diastolic function will have E/A > 0.8 and Grade 1 diastolic dysfunction will have an E/A ratio of < 0.8.
- Since amplitude of both E and e’ waves are decreased, the relative ratio is preserved.
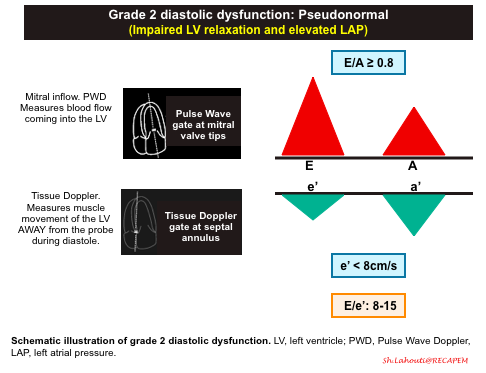
Grade 2 diastolic dysfunction: Pseudonormal
- Pathophysiologic background
- Progressive worsening of LV stiffness, leading to increased left atrial pressure +/- left atrial enlargement.
- Mitral Inflow Pattern. E/A ratio E/A ratio ≥ 0.8.
- Progressive stiffening of LV results in left atrial pressure rise, so that LA accommodates the higher left ventricular diastolic pressures.
- The elevated LAP will cause a significant amount of blood to flow into the left ventricle during early diastolic filling. This will result in an increased E wave on your mitral inflow pattern. This is what results in the term “Pseudonormalization” because the E and A waves pattern look like a normal waveform (E/A > 0.8).
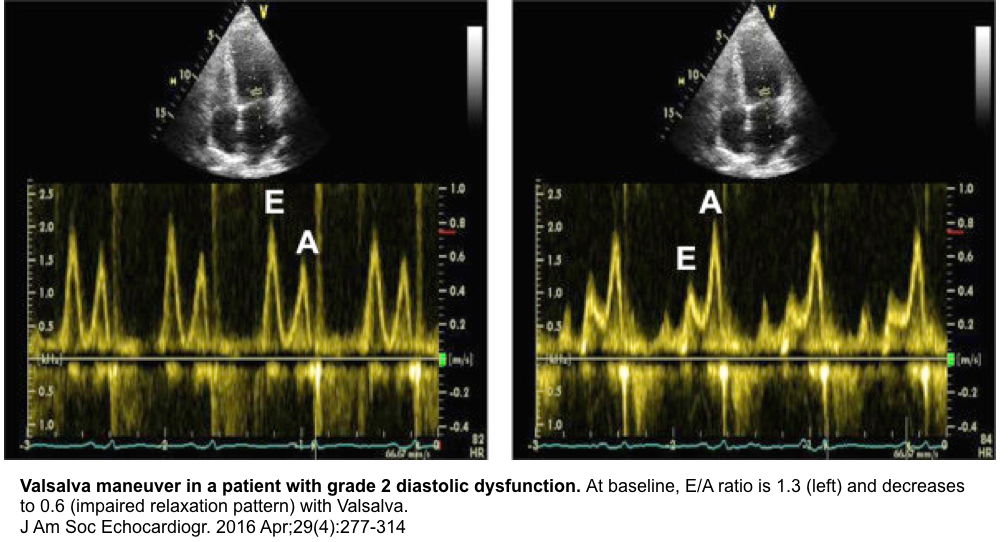
- To differentiate Grade 2 diastolic dysfunction from Grade 0, assess e’ velocity, or alternatively perform Valsalva maneuver.
- Tissue Doppler pattern. e'<8cm/sec
- A more stiff LV results in slower relaxation, and smaller amplitude e’ wave.
- A decrease in e’ (< 8cm/s) is the defining feature between Grade 0 (normal) and Grade 2 diastolic dysfunction.
- E/e’ ratio between 8 -15
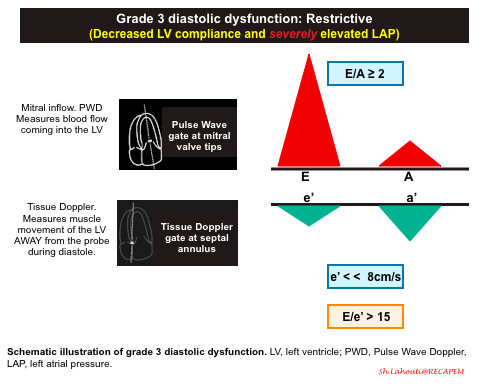
Grade 3 diastolic dysfunction: Restrictive
- Pathophysiologic background
- Continued and severe worsening of left ventricular stiffness leads to severely increased LAP with left atrial enlargement (LAE).
- Mitral Inflow Pattern
- In the early diastolic filling of a patient with Grade 3 diastolic dysfunction, almost all of the blood will fill the left ventricle from the PUSH of the extremely high pressures in the left atrium. You should see a very large and narrow E wave with an E/A ratio ≥ 2.
- Tissue Doppler pattern. e’ << 8cm/sec
- In Grade 3 diastolic dysfunction, the muscle of the left ventricle will have severely reduced motion given the non-compliance of the LV. This will result in a very small e’ wave.
- E/e’ ratio > 15.
- Since the E wave will be elevated and the e’ wave will be depressed, a patient with Grade 3 diastolic dysfunction will have an E/e’ ratio > 15.
- The only difference between Grade 3 and Grade 4 diastolic dysfunction is that Grade 3 is considered “reversible” and Grade 4 is considered “irreversible.”
- You can evaluate this by doing a Valsalva maneuver and seeing if the mitral inflow waveform changes.
- Technique
- This maneuver is usually performed while interrogating transmitral inflow.
- The Valsalva maneuver is achieved by straining against a closed airway for 10-15 sec following a deep inspiration.
- Analogies that may help the patient to understand what is required include, “Hold your nose and try to pop your ears as you would do on an airplane”.
- Technical challenge in performing this maneuver include having the patient generate a sufficient increase in intrathoracic pressure for at least 10 sec while the sonographer maintains an image with the sample volume correctly positioned between the mitral leaflet tips.
- Physiologic effect
- During the strain phase of the Valsalva maneuver, intrathoracic pressure exceeds the pressure in the great veins resulting in a positive intrathoracic pressure, which leads to decreased venous return to the heart and thus a decreased preload.
- The effect of decreased preload on a normal transmitral trace is a comparable reduction in both the E and A velocities with the resultant E/A ratio remaining unchanged *.
- Diagnostic utility
- To diagnose the pseudonormal transmitral inflow profile
- In patients with pseudonormal profile (elevated LAP) there is a decrease in the E/A ratio of ≥50%. Therefore, Valsalva maneuver can unmask the underlying impaired relaxation pattern (see images below) *.
- To differentiate reversible restrictive filling (G3) from an irreversible restrictive filling (G4).
- When there is reversible restrictive filling, preload reduction will result in a reversal of this filling profile to either a pseudonormal filling profile or even to an impaired relaxation filling profile.
- When there is irreversible restrictive filling, the transmitral inflow profile remains unchanged.
- To diagnose the pseudonormal transmitral inflow profile
- The main limitations of performing echocardiography for diastolic dysfunction are the technical difficulties of obtaining the images and getting them at the correct angle.
- If you are significantly off access (>20-30o) with your pulse wave or tissue Doppler sample gates, you may underestimate the values.
- Other limitations of using echocardiography for diastolic dysfunction are:
- Arrhythmias. If there is significant tachycardia you may see fused E and A waves making it difficult to differentiate between the two. Also if the rate is irregular such as in atrial fibrillation you may have differing waveform readings between each beat.
- A prosthetic mitral valve may not give you accurate readings.
- Mitral annular calcification could make e’ measurements unreliable *.
Summary of grading diastolic dysfunction
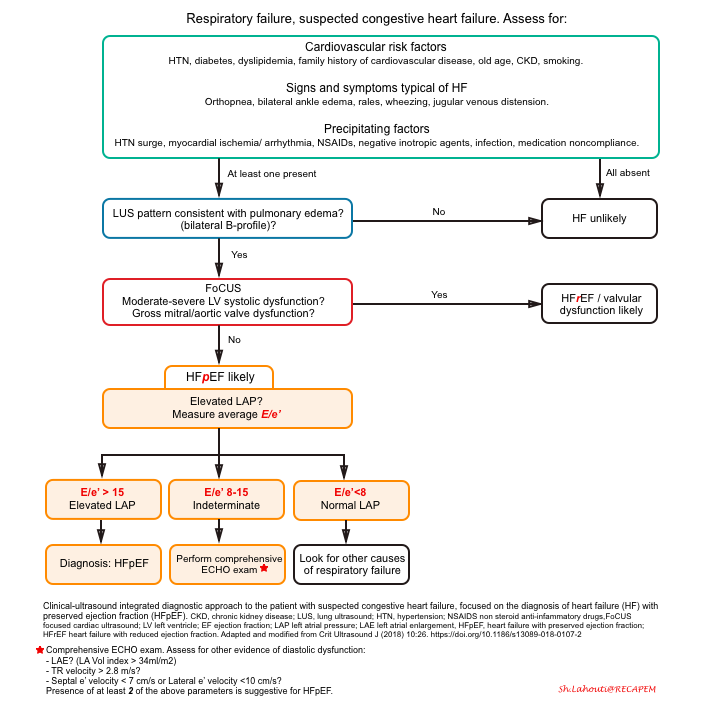
Approach to diagnosis of HFpEF
The diagnostic approach to patients with respiratory failure using a clinically integrated multi-organ ultrasound is shown below.
-
Recent evidence shows that the combination of E/e’ >15 and lung ultrasound findings consistent with pulmonary congestion (diffuse bilateral B-line) has 100% sensitivity and 95.8% specificity in the diagnosis of congestive heart failure, regardless of the ejection fraction *.
A sequential, systematic, ultrasound approach in diagnosis of HFpEF should involve:
- Lung ultrasound (LUS) to diagnose pulmonary congestion * ,*, *
- Absence of diffuse bilateral B-line makes diagnosis of cardiogenic pulmonary edema unlikely.
- Focused cardiac exam (FoCUS) to rule out left ventricular systolic dysfunction, gross aortic/mitral valve abnormalities, pure volume overload as potential causes of pulmonary edema *.
- Mitral inflow and Tissue Doppler measurements to confirm the cardiogenic nature of pulmonary congestion by detecting high LAP *.
The differential diagnosis of hypoxic respiratory failure is broad. However a multi-systemic POCUS can narrow down the differentials.
Lung ultrasound
- Diffuse bilateral B-lines lack specificity and can be seen in multiple conditions such as:
- Cardiogenic pulmonary edema (CPE)
- Non-cardiogenic pulmonary edema (NCPE)
- Pulmonary fibrosis
- Pneumonia, pneumonitis
- Pleural line: In the presence of diffuse bilateral B-line, pleural line thickness and regularity has been suggested as a helpful clue to differentiate the CPE vs. NCPE *.
- In CPE, the pleural line is smooth and regular; whereas in diffuse infectious or inflammatory process, the pleural line is thickened (>2mm) and irregular.
- Caveat: There’s no standardized approach to assessment of pleural line thickness and this is often subjective with poor interoprator reliability.
LV ejection fraction
- Although a reduced EF in the setting of acute heart failure signs and symptoms facilitates the diagnosis of acute heart failure, the absence of a reduced EF does not rule it out.
- Nearly 50 % of patients with heart failure have a preserved EF *. Therefore, knowledge of the EF itself does not significantly alter acute management in the ER setting.
Diastology
- In such this cases, evaluation of diastolic function is extremely helpful.
- In this patient, the diastolic profile revealed abnormal Septal Tissue Doppler with an average E/e′ above 18 as well as an enlarged left atrium.
- These findings are suggestive for cardiogenic pulmonary edema.
Other practical use of diastology
Hemodynamic assessment
- Assessing preload prior to and during IV fluid administration (e.g. in septic shock patients).
- Volume assessment can involve evaluation of diastolic dysfunction , pulmonary congestion status, and end-organ venous congestion (liver, gut, kidneys). More on this here.
- Knowing the left-sided filling pressures in the patients prior to fluid administration can give you a sense of how much volume you think a patient can handle prior to a large amount of IV fluids.
- In patients with normal diastolic function, a more aggressive fluid approach may be considered.
- In patients with diastolic dysfunction at the beginning of the resuscitation, a more conservative approach to fluid management is reasonable.
- Evaluation of adequate diuresis in the management of patients with congestive heart failure.
- Diastology allows you to set your diuresis goal and monitor the patient response in real time!
- For example, if a patient normally lives in Grade 1 diastolic dysfunction at baseline and they currently have Grade 2 diastolic dysfunction in your emergency department, your goal should not be to diuresis them to Grade 0, because they don’t live there. Instead have a diuresis goal to get your patient back to Grade 1 diastolic dysfunction *.
- Diastology allows you to set your diuresis goal and monitor the patient response in real time!
Differentiating ARDS from cardiogenic pulmonary edema
- The diagnosis of ARDS requires that the pulmonary findings are NOT due to a cardiogenic cause (LVEDP or PCWP < 18mm Hg). In the presence of respiratory signs and symptoms and bilateral B-lines, measuring E/e’ ratio is helpful:
- An E/e’ ratio <8: is highly suggestive for ARDS
- E/e’ ratio of >15: is strongly suggestive for cardiogenic pulmonary edema.
Pearls & Pitfalls
1# Not all patients with diastolic dysfunction are symptomatic!
- Diastolic dysfunction is an echocardiographic diagnosis.
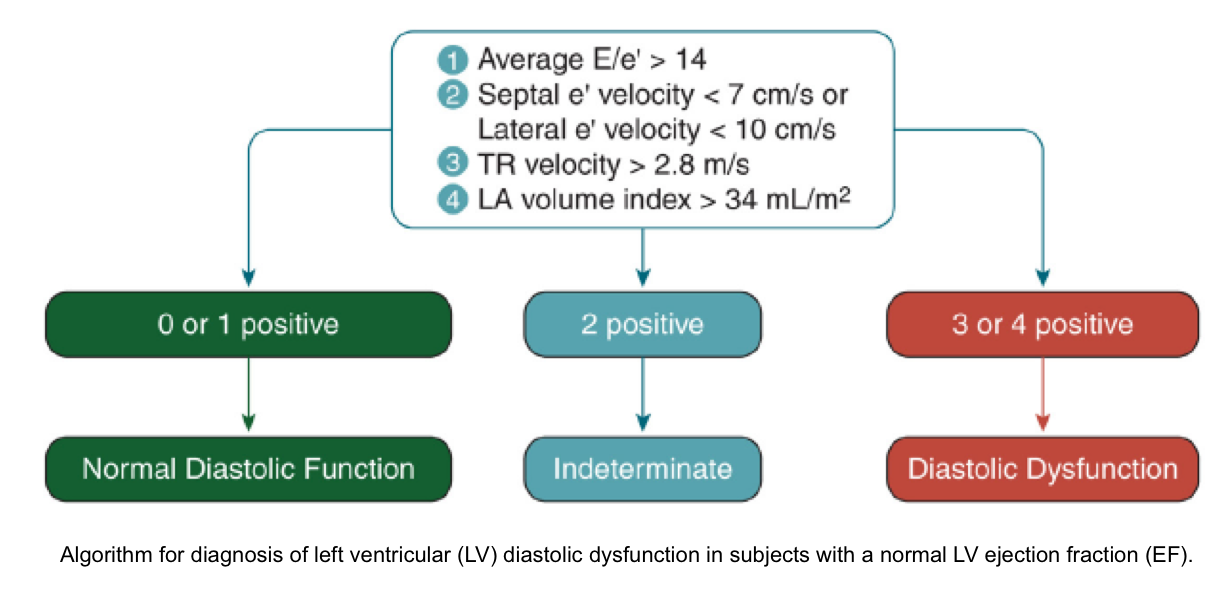
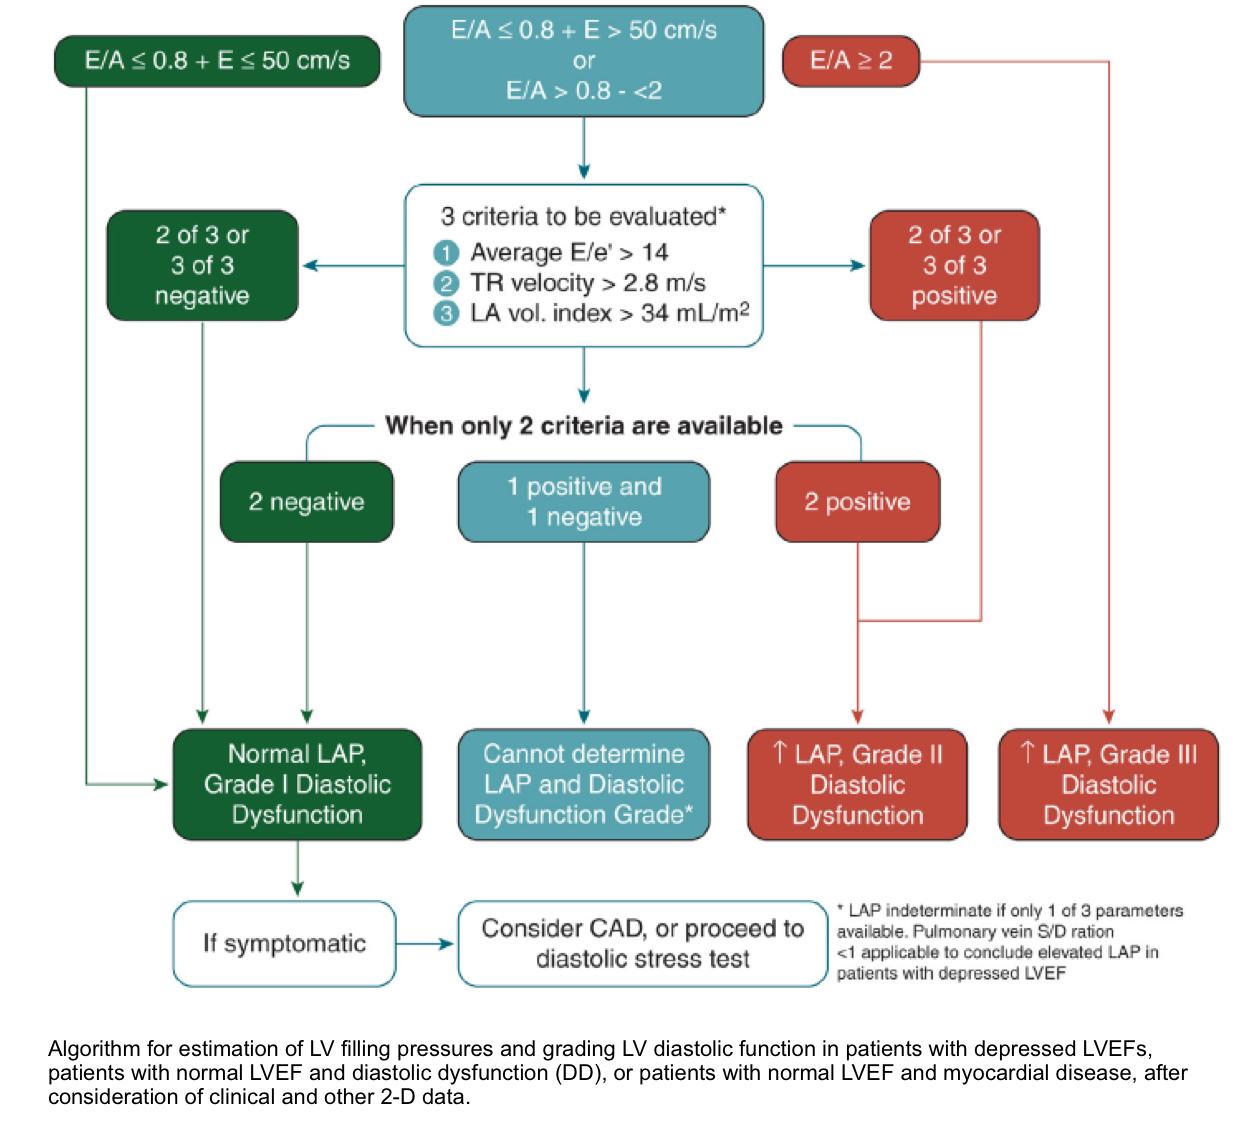
- See ASE recommendation for evaluation and diagnosis of diastolic dysfunction (appendix 1, and 2)
- HF is a clinical syndrome characterized by typical signs and symptoms (e.g. dyspnea, pedal edema, pulmonary crackles, etc.). The diagnosis of HFpEF requires the following conditions to be fulfilled:
- The presence of symptoms and/or signs of HF; and
- A preserved EF (defined as LVEF ≥50%); and
- Elevated levels of natriuretic peptide; and
- At least one additional criterion should be met
- Relevant structural heart disease (LVH and/or LAE)
- Diastolic dysfunction
2# In moderate-severe diastolic dysfunction, LVEDP is increased (due to impaired relaxation and compliance). Echocardiographic findings that indirectly suggest elevated LVEDP are:
- ↑LAP
- LAP is a dynamic variable. It can be changed with loading conditions (preload) that affect the transmitral pressure gradient *.
- ↑E/e’ suggest elevated LAP at the moment.
- ↑LAP is essential for diagnosis of CPE.
- Left atrial enlargement (LAE)
- Presence of LAE signifies chronic LVEDP elevation. Therefore, it gives you an estimate of mean LAP over time ⏳(in the absence of atrial fibrillation *).
- ↑Pulmonary arterial pressure (PAP)
Appendix 1
Appendix 2
Media
Further going
References
1. Nagueh SF. Left Ventricular Diastolic Function: Understanding Pathophysiology, Diagnosis, and Prognosis With Echocardiography. JACC Cardiovasc Imaging. 2020 Jan;13(1 Pt 2):228-244. doi: 10.1016/j.jcmg.2018.10.038. Epub 2019 Apr 12.
2. Benjamin EJ, Virani SS, Callaway CW, Chamberlain AM, Chang AR, Cheng S, Chiuve SE, Cushman M, Delling FN, Deo R, de Ferranti SD, Ferguson JF, Fornage M, Gillespie C, Isasi CR, Jiménez MC, Jordan LC, Judd SE, Lackland D, Lichtman JH, Lisabeth L, Liu S, Longenecker CT, Lutsey PL, Mackey JS, Matchar DB, Matsushita K, Mussolino ME, Nasir K, O’Flaherty M, Palaniappan LP, Pandey A, Pandey DK, Reeves MJ, Ritchey MD, Rodriguez CJ, Roth GA, Rosamond WD, Sampson UKA, Satou GM, Shah SH, Spartano NL, Tirschwell DL, Tsao CW, Voeks JH, Willey JZ, Wilkins JT, Wu JH, Alger HM, Wong SS, Muntner P; American Heart Association Council on Epidemiology and Prevention Statistics Committee and Stroke Statistics Subcommittee. Heart Disease and Stroke Statistics-2018 Update: A Report From the American Heart Association. Circulation. 2018 Mar 20;137(12):e67-e492. doi: 10.1161/CIR.0000000000000558. Epub 2018 Jan 31. Erratum in: Circulation. 2018 Mar 20;137(12 ):e493.
3. Patel RB, Vaduganathan M, Rikhi A, Chakraborty H, Greene SJ, Hernandez AF, Felker GM, Redfield MM, Butler J, Shah SJ. History of Atrial Fibrillation and Trajectory of Decongestion in Acute Heart Failure. JACC Heart Fail. 2019 Jan;7(1):47-55. doi: 10.1016/j.jchf.2018.09.008. Epub 2018 Nov 5.
4. Taqueti VR, Solomon SD, Shah AM, Desai AS, Groarke JD, Osborne MT, Hainer J, Bibbo CF, Dorbala S, Blankstein R, Di Carli MF. Coronary microvascular dysfunction and future risk of heart failure with preserved ejection fraction. Eur Heart J. 2018 Mar 7;39(10):840-849. doi: 10.1093/eurheartj/ehx721.
5. Authors/Task Force members, Elliott PM, Anastasakis A, Borger MA, Borggrefe M, Cecchi F, Charron P, Hagege AA, Lafont A, Limongelli G, Mahrholdt H, McKenna WJ, Mogensen J, Nihoyannopoulos P, Nistri S, Pieper PG, Pieske B, Rapezzi C, Rutten FH, Tillmanns C, Watkins H. 2014 ESC Guidelines on diagnosis and management of hypertrophic cardiomyopathy: the Task Force for the Diagnosis and Management of Hypertrophic Cardiomyopathy of the European Society of Cardiology (ESC). Eur Heart J. 2014 Oct 14;35(39):2733-79. doi: 10.1093/eurheartj/ehu284. Epub 2014 Aug 29.
6. Ponikowski P, Voors AA, Anker SD, Bueno H, Cleland JGF, Coats AJS, Falk V, González-Juanatey JR, Harjola VP, Jankowska EA, Jessup M, Linde C, Nihoyannopoulos P, Parissis JT, Pieske B, Riley JP, Rosano GMC, Ruilope LM, Ruschitzka F, Rutten FH, van der Meer P; ESC Scientific Document Group. 2016 ESC Guidelines for the diagnosis and treatment of acute and chronic heart failure: The Task Force for the diagnosis and treatment of acute and chronic heart failure of the European Society of Cardiology (ESC)Developed with the special contribution of the Heart Failure Association (HFA) of the ESC. Eur Heart J. 2016 Jul 14;37(27):2129-2200. doi: 10.1093/eurheartj/ehw128. Epub 2016 May 20. Erratum in: Eur Heart J. 2016 Dec 30.
7. Sanfilippo F, Scolletta S, Morelli A, Vieillard-Baron A. Practical approach to diastolic dysfunction in light of the new guidelines and clinical applications in the operating room and in the intensive care. Ann Intensive Care. 2018 Oct 29;8(1):100. doi: 10.1186/s13613-018-0447-x. Erratum in: Ann Intensive Care. 2018 Nov 6;8(1):106.
8. Nagueh SF, Middleton KJ, Kopelen HA, Zoghbi WA, Quiñones MA. Doppler tissue imaging: a noninvasive technique for evaluation of left ventricular relaxation and estimation of filling pressures. J Am Coll Cardiol. 1997 Nov 15;30(6):1527-33. doi: 10.1016/s0735-1097(97)00344-6.
9. Nagueh SF, Smiseth OA, Appleton CP, Byrd BF 3rd, Dokainish H, Edvardsen T, Flachskampf FA, Gillebert TC, Klein AL, Lancellotti P, Marino P, Oh JK, Popescu BA, Waggoner AD. Recommendations for the Evaluation of Left Ventricular Diastolic Function by Echocardiography: An Update from the American Society of Echocardiography and the European Association of Cardiovascular Imaging. J Am Soc Echocardiogr. 2016 Apr;29(4):277-314. doi: 10.1016/j.echo.2016.01.011.
10. Öhman J, Harjola VP, Karjalainen P, Lassus J. Rapid cardiothoracic ultrasound protocol for diagnosis of acute heart failure in the emergency department. Eur J Emerg Med. 2019 Apr;26(2):112-117. doi: 10.1097/MEJ.0000000000000499.
11. Picano E, Pellikka PA. Ultrasound of extravascular lung water: a new standard for pulmonary congestion. Eur Heart J. 2016 Jul 14;37(27):2097-104. doi: 10.1093/eurheartj/ehw164. Epub 2016 May 12.
12. Volpicelli G, Skurzak S, Boero E, Carpinteri G, Tengattini M, Stefanone V, Luberto L, Anile A, Cerutti E, Radeschi G, Frascisco MF. Lung ultrasound predicts well extravascular lung water but is of limited usefulness in the prediction of wedge pressure. Anesthesiology. 2014 Aug;121(2):320-7. doi: 10.1097/ALN.0000000000000300.
13. Lichtenstein DA, Mezière GA. Relevance of lung ultrasound in the diagnosis of acute respiratory failure: the BLUE protocol. Chest. 2008 Jul;134(1):117-25. doi: 10.1378/chest.07-2800. Epub 2008 Apr 10. Erratum in: Chest. 2013 Aug;144(2):721.
14. Via G, Hussain A, Wells M, Reardon R, ElBarbary M, Noble VE, Tsung JW, Neskovic AN, Price S, Oren-Grinberg A, Liteplo A, Cordioli R, Naqvi N, Rola P, Poelaert J, Guliĉ TG, Sloth E, Labovitz A, Kimura B, Breitkreutz R, Masani N, Bowra J, Talmor D, Guarracino F, Goudie A, Xiaoting W, Chawla R, Galderisi M, Blaivas M, Petrovic T, Storti E, Neri L, Melniker L; International Liaison Committee on Focused Cardiac UltraSound (ILC-FoCUS); International Conference on Focused Cardiac UltraSound (IC-FoCUS). International evidence-based recommendations for focused cardiac ultrasound. J Am Soc Echocardiogr. 2014 Jul;27(7):683.e1-683.e33. doi: 10.1016/j.echo.2014.05.001.
15. Ponikowski P, Voors AA, Anker SD, Bueno H, Cleland JGF, Coats AJS, Falk V, González-Juanatey JR, Harjola VP, Jankowska EA, Jessup M, Linde C, Nihoyannopoulos P, Parissis JT, Pieske B, Riley JP, Rosano GMC, Ruilope LM, Ruschitzka F, Rutten FH, van der Meer P; ESC Scientific Document Group. 2016 ESC Guidelines for the diagnosis and treatment of acute and chronic heart failure: The Task Force for the diagnosis and treatment of acute and chronic heart failure of the European Society of Cardiology (ESC)Developed with the special contribution of the Heart Failure Association (HFA) of the ESC. Eur Heart J. 2016 Jul 14;37(27):2129-2200. doi: 10.1093/eurheartj/ehw128. Epub 2016 May 20. Erratum in: Eur Heart J. 2016 Dec 30.
16. Reddy YNV, Carter RE, Obokata M, Redfield MM, Borlaug BA. A Simple, Evidence-Based Approach to Help Guide Diagnosis of Heart Failure With Preserved Ejection Fraction. Circulation. 2018 Aug 28;138(9):861-870. doi: 10.1161/CIRCULATIONAHA.118.034646.
17. Soldati G, Demi M, Demi L. Ultrasound patterns of pulmonary edema. Ann Transl Med. 2019 Mar;7(Suppl 1):S16. doi: 10.21037/atm.2019.01.49.
18. Gorter TM, van Veldhuisen DJ, Bauersachs J, Borlaug BA, Celutkiene J, Coats AJS, Crespo-Leiro MG, Guazzi M, Harjola VP, Heymans S, Hill L, Lainscak M, Lam CSP, Lund LH, Lyon AR, Mebazaa A, Mueller C, Paulus WJ, Pieske B, Piepoli MF, Ruschitzka F, Rutten FH, Seferovic PM, Solomon SD, Shah SJ, Triposkiadis F, Wachter R, Tschöpe C, de Boer RA. Right heart dysfunction and failure in heart failure with preserved ejection fraction: mechanisms and management. Position statement on behalf of the Heart Failure Association of the European Society of Cardiology. Eur J Heart Fail. 2018 Jan;20(1):16-37. doi: 10.1002/ejhf.1029. Epub 2017 Oct 16.


Add comment