

 Shahriar Lahouti
11 October 2026, by Shahriar Lahouti.
CONTENTS
- Preface
- Arterial vs. Venous Waveform
- Venous Waveform Framework
- Arterial Waveform Framework
- Going Further
- Media 🎥
- References
Preface
Spectral Doppler interrogation of the venous and arterial systems provides a physiologically grounded means of characterizing hemodynamic state at the bedside, extending beyond the descriptive information afforded by two-dimensional imaging and conventional pressure-based estimates. Venous waveforms are interpreted according to their proximity to the right atrium, since the extent to which a given vein transmits right atrial pressure pulsations determines whether its spectral profile reflects cardiac activity, respiratory modulation, or neither. This framework, formalized in the VExUS protocol, permits graded assessment of systemic venous congestion and its consequences for organ perfusion. Arterial waveforms, by contrast, are interpreted according to the resistance of the distal vascular bed they supply, a principle from which the Resistive Index is derived as a quantitative index of organ perfusion.
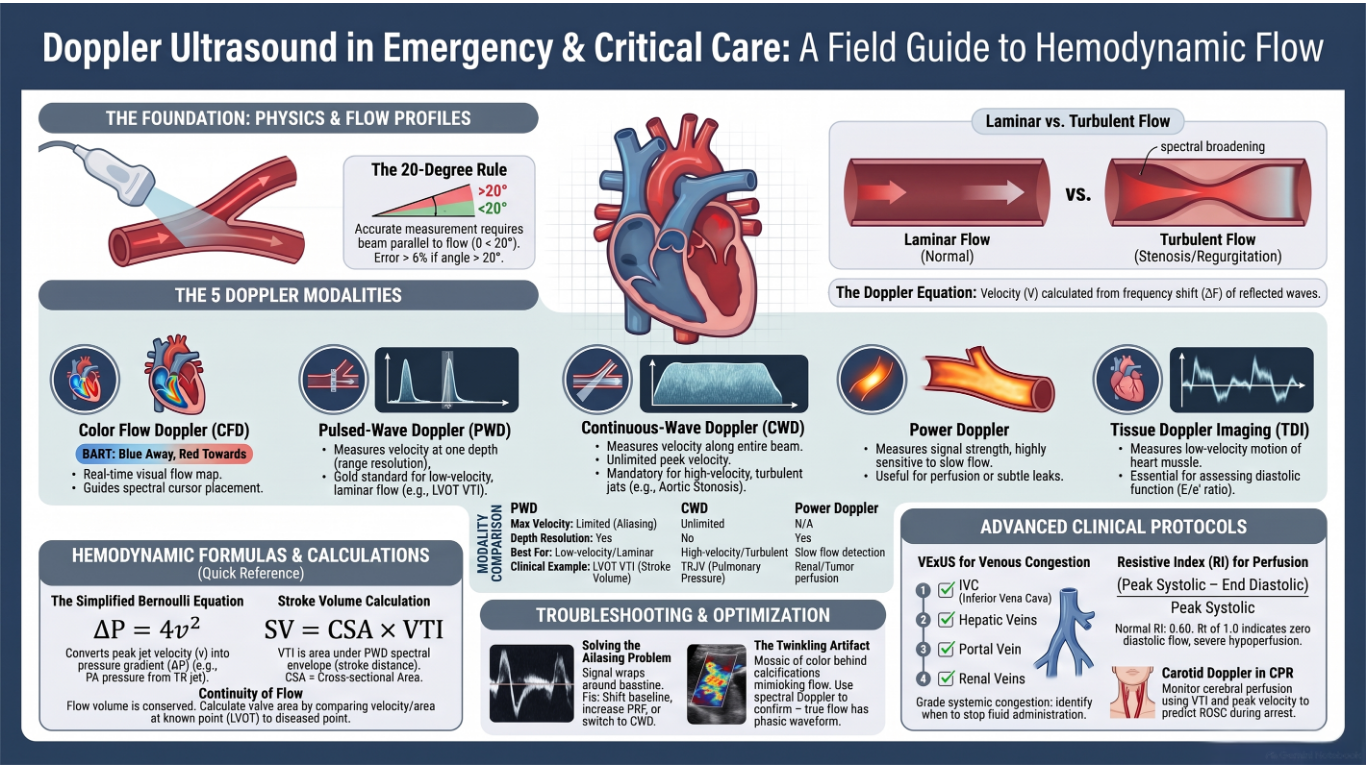
Doppler echocardiography in hemodynamic assessment, which established the broader role of echocardiography in shock, integrates cardiac structure, flow, and derived hemodynamic parameters such as stroke volume, cardiac output, filling pressures, and pulmonary artery pressures into a unified bedside assessment. Because these variables determine hemodynamic status and adequacy of perfusion, echocardiography occupies a central position in the hemodynamic evaluation of the critically ill patients.
Arterial vs. Venous Waveform
Arteries and veins have fundamentally different Doppler signatures because of their different positions in the circulatory system and different pressure environments (see the table below).
Venous Waveform Framework
◾️Veins are capacitance and floppy. Unlike the arteries, they do not intrinsically exhibit a pulsatile waveform on Doppler tracing. A useful framework for understanding the characteristics of spectral waveform patterns of veins is to classify the venous flow into 3 patterns:
- Central veins
- These veins (IVC, IJV, and hepatic vein) are close to the right atrium.
- They have pulsatile waveforms that directly reflect right atrial pressure and cardiac activity, with distinct a, S, v, and D waves.
- Peripheral veins
- These vascular beds (e.g., intra-renal vein and upper/lower limb veins) are more distal to the heart and therefore the tracing will not directly reflect RAP variations.
- Their spectral waveforms appear phasic (respirophasic); they do undulate, but gently. The velocity of the flow is lower relative to the large central veins.
- Veins in between
- These include veins whose waveform does not perfectly match any of the above two, and have unique spectral properties. Examples include the portal vein and splenic vein. Waveform is continuous with mild undulation.
- The portal vein (PV) is part of a distinct venous system that is isolated from central veins by the hepatic sinusoids and from the arterial system by splanchnic capillaries. Therefore, the Doppler waveform of the normal PV will not reflect right atrial pressure variations. Waveform is characteristically continuous (or mildly pulsatile) and above the baseline.
- These include veins whose waveform does not perfectly match any of the above two, and have unique spectral properties. Examples include the portal vein and splenic vein. Waveform is continuous with mild undulation.
- Definition: Quantifies how much flow velocity varies during the cardiac cycle in a vein.
- PF is for veins: It is the key metric in the VExUS protocol for assessing portal vein congestion *
◾️Which Veins show right-sided cardiac activity
- Not all veins display the full S, D, A, V complex. The table below categorizes veins by whether they show these right atrial pressure waves, and to what degree.
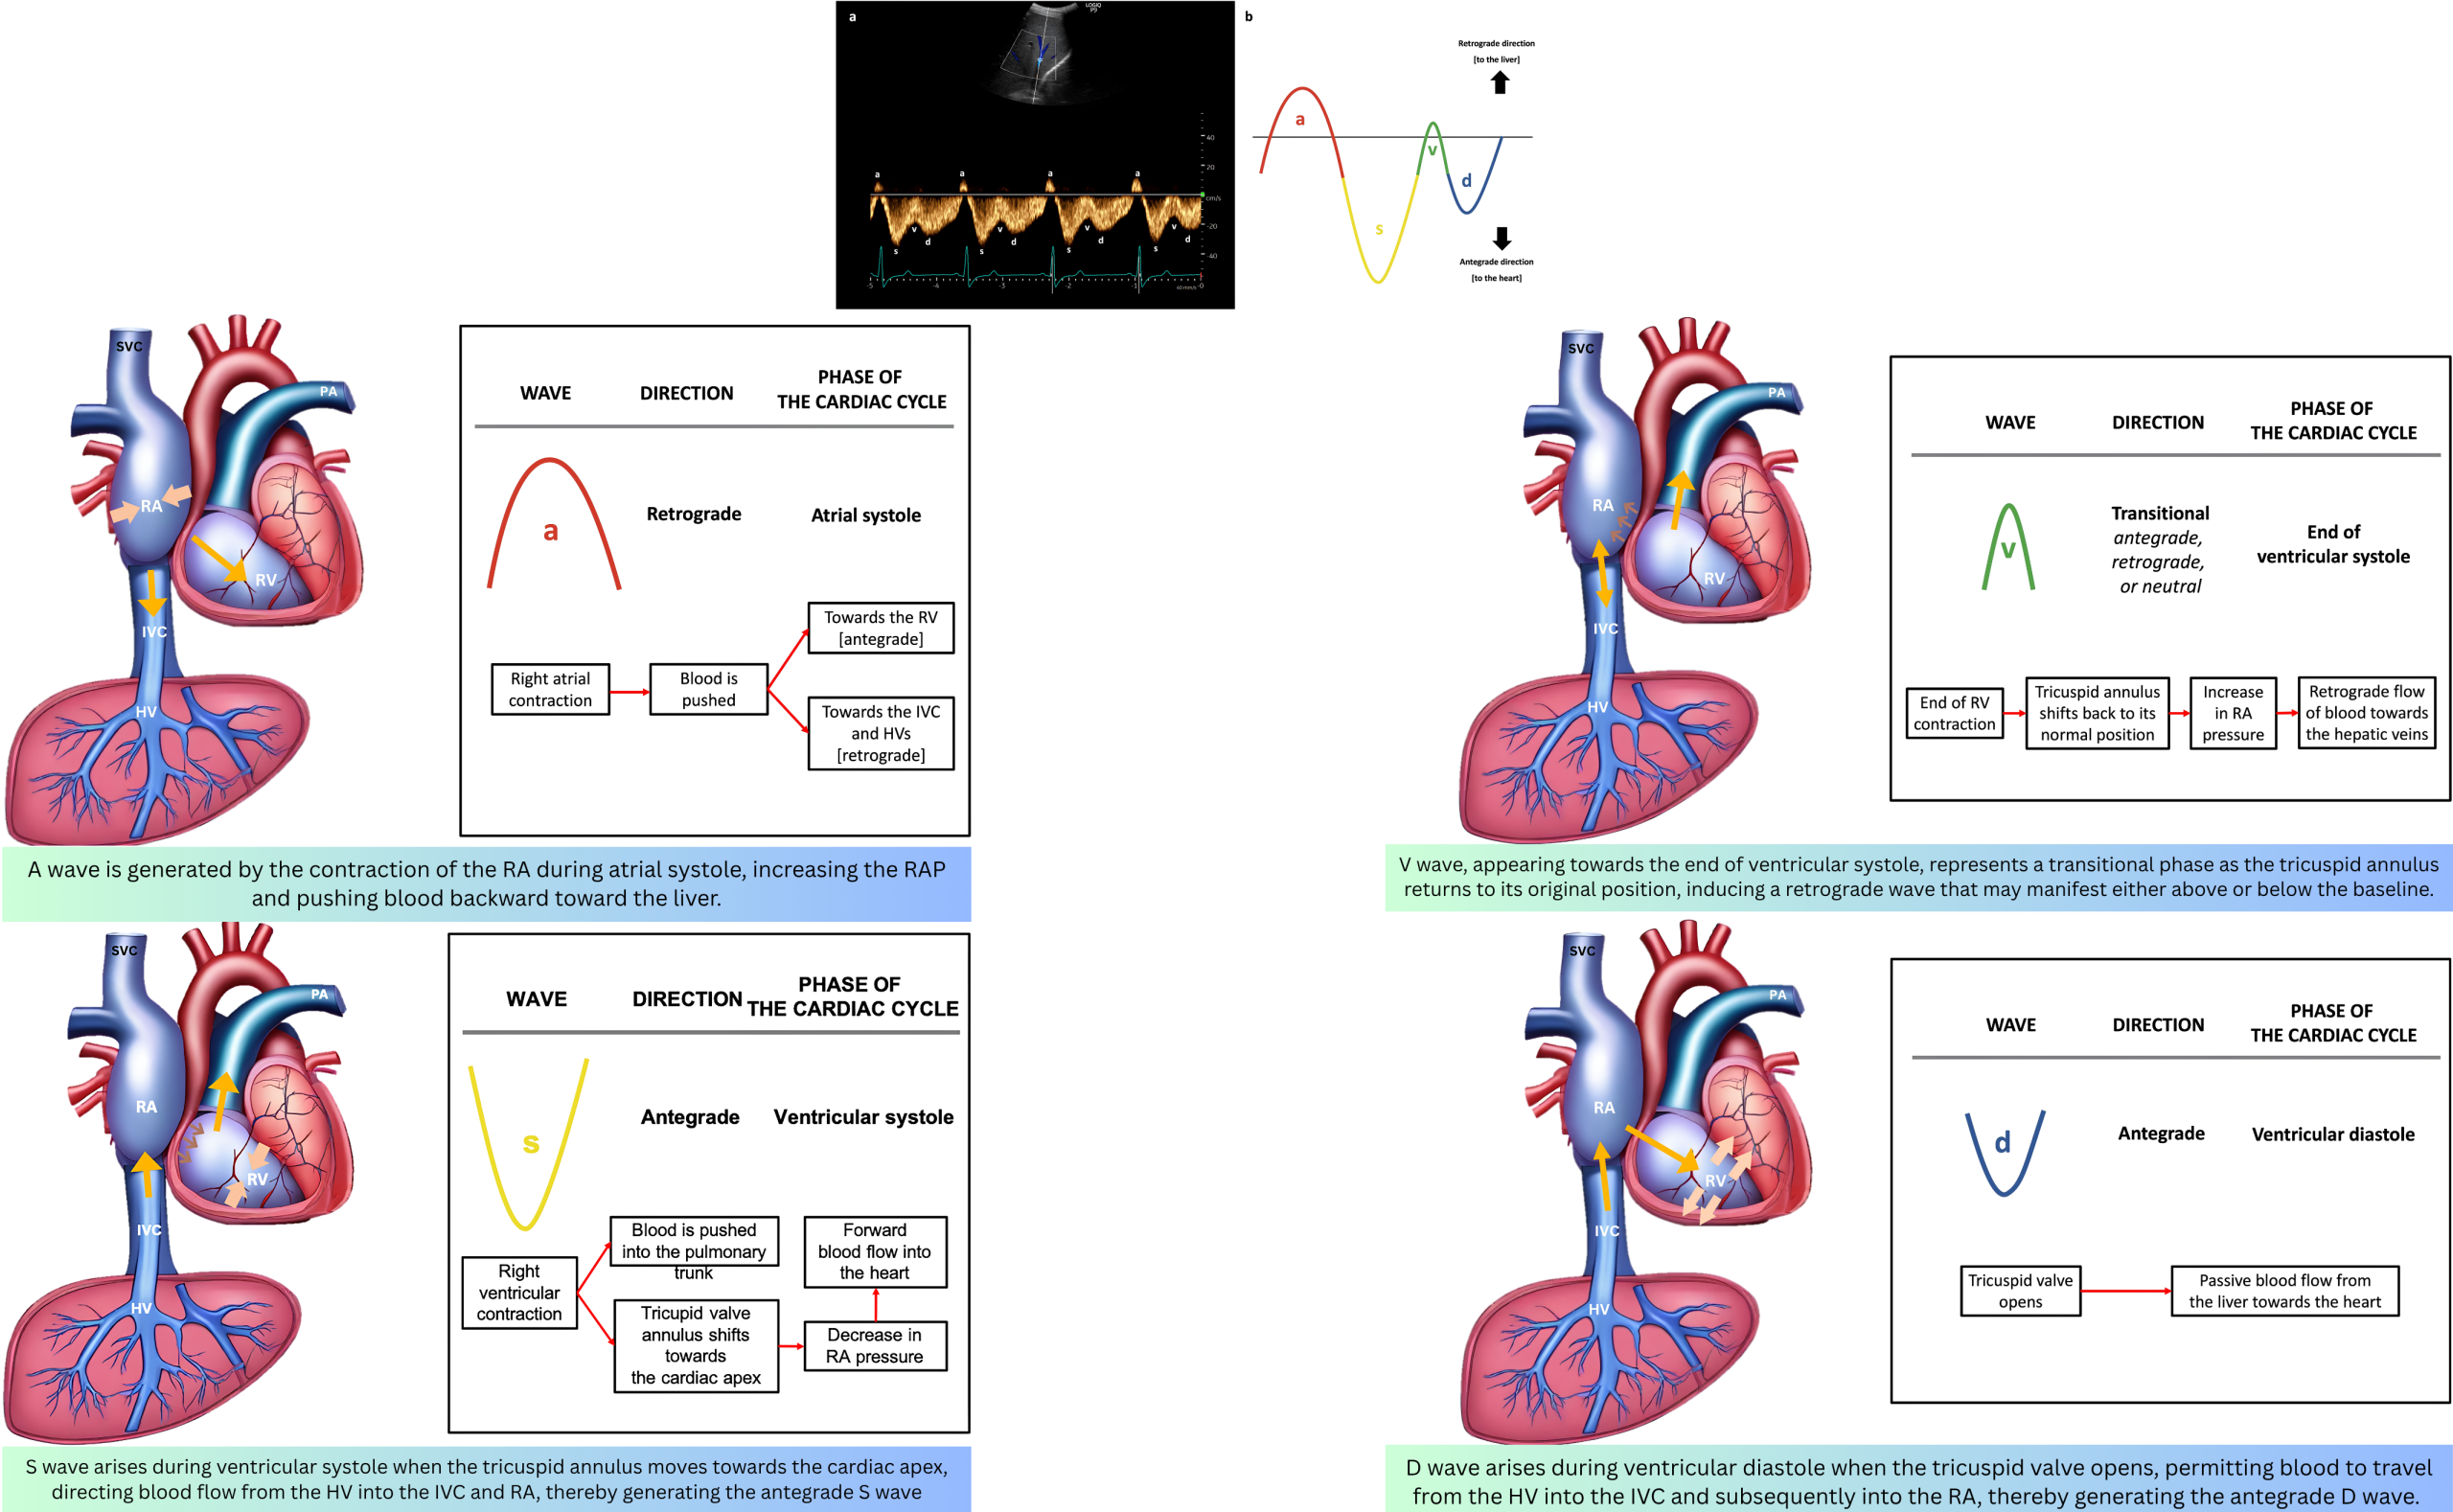
📊Figures: The image below left illustrates a normal Doppler waveform in anatomical regions (see the table here). The image below right displays the hepatic waveform components with corresponding major cardiac events.

Doppler Study of Veins
Doppler study of the venous system is focused on waveform morphology (direction, phasicity, spontaneity) and quantitative measurements (velocities, reflux duration, pulsatility).
◾️Key Venous Doppler Indices
- Flow Direction
- Flow Pattern (Phasicity)
- Spontaneity
- Quantitative Measurements
- Compressibility: Complete collapse with probe pressure confirms patency; noncompressibility suggests thrombus
- Pulsatility Index/Fraction (PI/PF): (Vmax − Vmin) / Vmax; quantifies pulsatility in portal or hepatic veins (normal <30%).
- Peak Reflux Velocity: Retrograde flow velocity; >30 cm/s is associated with incompetent valves.
- Venous Diameter: Vessel caliber; enlarged veins (>7 mm) have a higher incidence of reflux.
🧐 Does the measured velocity differ for a certain vein if taken in long-axis from short-axis view?
- Doppler ultrasound measures only the velocity component parallel to the ultrasound beam. The relationship is described by the Doppler equation, where the measured velocity is directly proportional to the cosine of the angle (θ) between the beam and the flow direction.
- Long-Axis View: The ultrasound beam is typically parallel (or nearly parallel) to the blood vessel and the direction of flow. The angle (θ) is close to 0°, so the cosine is close to 1. This gives you an accurate maximum-velocity measurement.
- The resulting waveform is clear, well-defined, and has good amplitude. You can confidently identify the S, D, and A waves in central veins.
- Short-Axis View: The ultrasound beam is perpendicular to the direction of flow. The angle (θ) is close to 90°, so the cosine is close to 0. In this case, little to no Doppler signal is detected, and the velocity measurement is significantly underestimated or absent.
- The signal you get is weak, noisy, or absent. The waveform will appear blunted, dampened, or completely uninterpretable. You might lose the ability to distinguish the individual S, D, and A waves in central veins.
- Long-Axis View: The ultrasound beam is typically parallel (or nearly parallel) to the blood vessel and the direction of flow. The angle (θ) is close to 0°, so the cosine is close to 1. This gives you an accurate maximum-velocity measurement.
🩺 Clinical Context
- VExUS Protocol: Grades systemic congestion using IVC diameter plus hepatic, portal, and intrarenal vein waveforms
- Normal Peripheral Veins: Larger central veins show spontaneous, low-velocity, respirophasic flow with some cardiac pulsatility; distal veins show less spontaneity
Normal Doppler Indices of Different Veins
The table below summarizes the normal waveform pattern, phasicity, diameter, and flow velocity for the major veins assessed at the bedside. Values are representative and vary with age, body habitus, and technique.
Abnormal Venous Doppler Indices
The table below defines the core terminology used to describe abnormal venous waveform direction, phasicity, spontaneity, and modifier terms, along with their clinical implications.
Abnormal Doppler Pattern of Different Veins
💦Effect of venous congestion on the flow pattern
- Generally, increased right atrial pressure can cause the following changes in the venous waveform pattern:
- Decreased respiratory variation of flow velocity.
- Central veins: (S/D<1).
- Increased RAP hinders systolic venous return to the heart (S wave is dampened). Under such conditions, most venous return to the right atrium occurs during ventricular diastole (D>S). Progressive increases in right atrial pressure eventually cause systolic flow reversal.
- Peripheral veins: Increased pulsatility index
- The same physiologic principles are working here as well. Impaired venous return during systole will change the normal continuous Doppler waveform of peripheral veins into a pulsatile waveform.
🌵What is the impact of hypovolemia on venous flow pattern?
- Both hypovolemia and external compression over adjacent veins will cause the following changes in venous flow pattern:
- Decreased velocity of flow
- Central veins: decreased pulsatility index (PI).
- The normal waveform pulsatility (a, S, v, and d wave) is dampened, contributing to the band-like appearance of the waveform. For example, the tri-phasic appearance of the hepatic vein waveform is changed to a monophasic /dampened waveform in cirrhosis due to external compression of the shrunken fibrous liver on the hepatic vein.
📊Having defined the terminology, the following table maps these abnormalities to specific veins, organized by anatomic region.
Special Application
VExUS Doppler for Venous Congestion
Basic concepts: evaluation of venous congestion
- Conventionally, the assessment of venous congestion has relied upon interrogation of either the inferior vena cava (IVC) or central venous pressure (CVP). This approach represents a reasonable initial step; for instance, a small, collapsible IVC largely excludes the presence of significant venous congestion. Nevertheless, the incorporation of supplementary venous indices may enhance both the confirmation and quantification of congestion severity, thereby refining the overall hemodynamic assessment.
- VExUS (Venous Excess Ultrasound) is a validated, four-step protocol that uses PWD and Color Doppler (Spectral Doppler) to assess systemic venous congestion by interrogating the hepatic vein Doppler, portal vein Doppler, interlobar renal venous flow, and femoral vein flow
VExUS
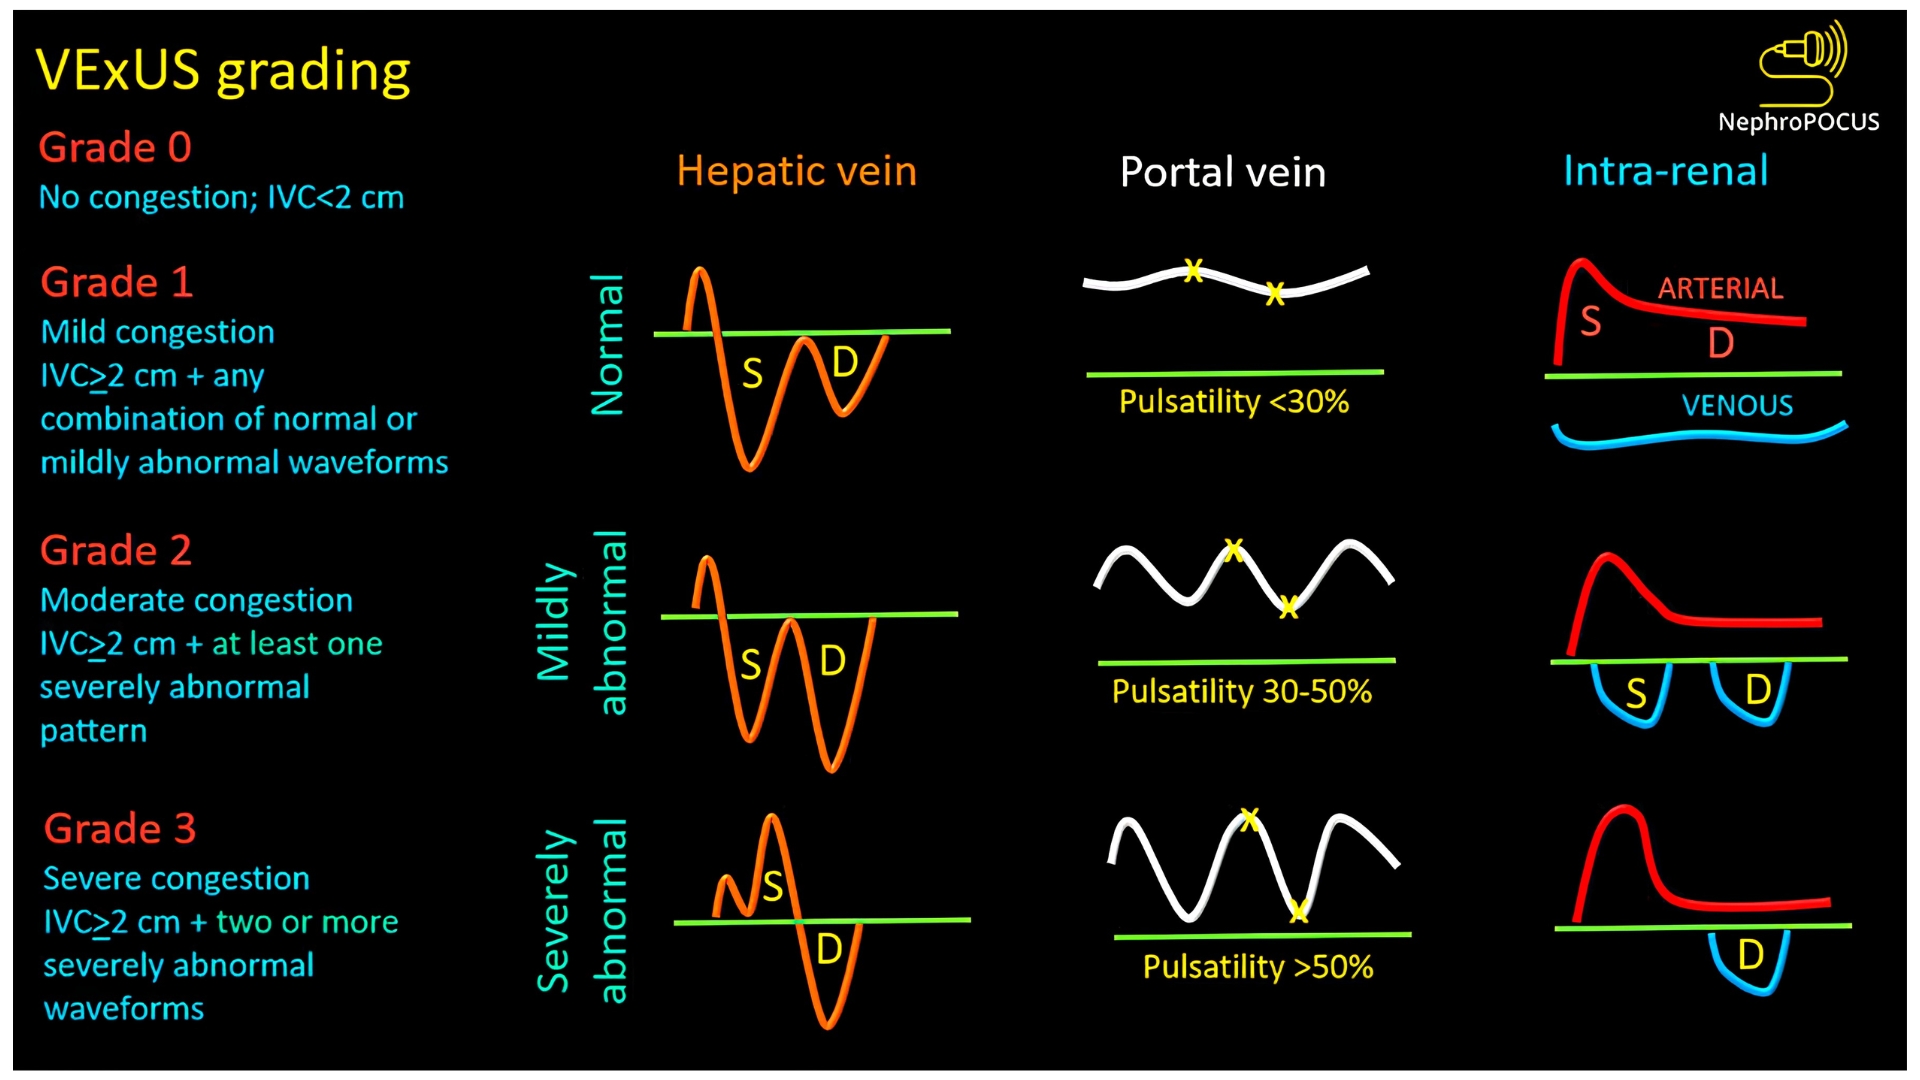
- VExUS (venous excess ultrasound score) is a combination of IVC diameter with hepatic vein Doppler, portal vein Doppler, and interlobar renal venous flow (as shown below).
- VExUS illustrates a general approach to the evaluation of venous congestion:
- Start with the IVC. If the IVC appears normal, congestion is largely excluded.
- If the IVC appears congested, secondary indices may be used to confirm the presence of congestion and grade its severity.

📚Evidentiary basis for VExUS
- VExUS grade 3 has a high sensitivity (~100%) and specificity of 85% for detecting patients with a right atrial pressure >12 mm *.
- VExUS of 2-3 outperforms isolated CVP as a predictor of acute kidney injury risk *.
- VExUS Grade ≥ 2 is strongly associated with major adverse kidney events (MAKE-30) in critically ill patients (OR 4.3, 95% CI 1.2–20.7).
Feasibility of VExUS Assessment
-
Technical Limitations: VExUS components are frequently unobtainable in patients unable to perform breath-holds — renal vein Doppler being particularly challenging, and hepatic vein Doppler often uninterpretable without simultaneous ECG tracing (rarely available on basic ultrasound systems).
-
Alternatives & Clinical Judgment: Interrogation of the IVC, femoral vein, and portal vein may serve as a pragmatic surrogate for VExUS, given their superior technical feasibility. Ultimately, bedside clinical judgment remains essential to evaluate each parameter and determine volume status.
⚠️Pitfalls
The following conditions will often confound the evaluation of venous congestion:
- Elevated intra-abdominal pressure (including pregnancy, Valsalva maneuver, and end-inspiratory breath-hold that may inadvertently cause a Valsalva maneuver).
- IVC pathology (e.g., stenosis, thrombosis).
- Marked respiratory distress with the use of accessory muscles for respiration.
- Cirrhosis (may cause false-negative portal vein pulsatility).
- Severe tricuspid regurgitation *.
- Severe tricuspid regurgitation causes flow reversal in the hepatic vein Doppler. However, flow reversal in the femoral vein seems less common with isolated tricuspid regurgitation (without systemic congestion) *.
- The explanation may be that in the absence of congestion, the IVC is distensible and doesn’t transmit pressures to the femoral vein.
- Severe tricuspid regurgitation causes flow reversal in the hepatic vein Doppler. However, flow reversal in the femoral vein seems less common with isolated tricuspid regurgitation (without systemic congestion) *.
- ⚠️Bottom line: VExUS Interpretation can be confounded by cirrhosis, tricuspid regurgitation, and intra-abdominal hypertension.
🩺 Clinical utility in emergency and critical care
⓵ Interface III (Capillaries → Venules)
-
- VExUS Doppler directly interrogates the venous drainage side of the microcirculation and assesses whether venous congestion is impairing organ perfusion by reducing the arteriovenous gradient.
⓶Venous congestion signifies RV failure; yet it neither elucidates the etiology of RV dysfunction nor dictates its management.
- Congestion could be due to volume or pressure overload among the list.
- VExUS grade does not differentiate volume overload from pressure overload. It quantifies organ congestion irrespective of the cause *.
- Venous congestion does not equate to a diuresis indication.
- Many such patients warrant diuresis; however, others require alternative RV-directed therapies (e.g., pulmonary vasodilators or pericardial drainage for tamponade).
- ⚠️ Clinical Cautions in High VExUS Scores
- Pulmonary hypertension with RV dysfunction:
- Patients with chronic pulmonary hypertension may exhibit persistently elevated VExUS scores; thus, this finding does not invariably mandate aggressive diuresis *.
- Avoid aggressive fluid removal; cardiac output may be preload-dependent; consider pulmonary vasodilators, which can improve VExUS independently of volume status.
- 🎯In chronic pulmonary hypertension, normalizing portal vein pulsatility may represent a more meaningful therapeutic target, since IVC dilation and abnormal hepatic and femoral vein waveforms are typically irreversible*.
- Pericardial effusion with tamponade physiology: Excessive volume removal may precipitate tamponade by reducing intracardiac pressure relative to pericardial constraint; recognize the underlying cause before decongesting.
- Pulmonary hypertension with RV dysfunction:
- 🔎Venous congestion must invariably be interpreted and managed within the framework of global hemodynamic assessment with particular emphasis on RV abnormalities *.
⓷ VExUS assesses venous congestion (if any, fluid tolerance).
- VExUS Assesses Fluid Tolerance: VExUS evaluates the consequences of venous congestion on organs. A high VExUS score indicates that the patient is likely to be harmed by additional fluid.
- Volume Responsiveness Assesses Fluid Efficacy: Volume responsiveness is a dynamic measure that predicts whether a patient's cardiac output will increase (typically by 10-15%) after a fluid challenge. It assesses the heart's position on the Frank-Starling curve, not the state of the venous system
⓸ If the cause of congestion (high-grade VExUS) is found to be volume overload, a decongestion strategy is warranted.
- VExUS grade 3 is not just a marker of congestion; it predicts diuretic failure.
-
- This is why VExUS can guide decongestion: it identifies congested patients who are not responding to standard diuretic doses. These patients may benefit from:
- Higher diuretic doses or continuous infusion
- Combination therapy (e.g., adding a thiazide). More on this👉 here.
- Ultrafiltration when medical therapy fails
- This is why VExUS can guide decongestion: it identifies congested patients who are not responding to standard diuretic doses. These patients may benefit from:
🔎Technical & physiologic pearls and pitfalls
VExUS: Quick Bedside Guide
⚙️ General Setup
- Equipment: Color + PW Doppler; curvilinear probe for renal, phased array for cardiac; ECG module recommended.
- Patient: Supine; bed at operator's waist level.
- Machine: Cardiac/abdominal/FAST preset. Scale ~40 cm/s for IVC/HV/PV; < 20 cm/s for intrarenal vein. Sweep speed 50–66.7 mm/s
🚨How does it work? After confirming IVC dilation (>2 cm), PWD is used to assess three venous beds *
Decoding VExUS
IVC
◾️Technique
- Probe 1–2 cm below xiphoid; marker at 3 o'clock (short axis) → rotate to 12 o'clock (long axis).
- Ideally, examine both short- and long-axis views. The short axis is preferred to avoid being confused by an oblong IVC.
- Use B-mode, not M-mode.
- ⚠️M-mode examination of the IVC is easily confounded by respiratory effort, which causes the IVC to move in and out of the ultrasound plane. M-mode adds little useful information beyond a careful examination of the longitudinal and short axis of the IVC.)
◾️Measure
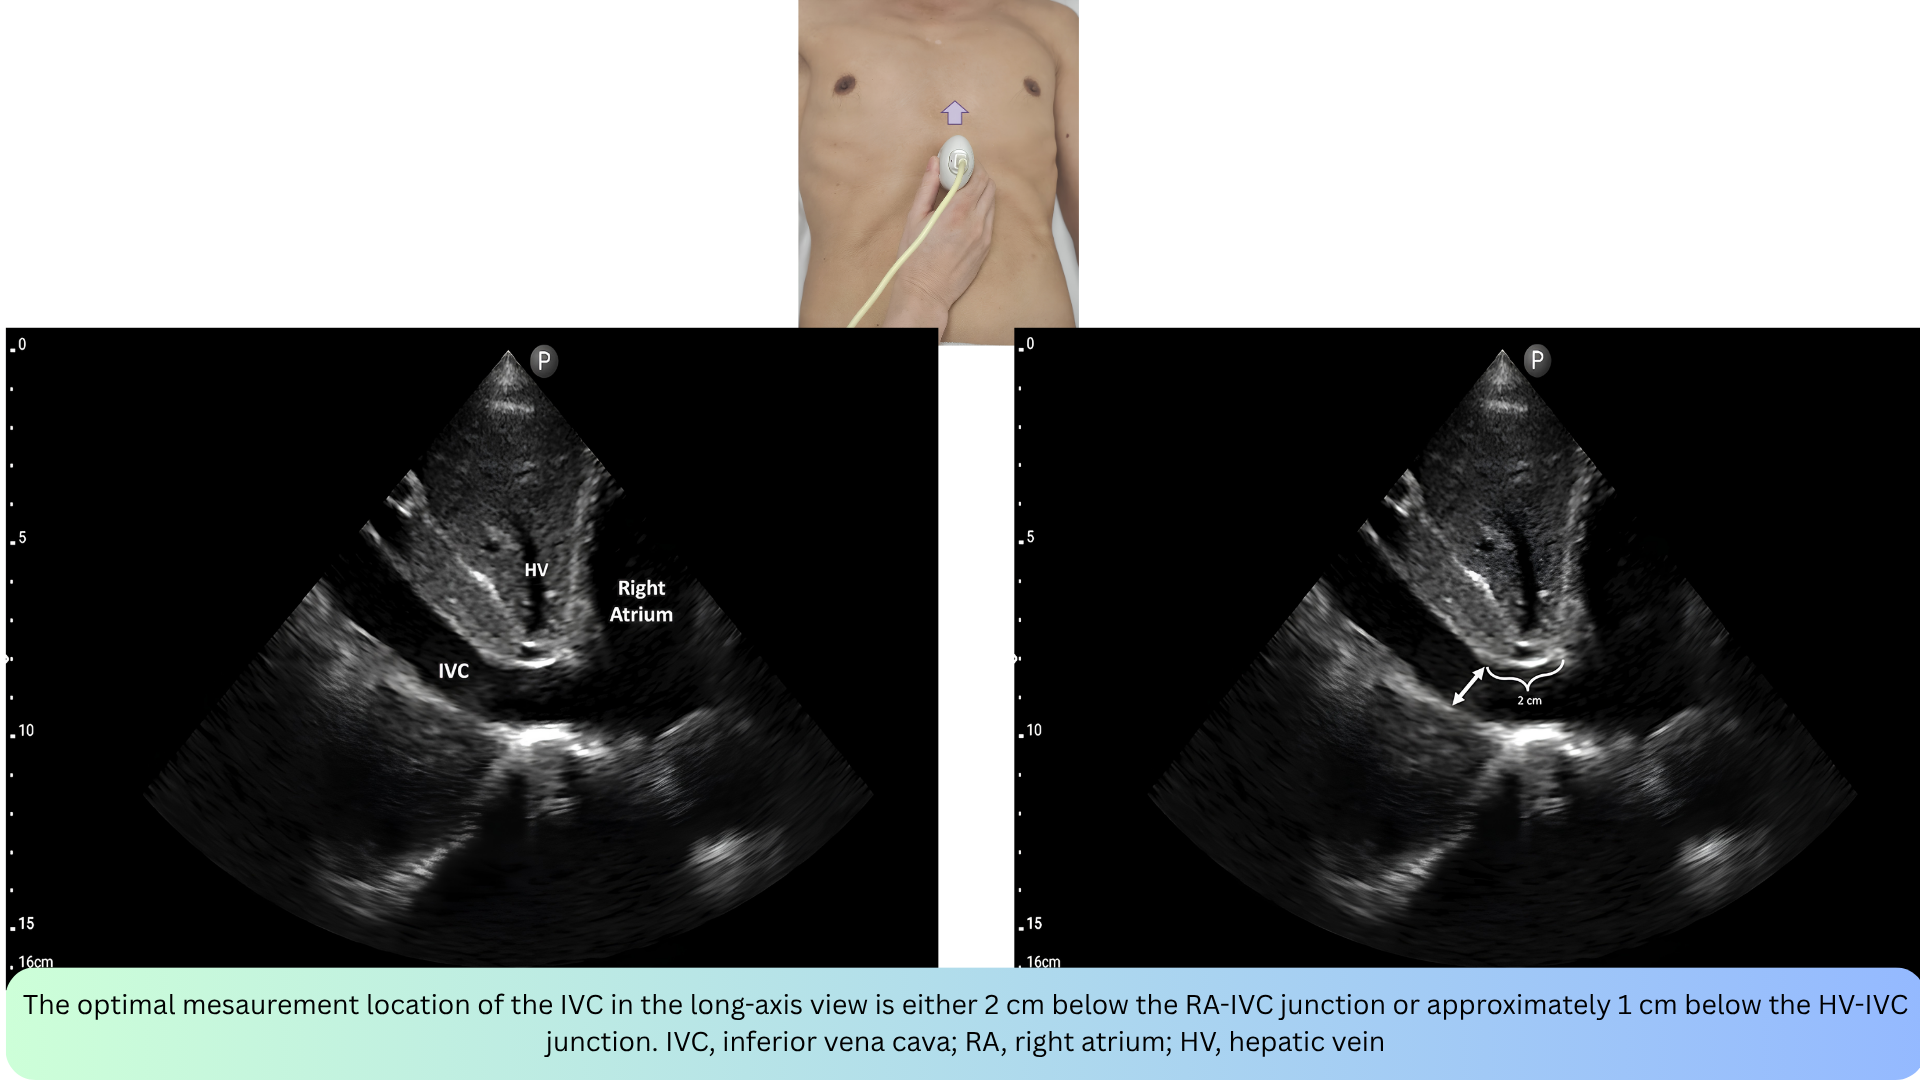
- Maximal diameter 2 cm below RA-IVC junction or 1 cm below HV-IVC junction.
🩺 Interpretation
- Normal IVC diameter is <2 cm with respirophasic variation. If seen, a normal IVC excludes systemic congestion (so the remainder of the VExUS scan is unnecessary).
- IVC diameter >2 cm suggests elevated CVP, especially if respirophasic variation is lacking.
- A circular vessel (rather than an elliptical shape) usually indicates elevated CVP *.
✴️ Advantage:
- Quick initial screen; short-axis view may correlate better with CVP.
⚠️ Pitfalls
- Athletes may have IVC dilation without elevated right atrial pressure *.
- Elevated intra-abdominal pressure may cause IVC collapse (despite elevated right atrial pressure) *.
- Lower body surface area may correlate with a lower cutoff value (e.g., ~1.7 cm) *.
Hepatic vein
◾️Technique:
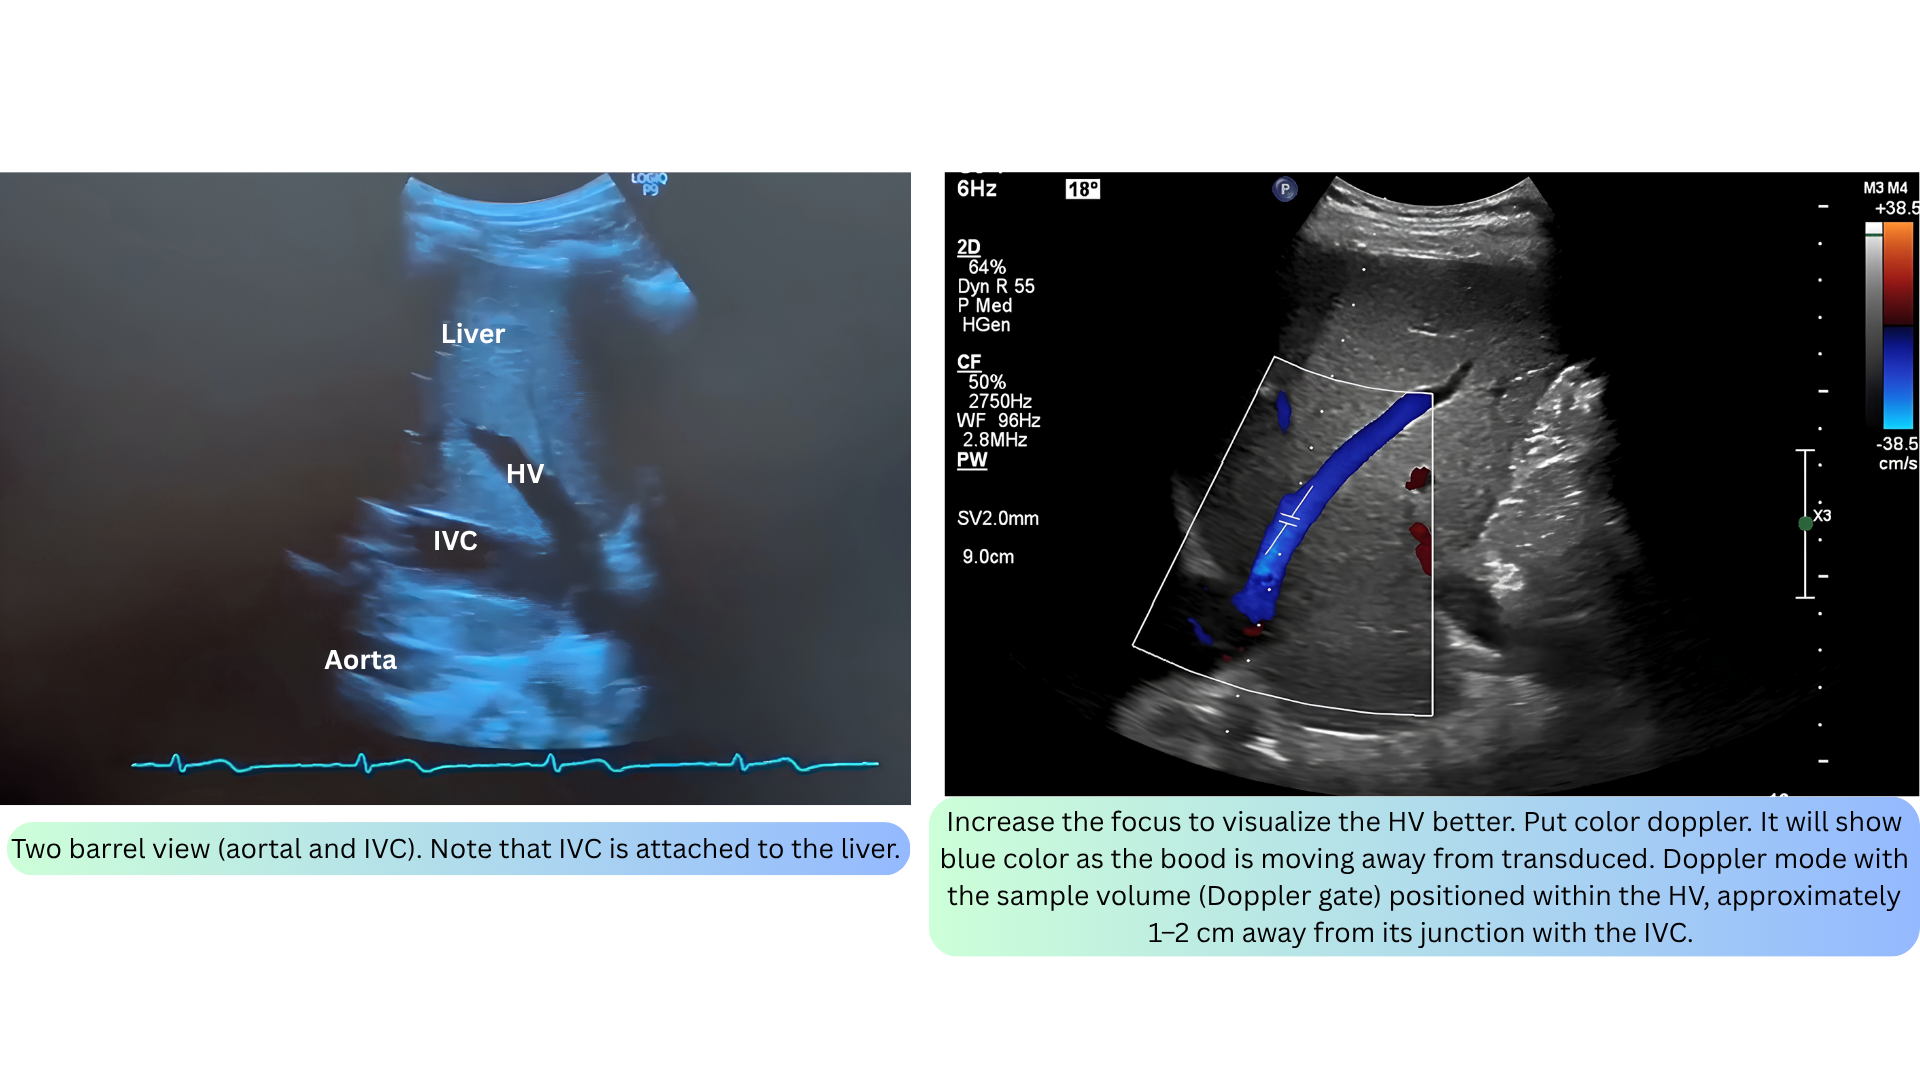
- Long-axis view at mid-axillary line; PWD sample 1–2 cm above the IVC junction into the vein; breath-hold at end-expiration.
- Any of the three hepatic veins (right, middle, left) can be sampled based on ease of access.
🩺Interpretation
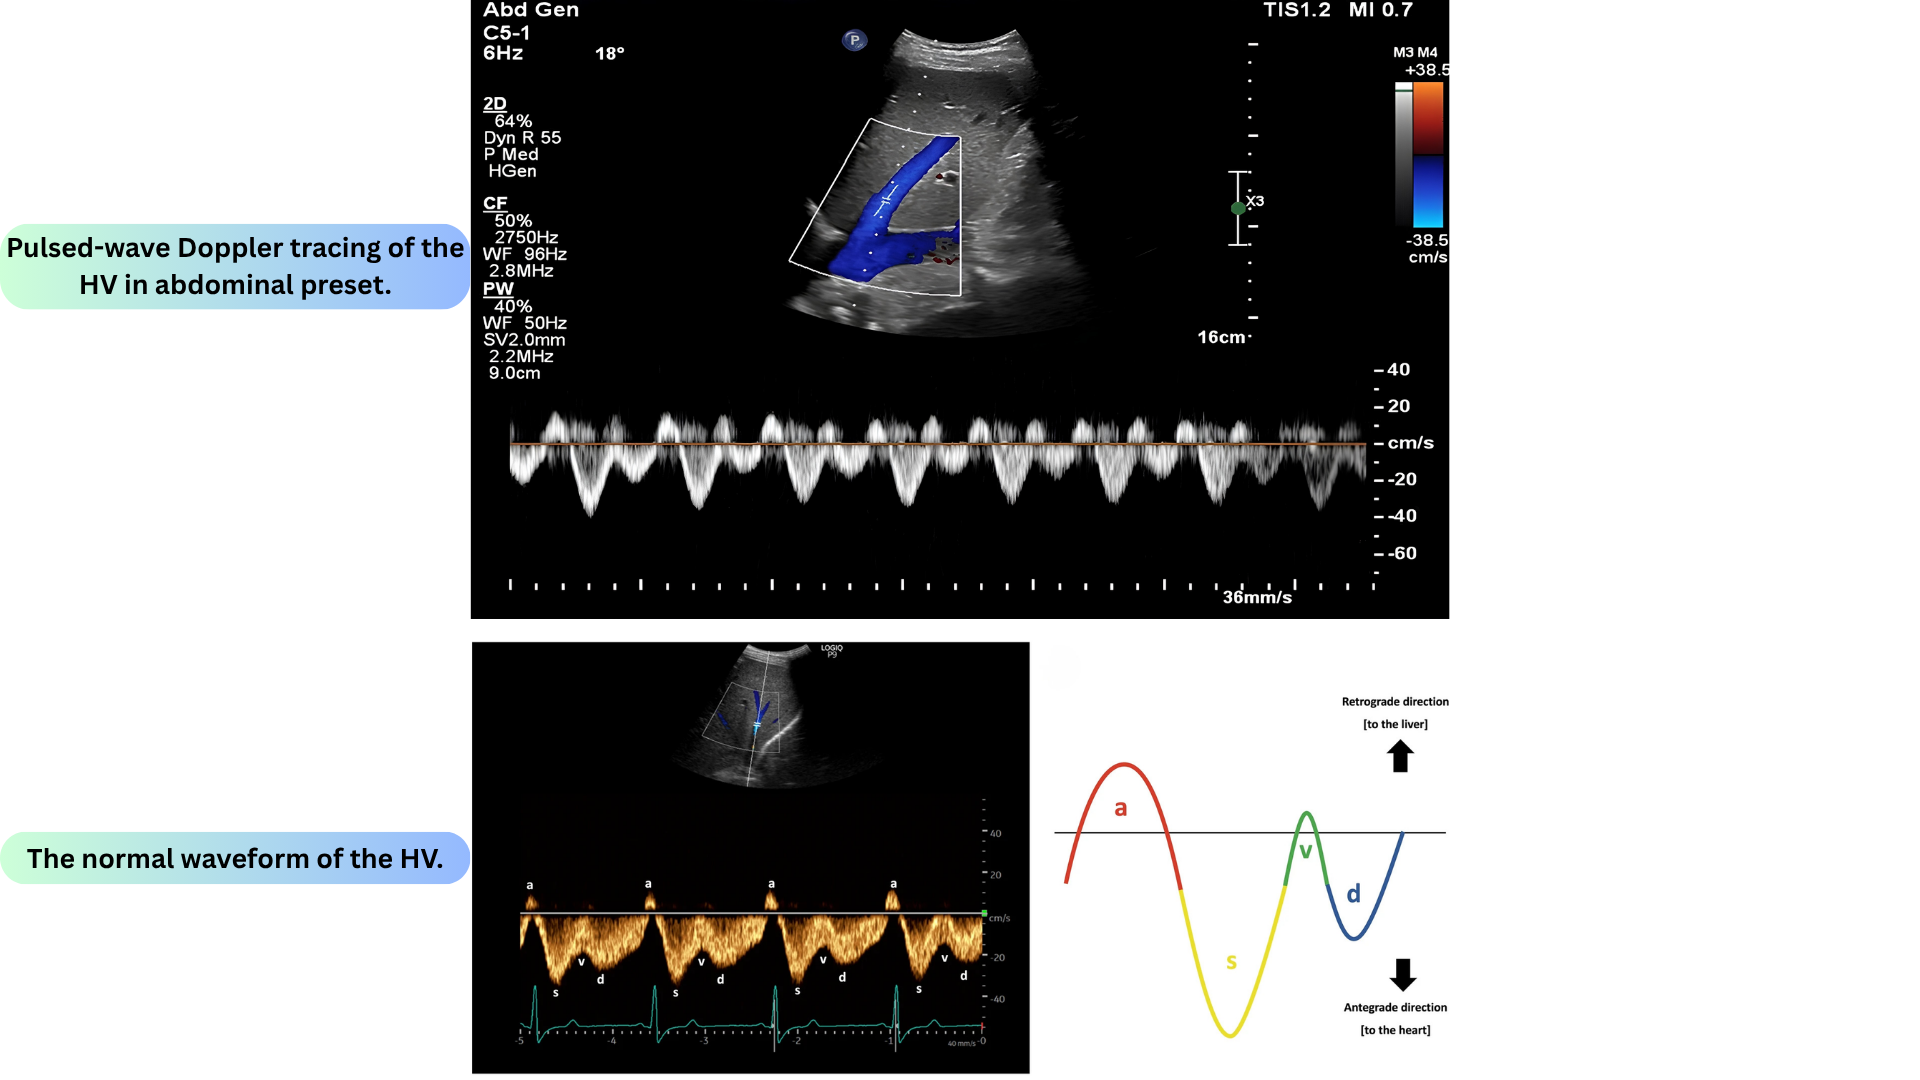
- Normal waveform:
- A-wave: Small retrograde wave due to atrial contraction (immediately after P-wave on ECG).
- S-wave: Occurs during systole, as the downward motion of the tricuspid annulus sucks blood into the atrium (immediately after the R-wave on ECG) *. Greater tricuspid annulus excursion may correlate with a larger S-wave, so a large S-wave may reflect a healthy RV.
- V-wave: may sometimes be seen due to the tricuspid annulus moving back upwards to its normal position (which increases the RA pressure) *. Normally, the V-wave may be above or below the baseline *.
- D-wave: occurs during diastole due to blood flow through the tricuspid valve (immediately after the T-wave on ECG). Normally, the D-wave is smaller than the S-wave.
- Normal size and velocity:
- Normal size < 10 mm.
- Shows two antegrade waves (S and D) below the baseline and two retrograde waves (A and V) above it. The S wave should be taller than the D wave.
- Normal peak flow velocity: 0.24 - 0.29 m/s
- Abnormal:
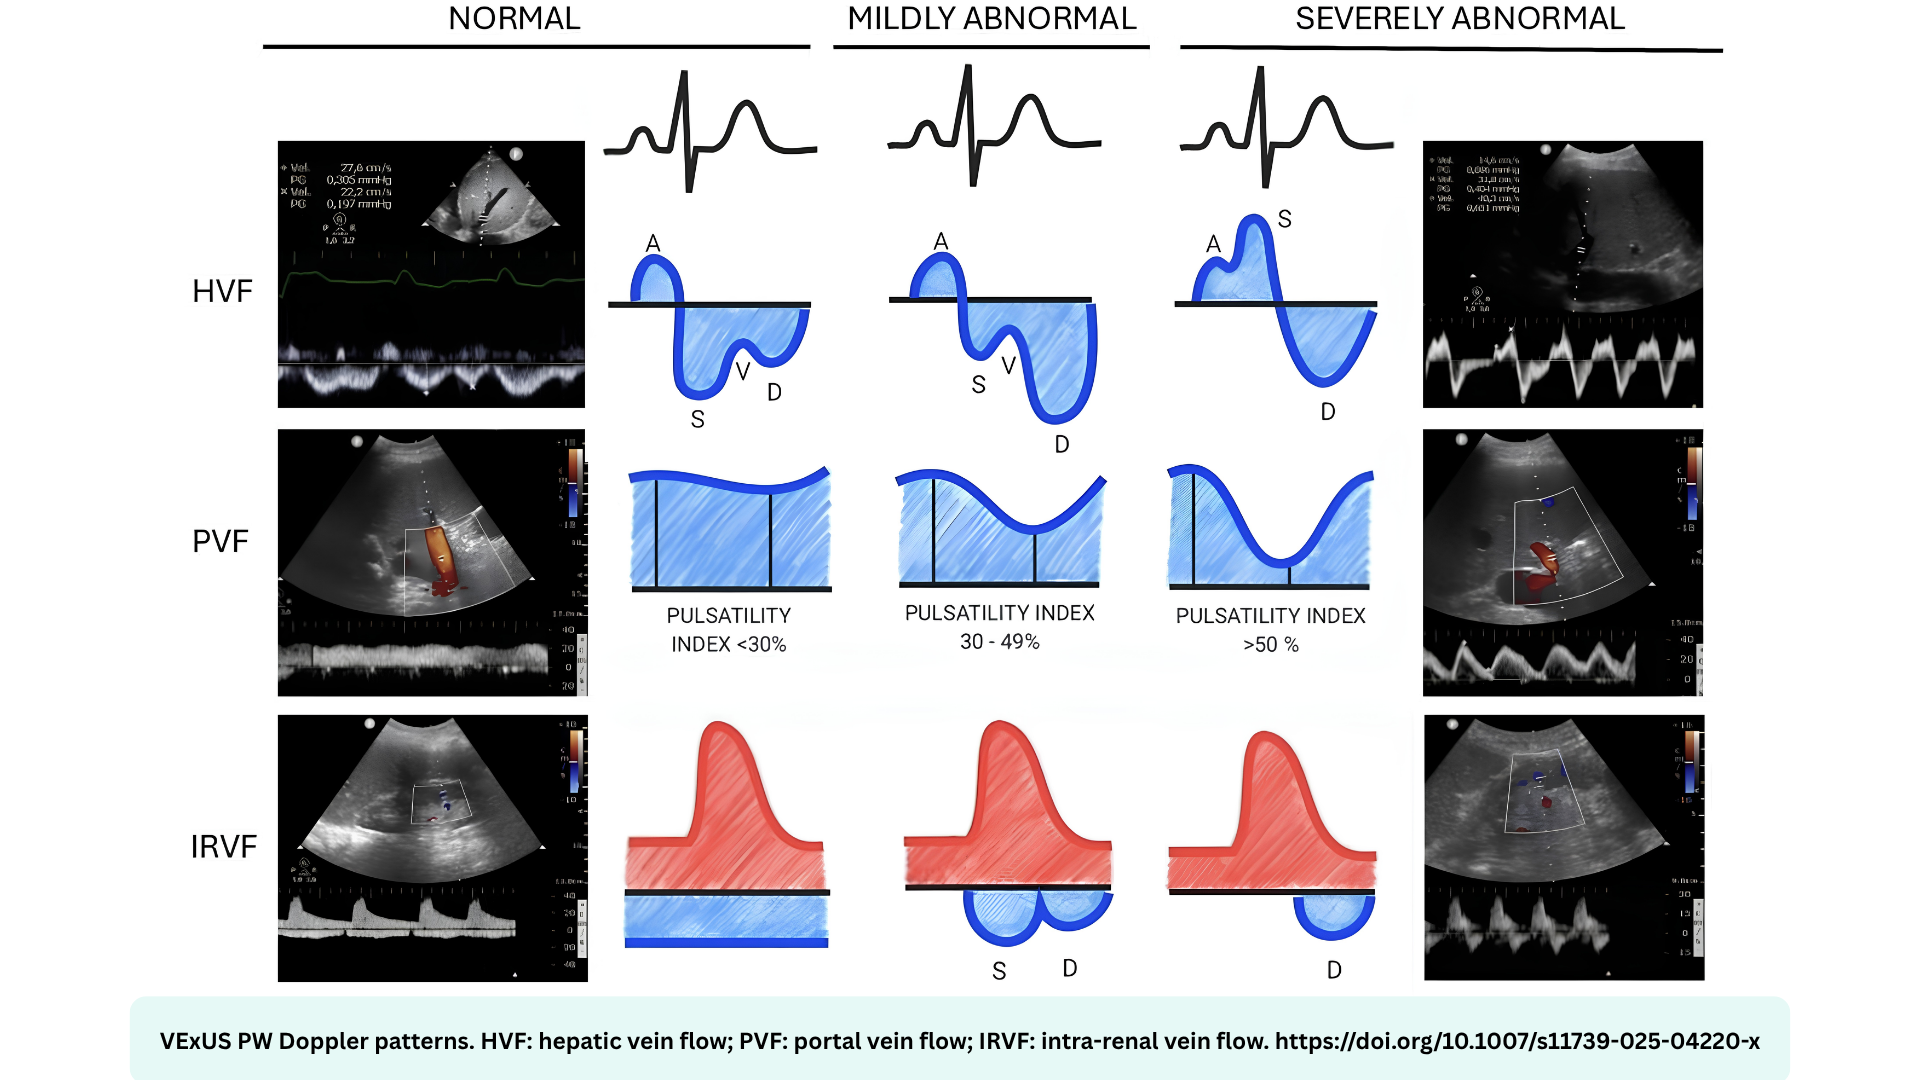
- Mild = S < D (still below baseline)
- Severe = reversed S wave (above baseline).
⚠️Limitation
- Tricuspid regurgitation: S-wave reversal may occur without significant systemic venous congestion.
- Waveforms may be blunted (band-like) by the following conditions *:
- Cirrhosis or fatty infiltration of the liver; hepatic lymphoma.
- HV Doppler waveform becomes band-like (↓pulsatility) due to external compression by dense regenerative tissues.
- Valsalva maneuver or end-inspiratory breath-hold.
- Abdominal compartment syndrome.
- IVC stenosis.
- Cirrhosis or fatty infiltration of the liver; hepatic lymphoma.
- Atrial fibrillation causes:
- Loss of the A-wave.
- The S-wave becomes smaller than the D-wave (since the S-wave depends partially on atrial relaxation) *.
⚠️Technical pitfalls
- Without ECG leads, differentiating different waveform components is often impossible.
- A high wall filter setting on the ultrasound (which may be the default for some cardiac probes) can eliminate waveform components *.
Portal vein
◾️Technique:
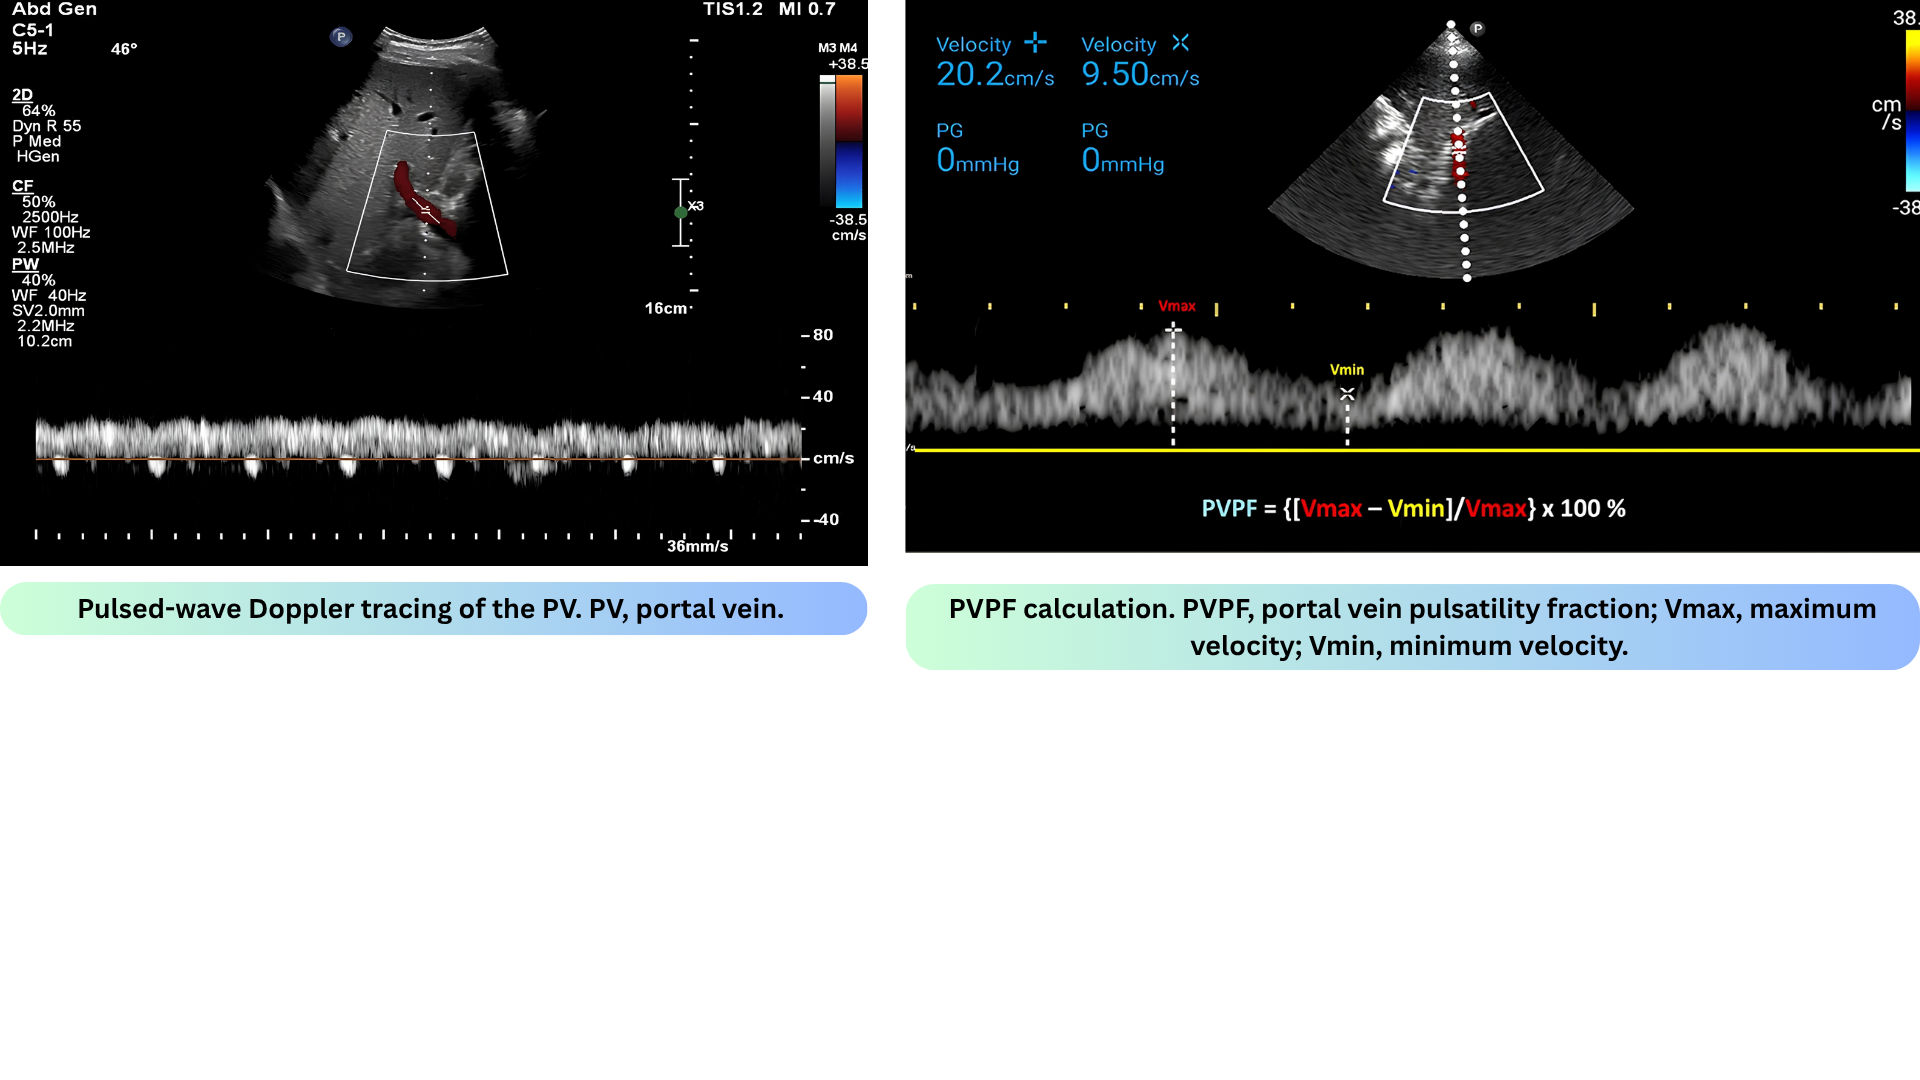
- Long-axis view; slide caudally from HV view; Fan the transducer anteriorly across the patient’s abdomen to unveil the portal vein; sample the main portal vein.
- Avoid the hepatic artery. To prevent interference from the hepatic arterial flow, position the sample volume distally within the portal vein
- Note:
- The portal vein is not a central vein nor is it a peripheral vein. The flow within the portal vein is toward the liver throughout the entire cardiac cycle.
- The waveform does not reflect the right-sided cardiac activity since it is isolated from the right heart by the hepatic sinusoid. Therefore, the normal Doppler waveform of the portal vein is continuous with minor fluctuation (wavy appearance, i.e., low pulsatility fraction)
- Normal size (11 +/- 2mm). A size > 13 mm suggests portal hypertension.
- Flow velocity 16 - 40 cm/s. A slow flow velocity is defined as < 16 cm/s.
- In the state of increased RAP, the portal vein flow becomes pulsatile (increased pulsatility fraction), and with increasing RAP, may become a to-and-fro pattern.
- PVPF (portal vein pulsatility fraction) = (Vmax − Vmin) / Vmax × 100 *.
- Normal < 30%
- Mild 30–50%
- Severe ≥ 50%.
🩺Interpretation
- Normally, flow is monophasic or shows minimal fluctuations.
- Systemic congestion causes greater pressure transmission across the hepatic sinusoids, causing the portal vein to develop pulsatility.
⚠️Technical pitfalls
- Pseudo-pulsatility may result from the vein intermittently coming out of the plane of the ultrasound beam during respiration. In contrast, true portal vein pulsatility should be synchronous with the patient’s pulse (not respiration)
⚠️Limitations
- Lean/athletes may have portal vein pulsatility without elevated RAP *.
- Cirrhosis with portal hypertension:
- This may cause portal pulsatility to be falsely absent despite venous congestion (cirrhosis causes low-velocity/reversed flow in PV).
- Portal pulsatility may occur without congestion (since the pressure reflects local pressure changes rather than the right atrial pressure) *.
- Portal vein thrombosis.
⚙️Pathophysiologic explanation
- In normal liver: The hepatic sinusoids are compliant and transmit RAP fluctuations freely → Portal vein becomes pulsatile when RAP rises.
- In cirrhotic liver: Fibrosis and regenerative nodules compress the sinusoids → they can no longer transmit pressure waves from the right atrium.
- So the PV Doppler waveform in cirrhosis depends on local factors:
- Arterioportal shunting: In cirrhosis, hepatic arterial blood is shunted directly into the portal venous system. This transmits the arterial pulse into the portal vein → Portal vein pulsatility (even if congestion is absent)
- Local pressure changes: The fibrotic liver creates local hemodynamic fluctuations that are independent of the cardiac cycle.
- So the PV Doppler waveform in cirrhosis depends on local factors:
- Clinical Implication for VExUS
- This is exactly why the VExUS protocol states that portal vein Doppler is unreliable in cirrhosis with portal hypertension. In these patients:
- You cannot use portal pulsatility to rule in congestion (may be false positive from shunting).
- You cannot use portal non-pulsatility to rule out congestion (may be false negative from sinusoidal compression).
- This is exactly why the VExUS protocol states that portal vein Doppler is unreliable in cirrhosis with portal hypertension. In these patients:
Intrarenal vein
◾️Technique
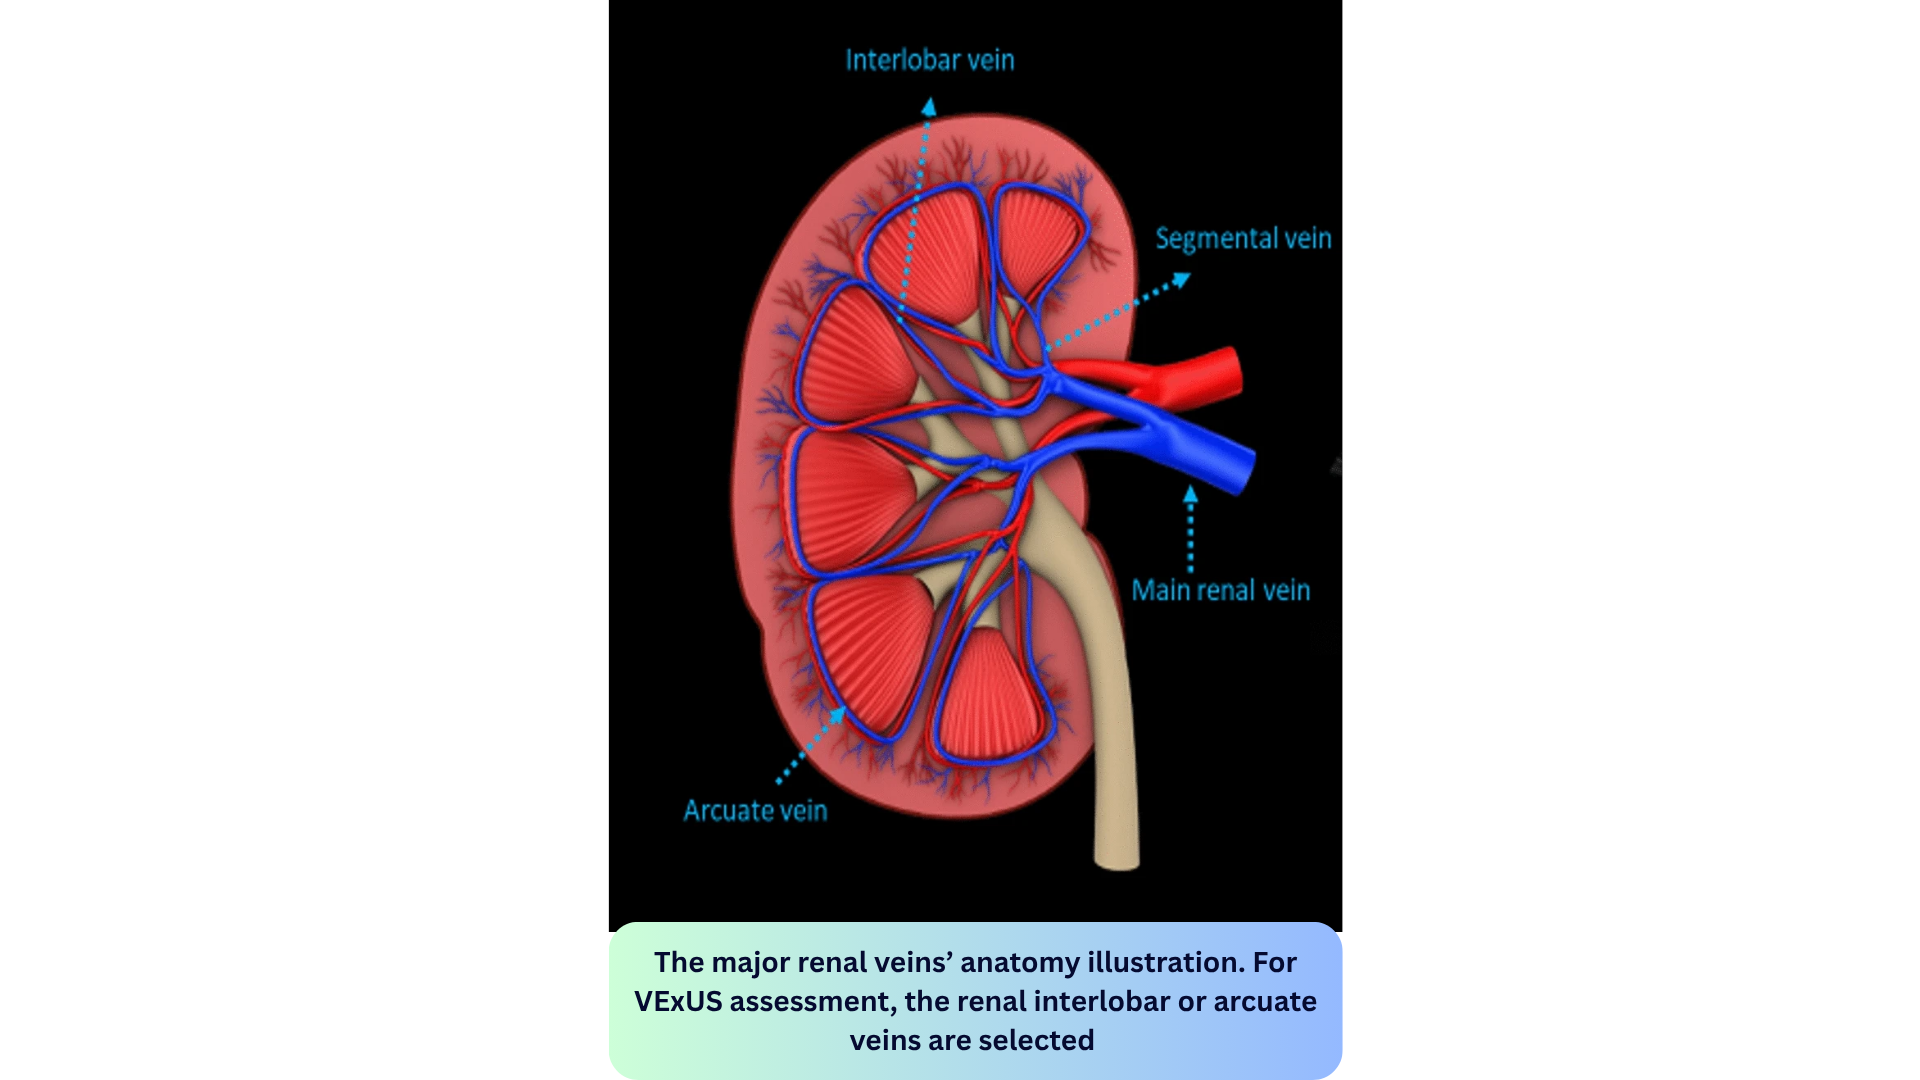
- Long-axis view; color Doppler to find interlobar/arcuate veins; PWD sample volume in the renal cortex.
- For VExUS assessment, the renal interlobar (running parallel to the medullary pyramids) or arcuate veins are selected instead of the main renal vein or segmental vessels. This is because veins located within the renal parenchyma provide insights into the effects of congestion and interstitial edema on renal perfusion.
- The interlobar vessels are preferred due to their easier identification compared to arcuate veins and their alignment in parallel with the ultrasound beam.
- 💡Tips:
- A curvilinear transducer in the abdominal preset may be helpful.
- Power Doppler may be more useful than color Doppler (since this is more sensitive to lower flow rates).
- Ask the patient to hold their breath if they can.
- Adjust the Doppler scale (usually 20 cm/s or less) *.
- For VExUS assessment, the renal interlobar (running parallel to the medullary pyramids) or arcuate veins are selected instead of the main renal vein or segmental vessels. This is because veins located within the renal parenchyma provide insights into the effects of congestion and interstitial edema on renal perfusion.


🩺 Interpretation
- Normally, the renal vein flow is continuous.
- Abnormal:
- Mild congestion produces a pulsatile waveform with S and D waves (similar to the hepatic vein).
- Severe congestion causes S-wave reversal (which will seem to disappear since it merges into the arterial waveform): Monophasic diastolic-only flow (D-only).
⚠️ Pitfalls/Limitations
- Evaluation of the hilar vessels may show pulsatility (even without systemic congestion).
- Obstructive nephropathy may cause discontinuous intrarenal flow patterns *.
- Chronic kidney disease stage IV-V might cause pulsatility in the absence of congestion *.
VExUS grading
- Grade 0- No congestion (IVC < 2 cm)
- Grade 1- Mild congestion (IVC ≥ 2 cm + normal or mildly abnormal waveforms)
- Grade 2- Moderate congestion (IVC ≥ 2 cm + 1 severely abnormal waveform)
- Grade 3-Severe congestion (IVC ≥ 2 cm + ≥ 2 severely abnormal waveforms) *

🚨VExUS performance, grading and interpretation
Femoral Vein
◾️Technique
- Patient in supine position, use vascular probe(linear array), PWD of the common femoral vein.
- Approaches
- PWD in the short axis (without angle correction) may provide a qualitative tracing of the flow. If the probe angle is dropped to < 30 degrees, flow velocities will be only mildly reduced (< 25% reduction).
- PWD in the long axis with angle correction provides quantitative flow rates.
- Additional Tips:
- A Doppler scale of ± 20 cm/s may be useful.
- Minimal pressure should be applied so as not to compress the vein.
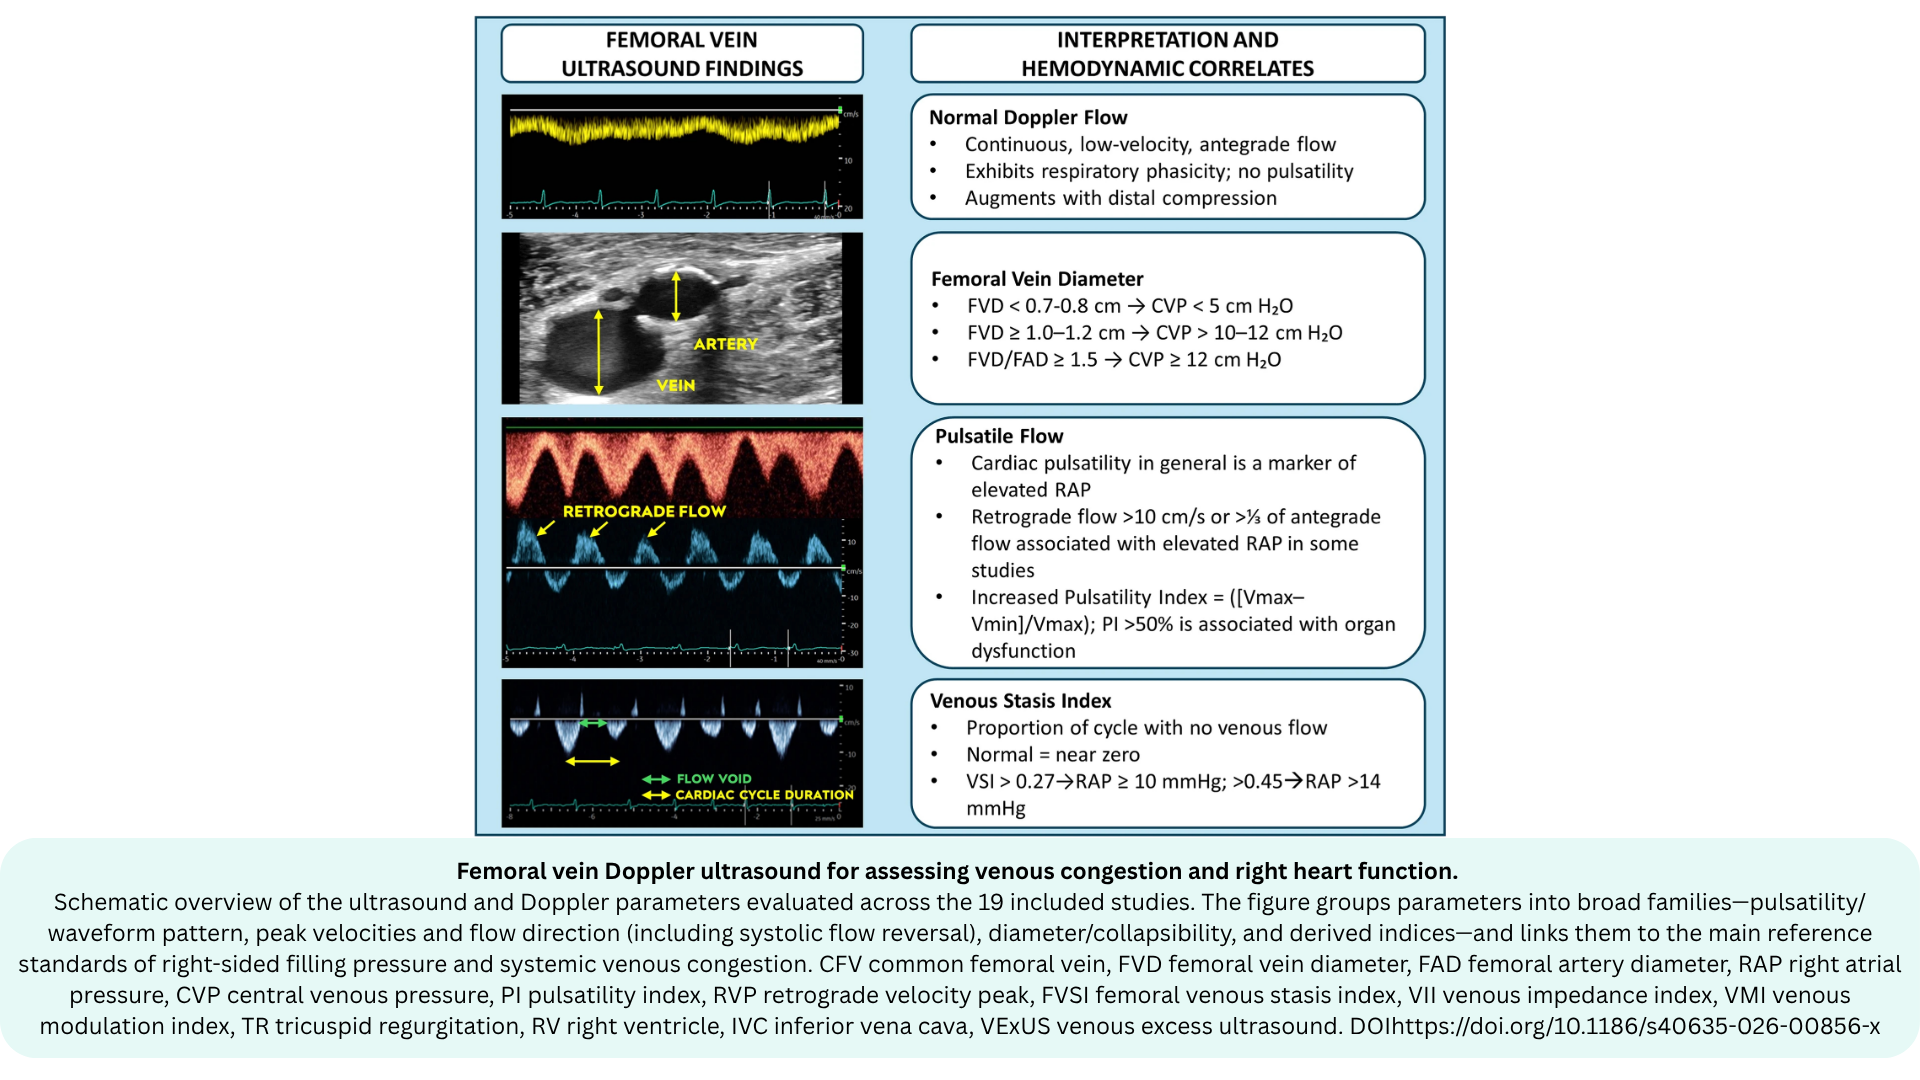
- The most commonly assessed parameters are:
- Pulsatility (presence of a cardiac phasic pattern)
- Pulsatility index (PI)
- Retrograde velocity peak (RVP) (commonly >10 cm/s as a threshold)
- Femoral vein diameter (FVD)
✅ Normal CFV Doppler Waveform Pattern

Femoral Vein Doppler: Interpretation

- Absent flow during inspiration:
- This suggests IVC collapse with inspiration.
- This pattern may be seen with hypovolemia and/or vasodilation.
- Continuous flow:
- Description:
- Flow is mostly continuous, but there may be mild respirophasic variations.
- The mean velocity is normally ~10 m/s *.
- The stasis index is zero (no flow reversal).
- Clinical significance: Right atrial pressure is likely to be normal, and right ventricular dysfunction is unlikely.
- Note that a complete lack of respirophasic variation suggests proximal venous obstruction (e.g., due to iliac vein DVT, pregnancy, or a mass lesion) *.
- Description:
- Phasic flow:
- Bidirectional flow:
- Description:
- Clinical significance: This is severely abnormal.
📍Key Note

⚠️Limitations
- IVC pathology (either intrinsic or extrinsic compression) will alter waveforms.
- Deep vein thrombosis may blunt waveforms.
✴️ ADVANTAGES
- Femoral vein Doppler is a feasible and accessible tool for assessing venous congestion and right heart function in critically ill patients *.
- Isolated severe tricuspid regurgitation may cause flow reversal in the hepatic vein, but FVD flow reversal is less common without systemic congestion (since the IVC is distensible and doesn't transmit pressures to the femoral vein).
- Assessing Fluid Tolerance in Septic Shock: Femoral vein pulsatility is a simple, rapid tool for assessing fluid tolerance in septic shock patients. A pulsatile pattern indicates fluid intolerance and correlates with VExUS grading.
Arterial Waveform Framework: A Spectrum of Resistance
Just as venous waveforms are categorized by their proximity to the heart, arterial waveforms are categorized by the resistance of the distal vascular bed they supply. This resistance determines the shape of the diastolic portion of the waveform, particularly whether flow reverses or continues forward.
The Concept of Resistance
◾️In the physiologic state, arteries possess the capacity to change their resistance to divert blood flow toward the organs that need it most. This dynamic process is controlled by the arteriolar bed:
- Low-Resistance State: When an organ needs to be "on," its arterioles relax. The waveform reflects this low resistance, indicating the organ is being appropriately perfused.
- High-Resistance State: When an organ is in a "power save" mode, its arterioles constrict. The waveform switches to a high-resistance pattern, and flow is diverted to other organs.
📉The Waveform Morphology of Resistance
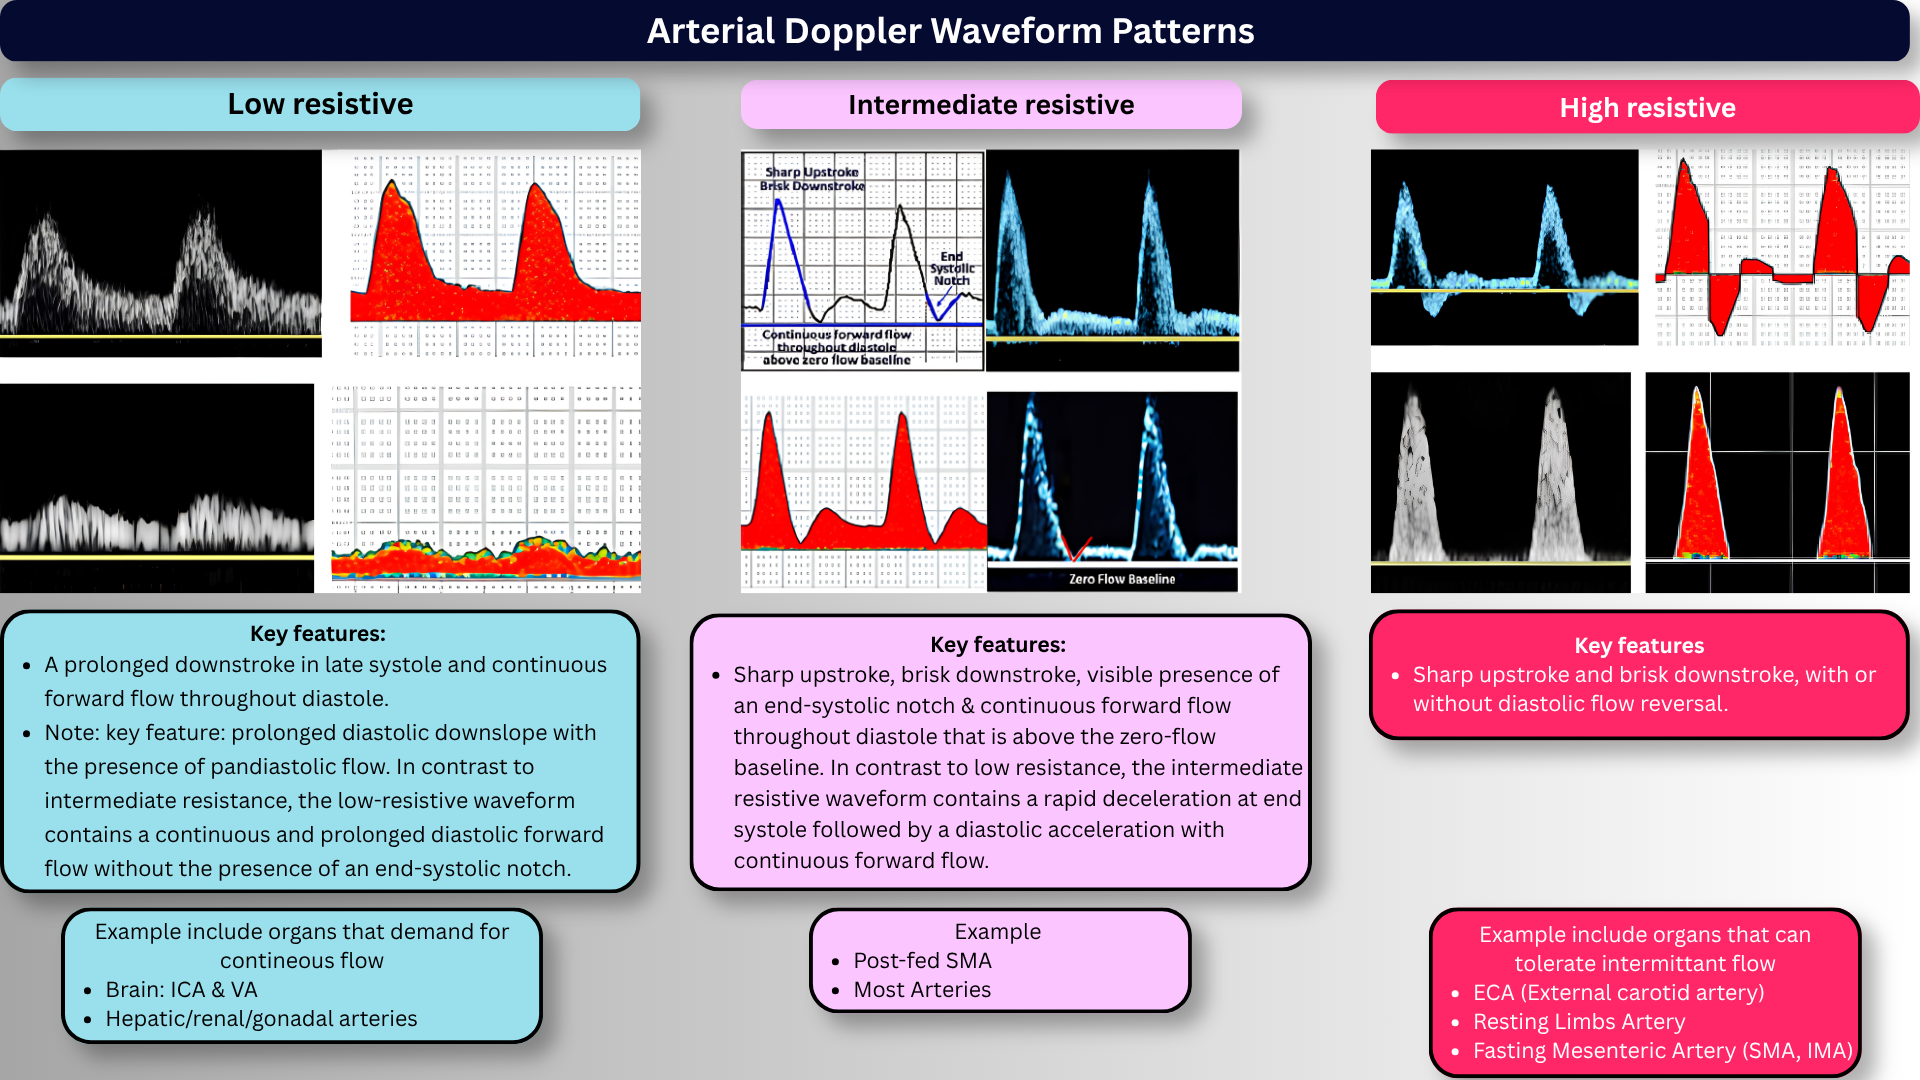
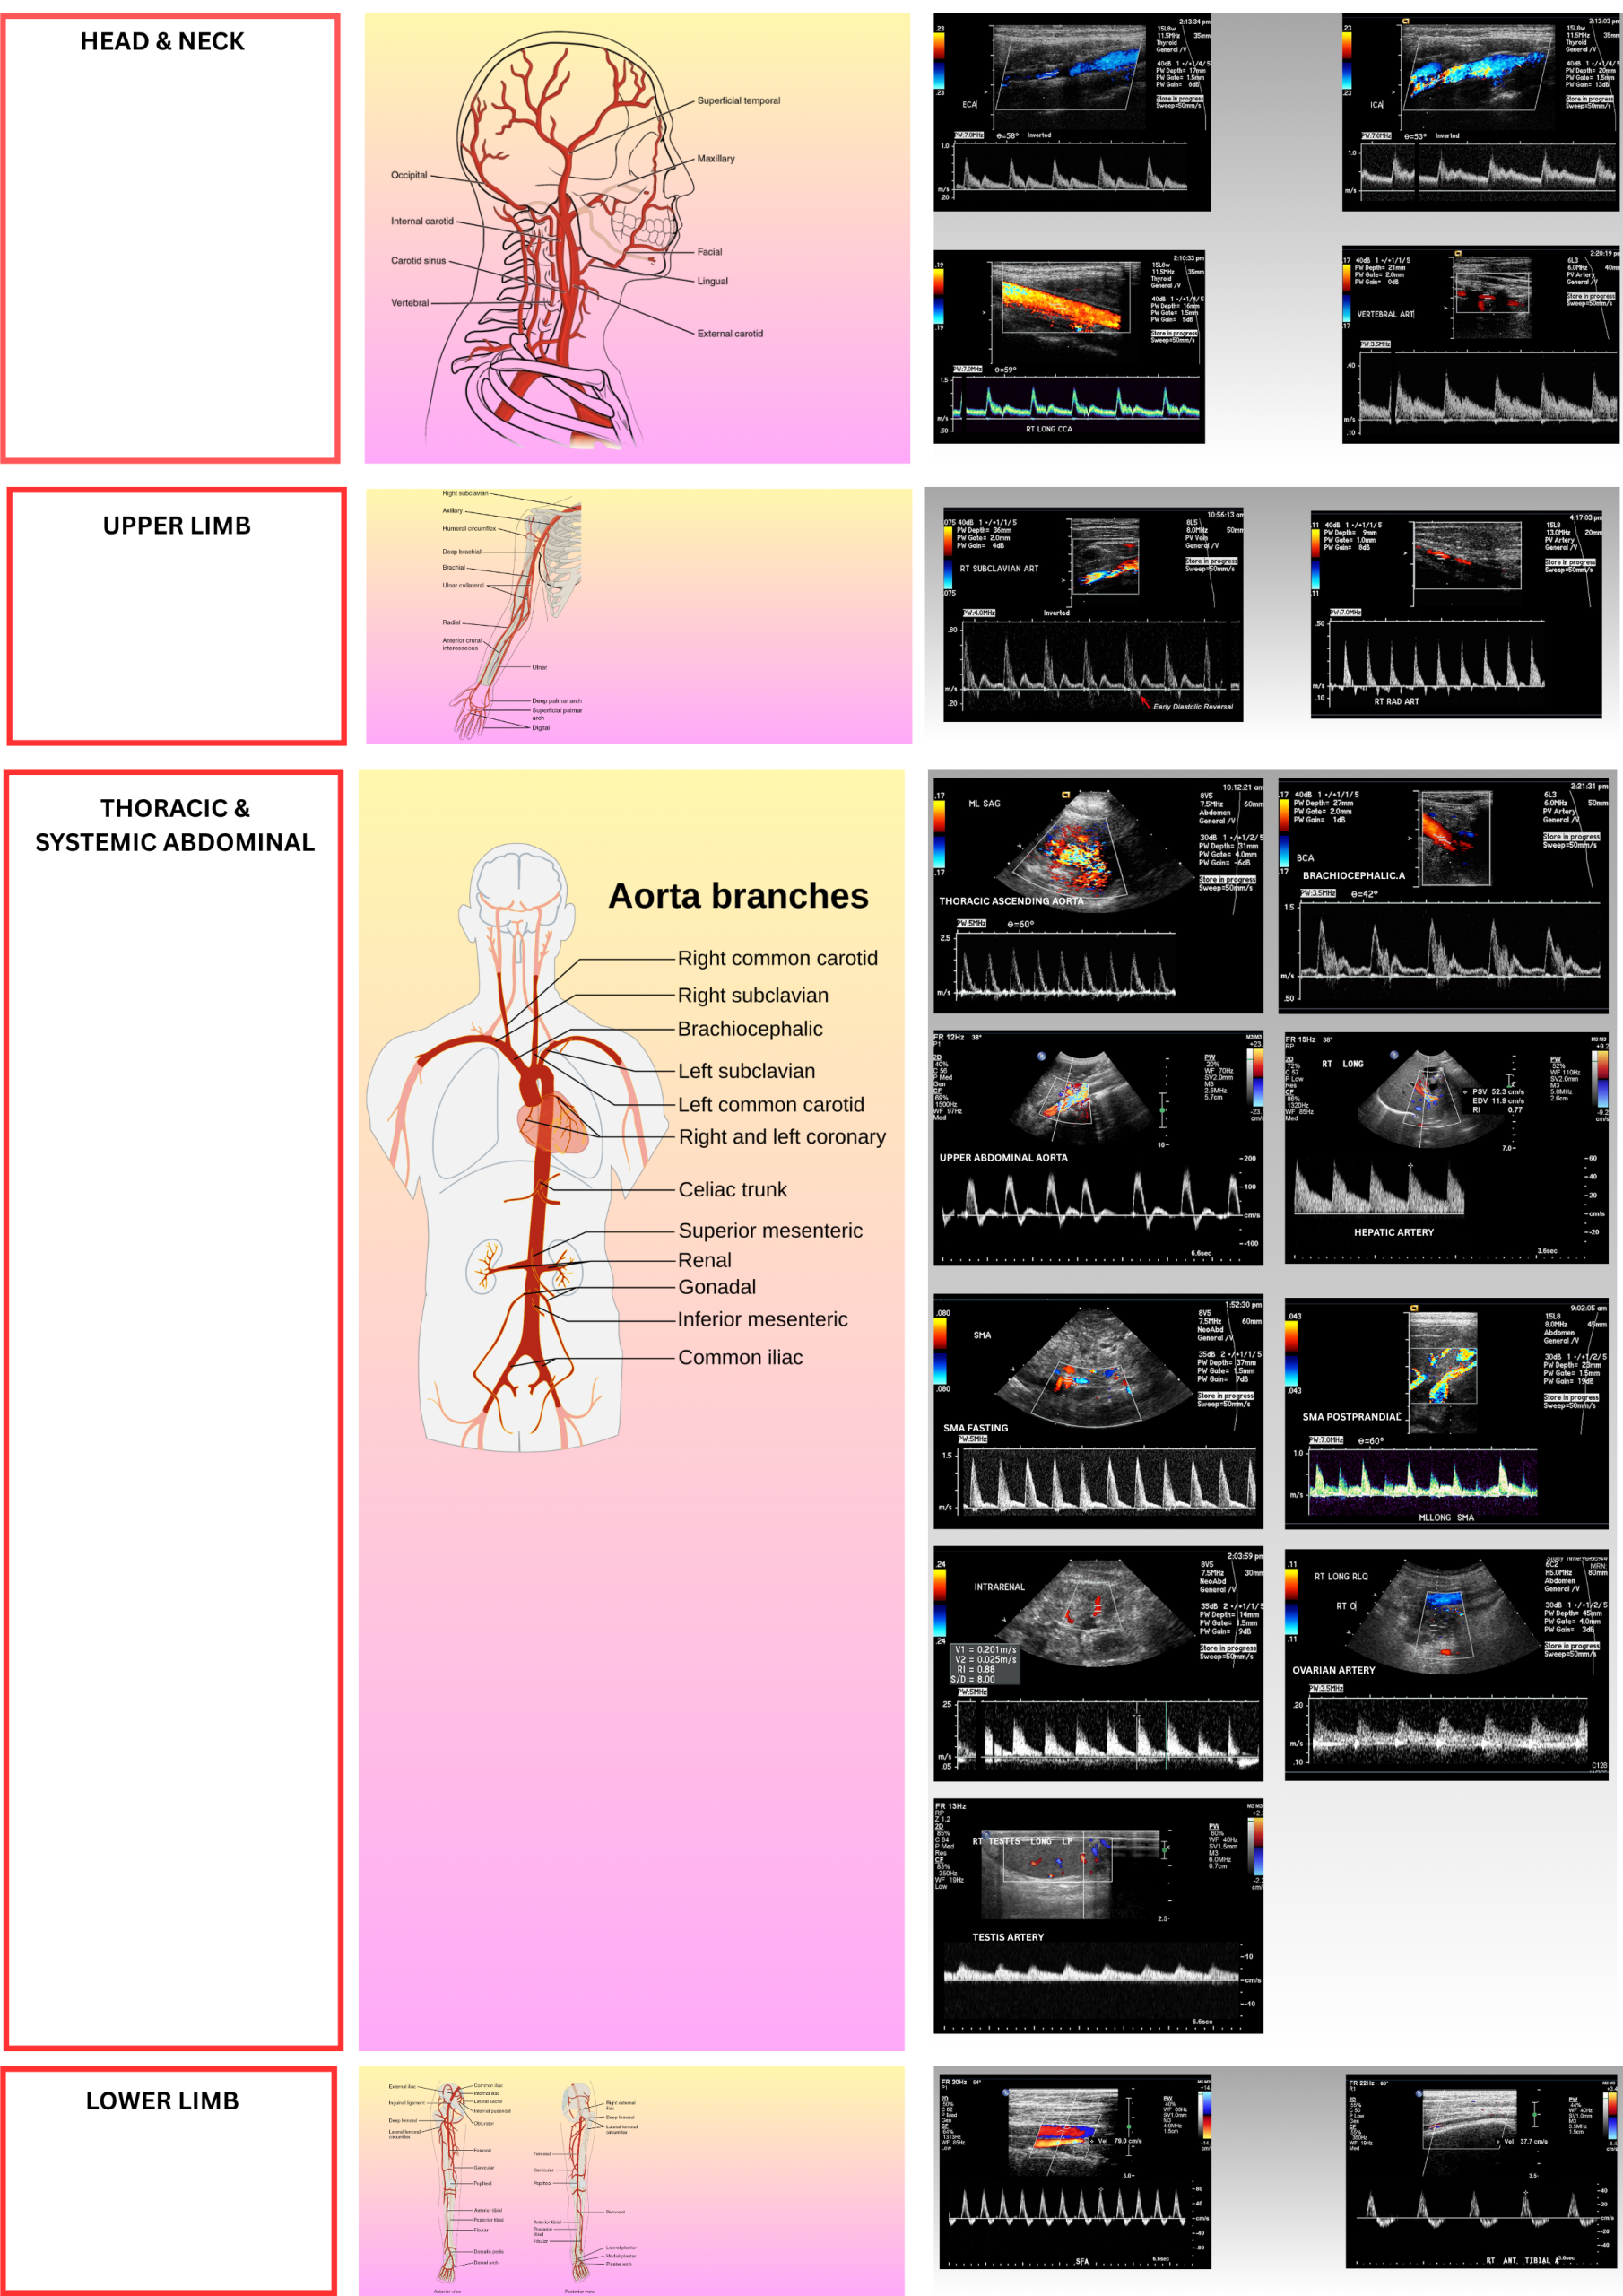
- High-Resistance Arteries
- The waveform is characterized by a sharp upstroke and brisk downstroke, often with a reverse flow component in early diastole (Multiphasic). There is little to no forward flow at end-diastole.
- Supply vascular beds that are "off" or resting (e.g., muscle, skin).
- Clinical Examples: External carotid, extremity arteries (femoral, brachial, radial), fasting mesenteric arteries *.
- Low-Resistance Arteries
- The waveform is monophasic, showing continuous forward flow throughout the entire cardiac cycle with no flow reversal. This is because the low resistance of the distal vascular bed allows flow to continue even during diastole.
- Supply vascular beds that are always "on" and have high metabolic demand (e.g., brain, kidney, liver).
- Clinical Examples: Internal carotid, renal, hepatic, celiac arteries *.
- Intermediate-Resistance Arteries
- Waveform Characteristics: Monophasic with continuous forward flow, but also a brisk downstroke and an end-systolic notch (a brief deceleration).
- Supply beds with mixed demand or have a unique hybrid pattern.
- Clinical Examples: Common carotid (mix of high-resistance external and low-resistance internal), post-prandial mesenteric arteries
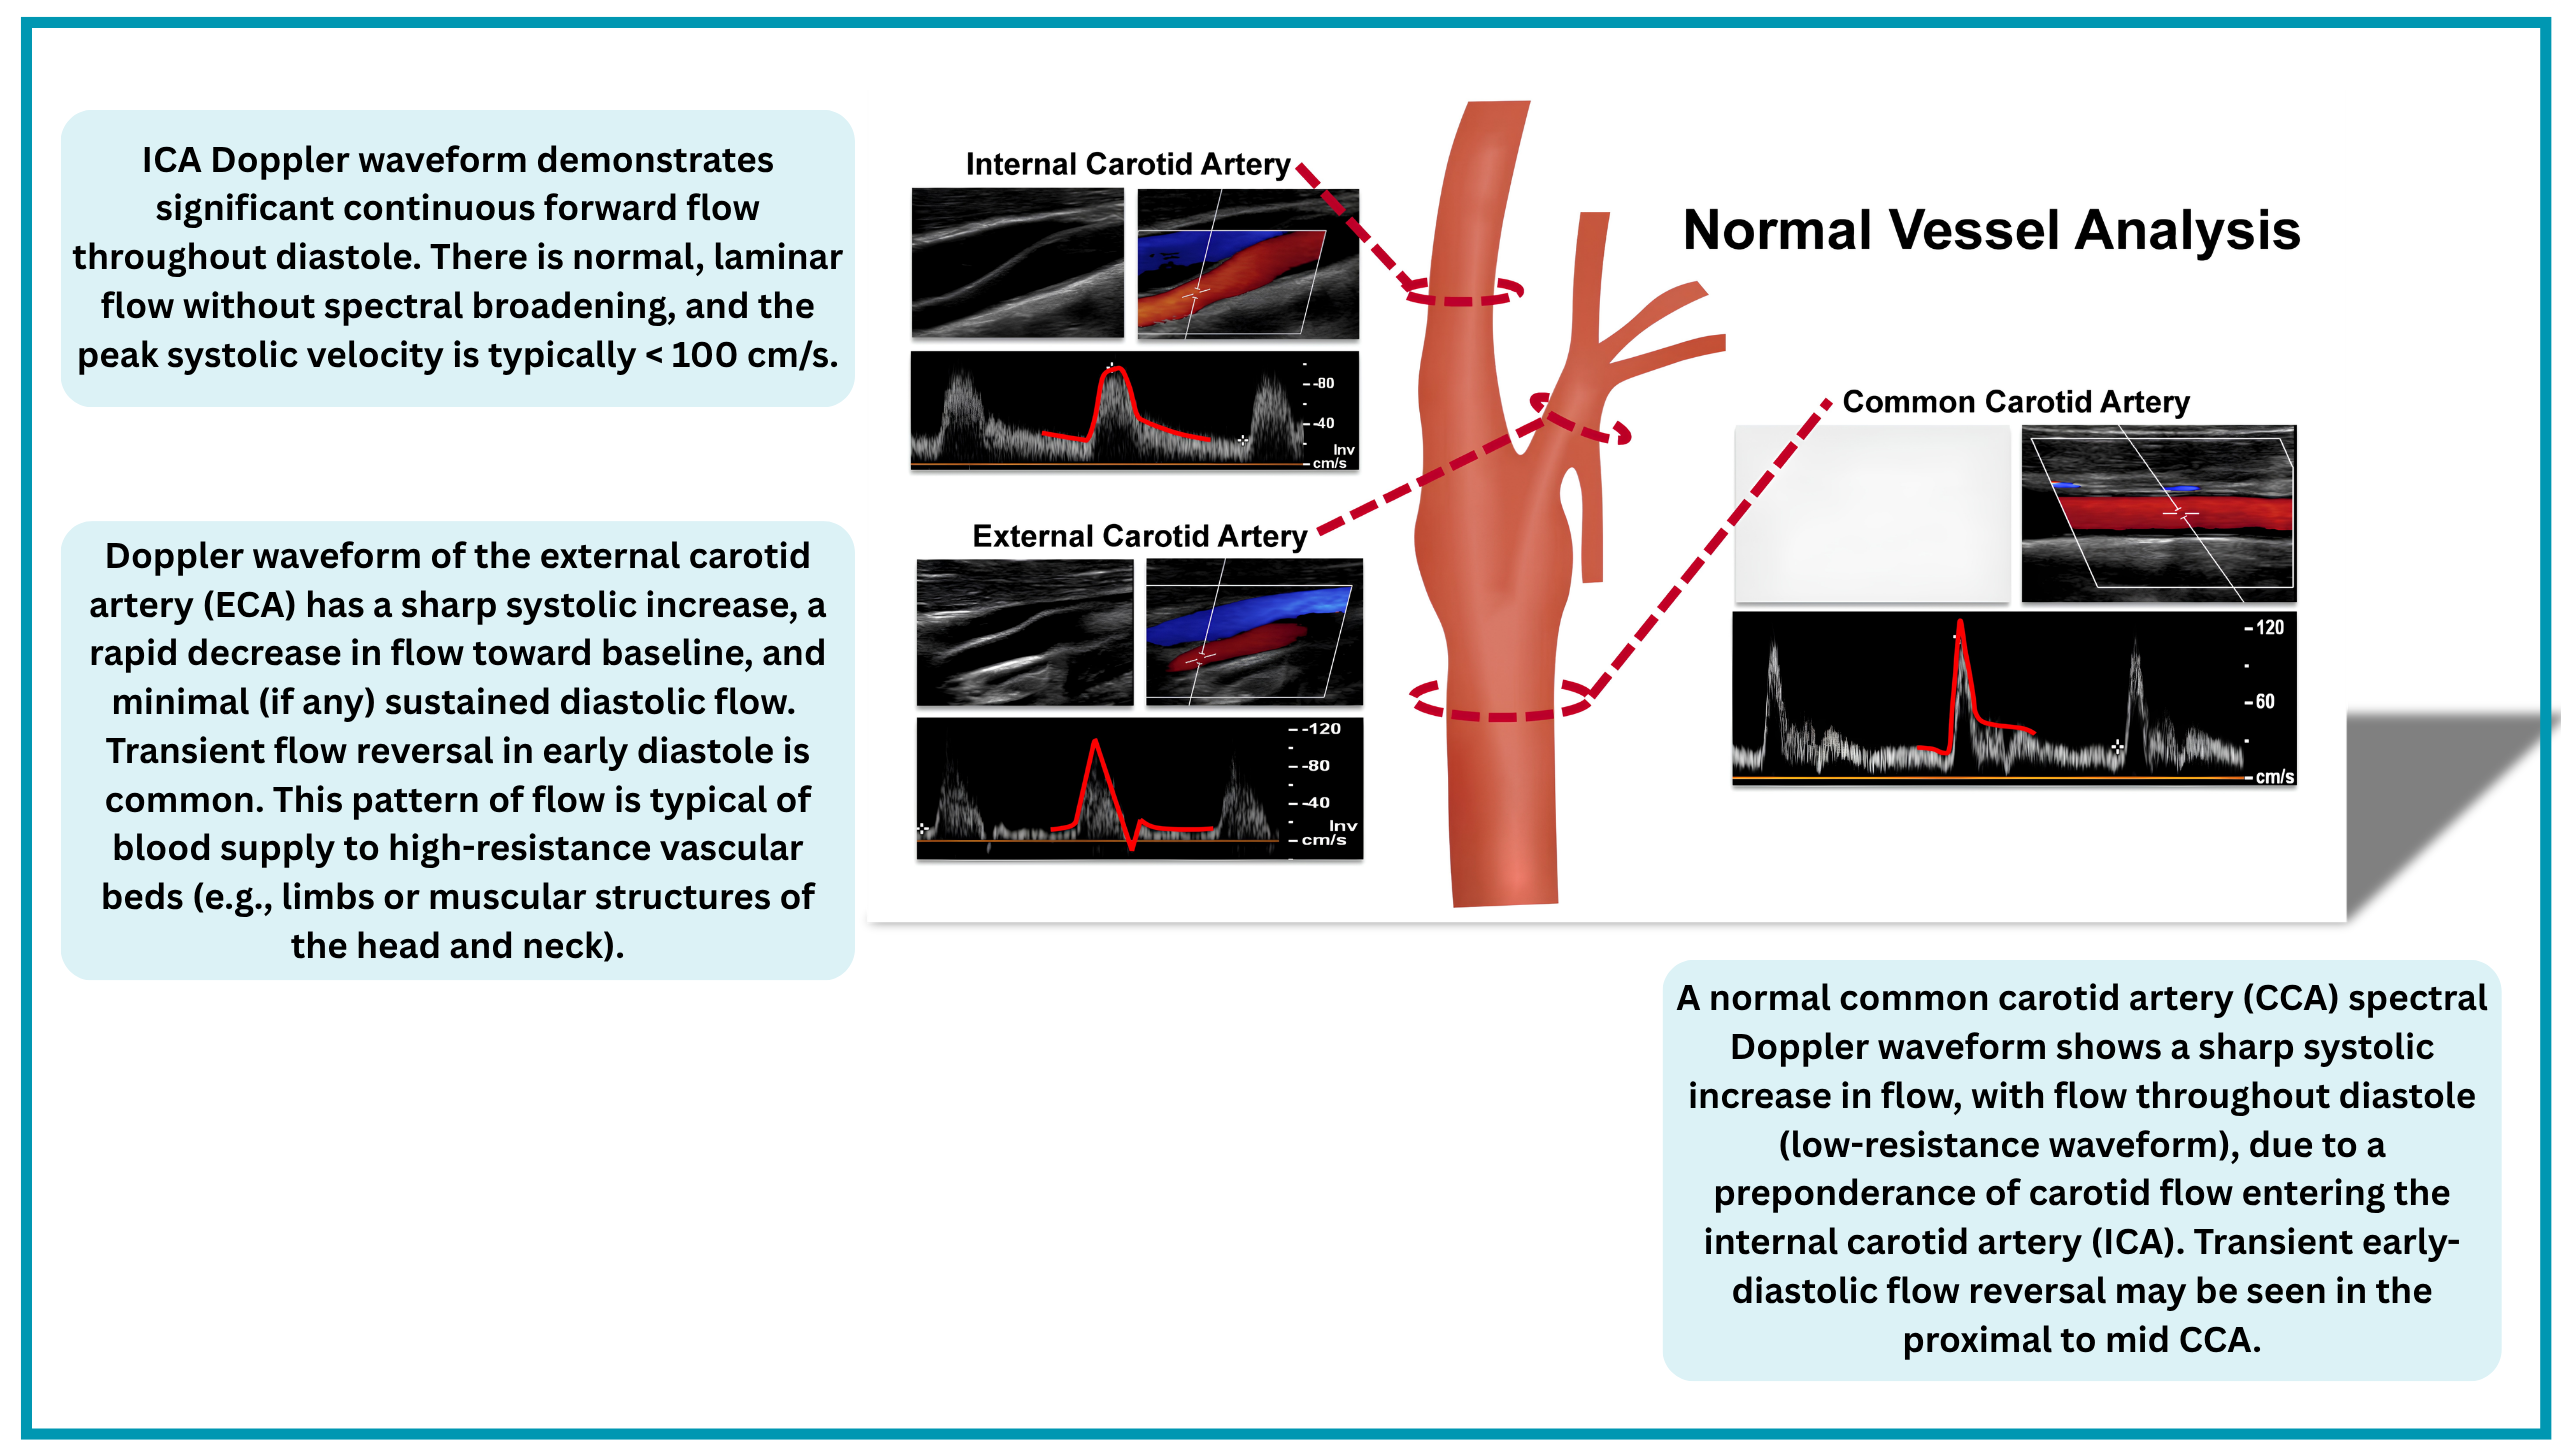
📊Figure: The image left below shows the arterial Doppler waveform class in terms of resistivity. The image below right shows the normal arterial Doppler waveform in different anatomy (see the table here).
Resistive Index
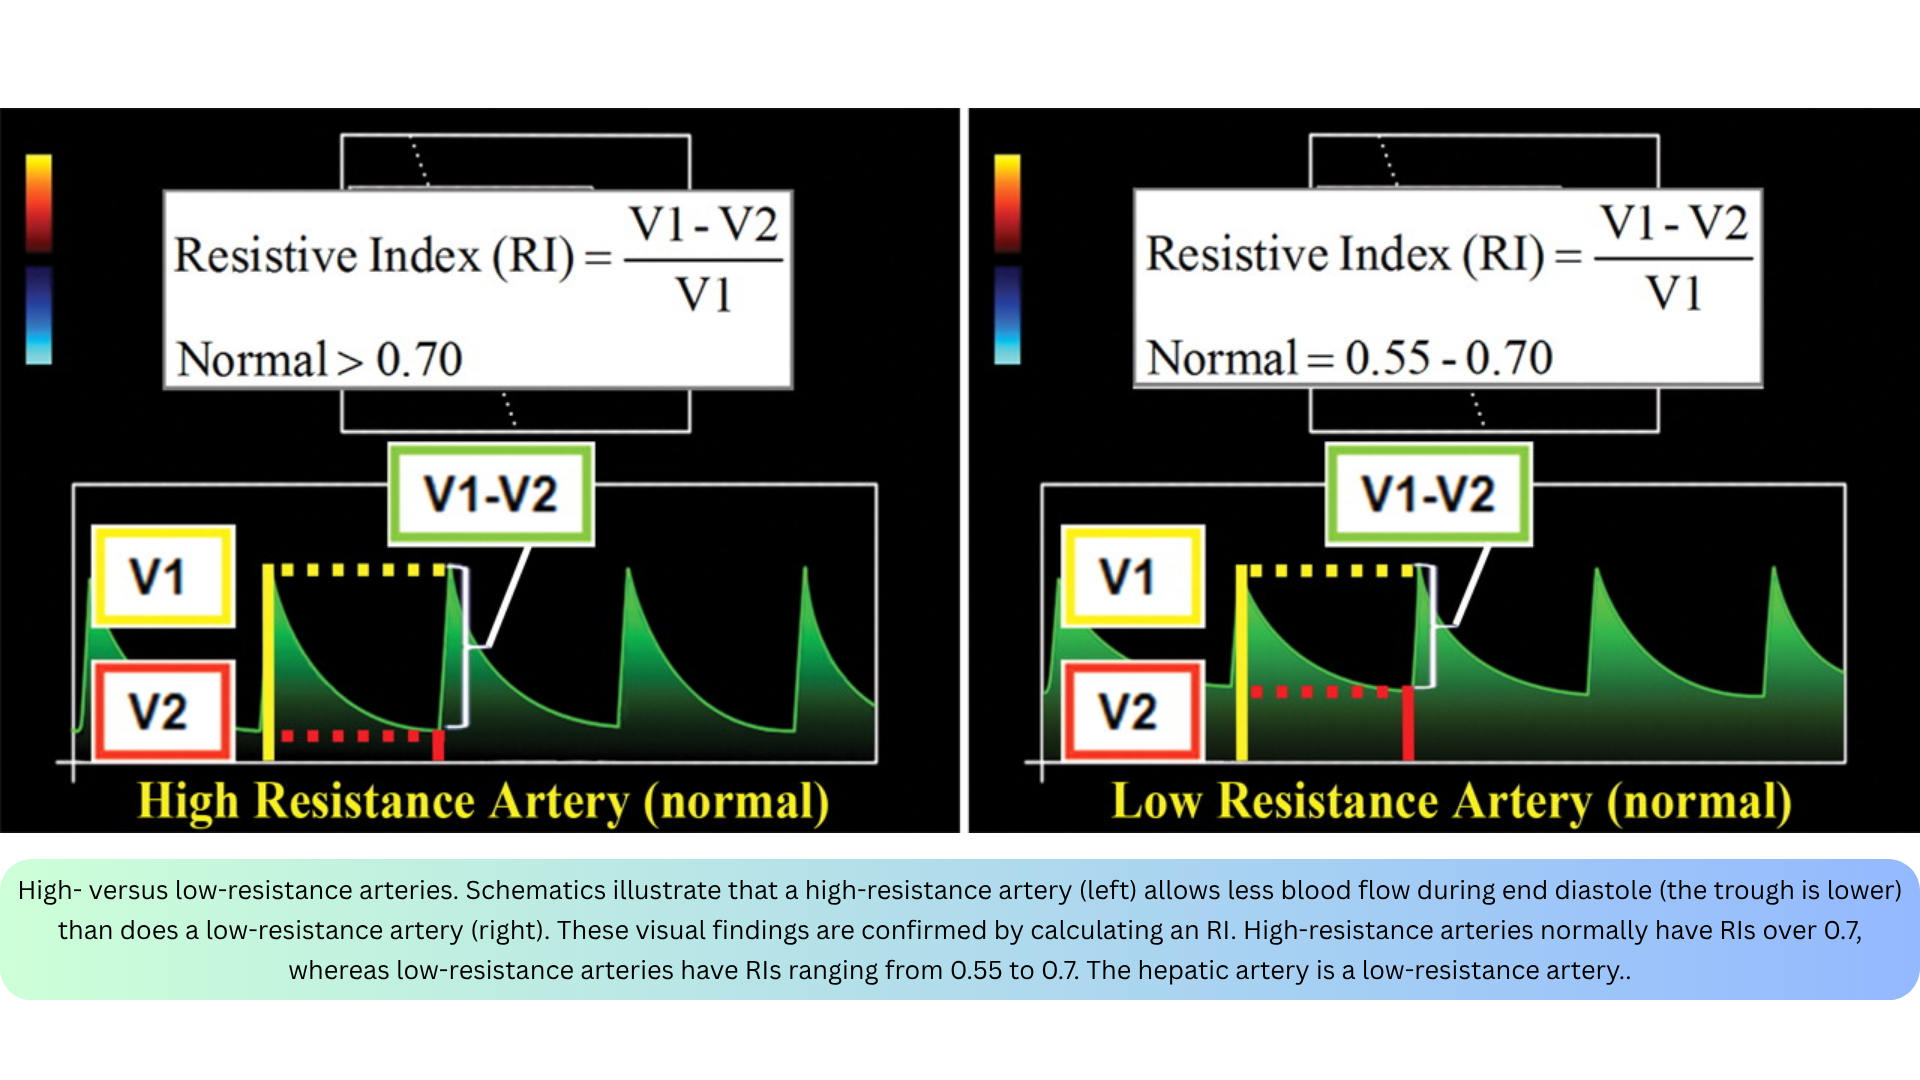
- While visual assessment is useful, resistance can be quantified using several indices. The most frequently used is the Resistive Index (RI), calculated as *
- Low-Resistance Arteries: Normally have an RI of 0.55–0.7.
- High-Resistance Arteries: Physiologically have an RI > 0.7.
Doppler Study of Arteries
Doppler assessment of the arterial system focuses on direct velocity parameters (PSV, EDV, TAmax) and calculated waveform indices (RI, PI, AT, velocity ratios) that reflect downstream resistance and stenosis severity.
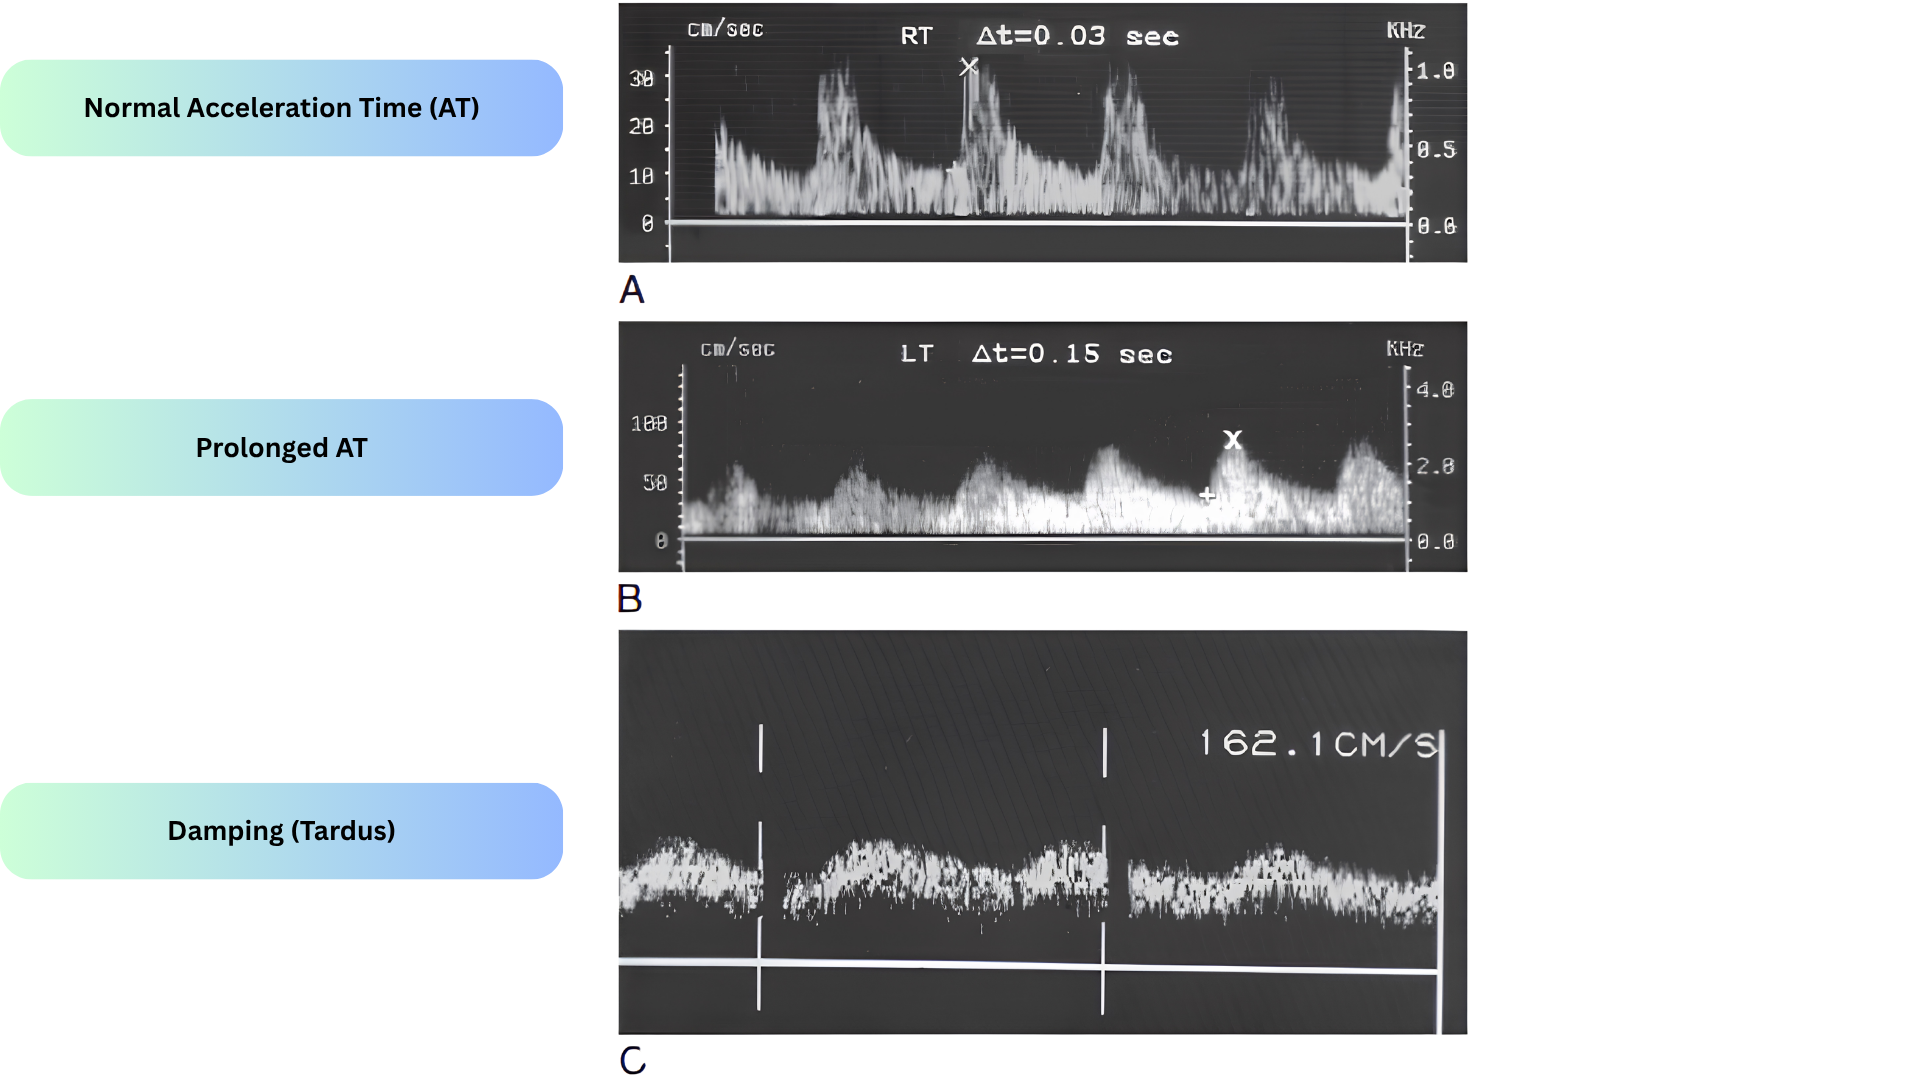
- Acceleration Time (AT) — the time interval from the start of systole to the initial systolic peak *.
- Clinical significance: Prolonged AT is an indirect sign of proximal (upstream) stenosis, part of the tardus-parvus waveform (slow-rising, low-amplitude systolic peak)
- Acceleration time (AT) is measured from the start of the systolic upstroke (end-diastole, the "foot" of the waveform) to the first systolic peak (apex).
- Measurement Steps
- Obtain a clean spectral waveform with a clear systolic upstroke.
- Place the first caliper at the onset of systole (where velocity begins to rise from the end-diastolic baseline).
- Place the second caliper at the first systolic peak (the apex of the waveform).
- The machine reports AT in milliseconds (ms).
- Normal vs. abnormal pattern
- Normal
- Rapid, steep upstroke to a sharp systolic peak. AT is short (< 70 ms in renal/intraparenchymal arteries; < 140–144 ms in the common femoral artery).
- Abnormal (Tardus-Parvus) *
- Slow-rising (tardus), low-amplitude (parvus) peak. AT is prolonged (> 70 ms renal; > 140 ms CFA).
- This is an indirect sign of a proximal (upstream) stenosis. The post-stenotic pressure drop dampens and delays the systolic upstroke.
- Normal
- Key caveats
- Not angle-dependent: Unlike maximal acceleration (which requires angle correction), AT is measured along the time axis and is unaffected by the insonation angle.
- Heart-rate dependent: Absolute AT values are influenced by cardiac output and heart rate; using ratios (e.g., renal/aortic AT) improves specificity.
- Visual interpretation is unreliable: Inter-rater agreement for detecting tardus-parvus by eye is only moderate; computer-generated AT cutoffs improve accuracy.
◾️Other Indices in Doppler Assessment of Arteries
- The table below summarizes the direct velocity parameters and calculated waveform indices used to assess arterial flow, along with their physiological meaning and typical clinical applications.
Normal Arterial Doppler Indices
The table below summarizes the normal waveform pattern, resistance, and velocity parameters for the major arteries, organized from head and neck to the lower limb.
Abnormal Arterial Doppler Patterns
Stenosis Flow Dynamics
◾️Terminology
- "Upstream" and "downstream" are ambiguous — always qualify which reference point is used (transducer vs. stenosis).
- Blood flow defines the "stream" direction.
- "Upstream stenosis" = transducer samples blood that has already passed the stenosis → transducer is actually downstream.
- "Downstream stenosis" = transducer samples blood that has not yet passed the stenosis → transducer is actually upstream.
◾️Direct Signs (found at the stenosis)
- Elevated peak systolic velocity (PSV).
- Elevated end-diastolic velocity (EDV).
- Spectral broadening due to turbulence in the immediate post-stenotic segment.
◾️Indirect Signs (found upstream or downstream)
◾️Subjective:
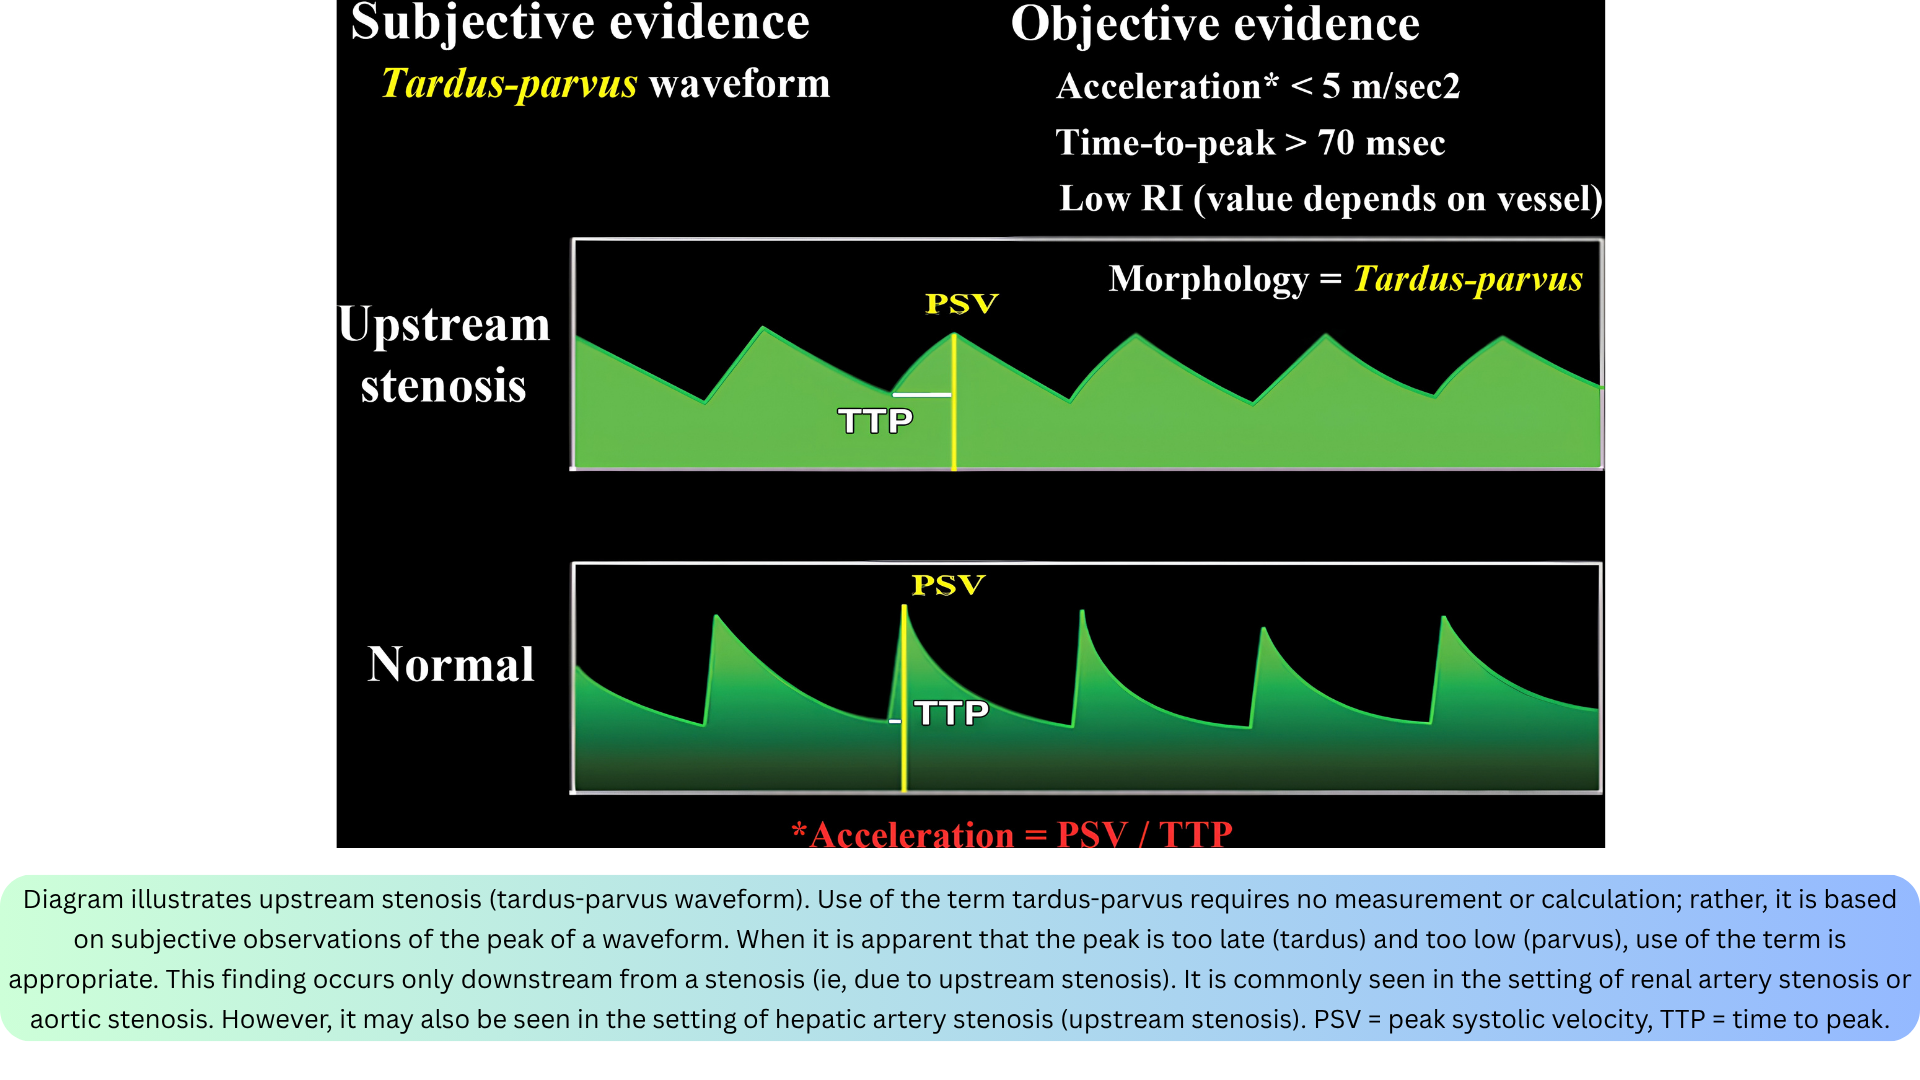
- Tardus-parvus waveform — late (tardus) and low (parvus) systolic peak.
- Classic in aortic and renal artery stenosis; can occur post-stenotic in any vascular territory.
◾️Objective:
- Acceleration: normal > 5 m/s².
- Time to peak: normal < 70 ms.
- Resistive Index (RI).
◾️RI Patterns
- Upstream stenosis → RI is low (PSV decreases disproportionately more than EDV).
- Downstream stenosis → RI is high (EDV decreases disproportionately more than PSV).
- ⚠️ High RI is not specific for downstream stenosis — diffuse microvascular disease can also increase resistance.

Other Abnormal Pattern
Beyond stenosis, a range of other abnormal arterial waveform patterns may be encountered. The table below summarizes the major descriptors, modifier terms, and disease-state patterns.
Resistive Index (RI) for Organ Perfusion
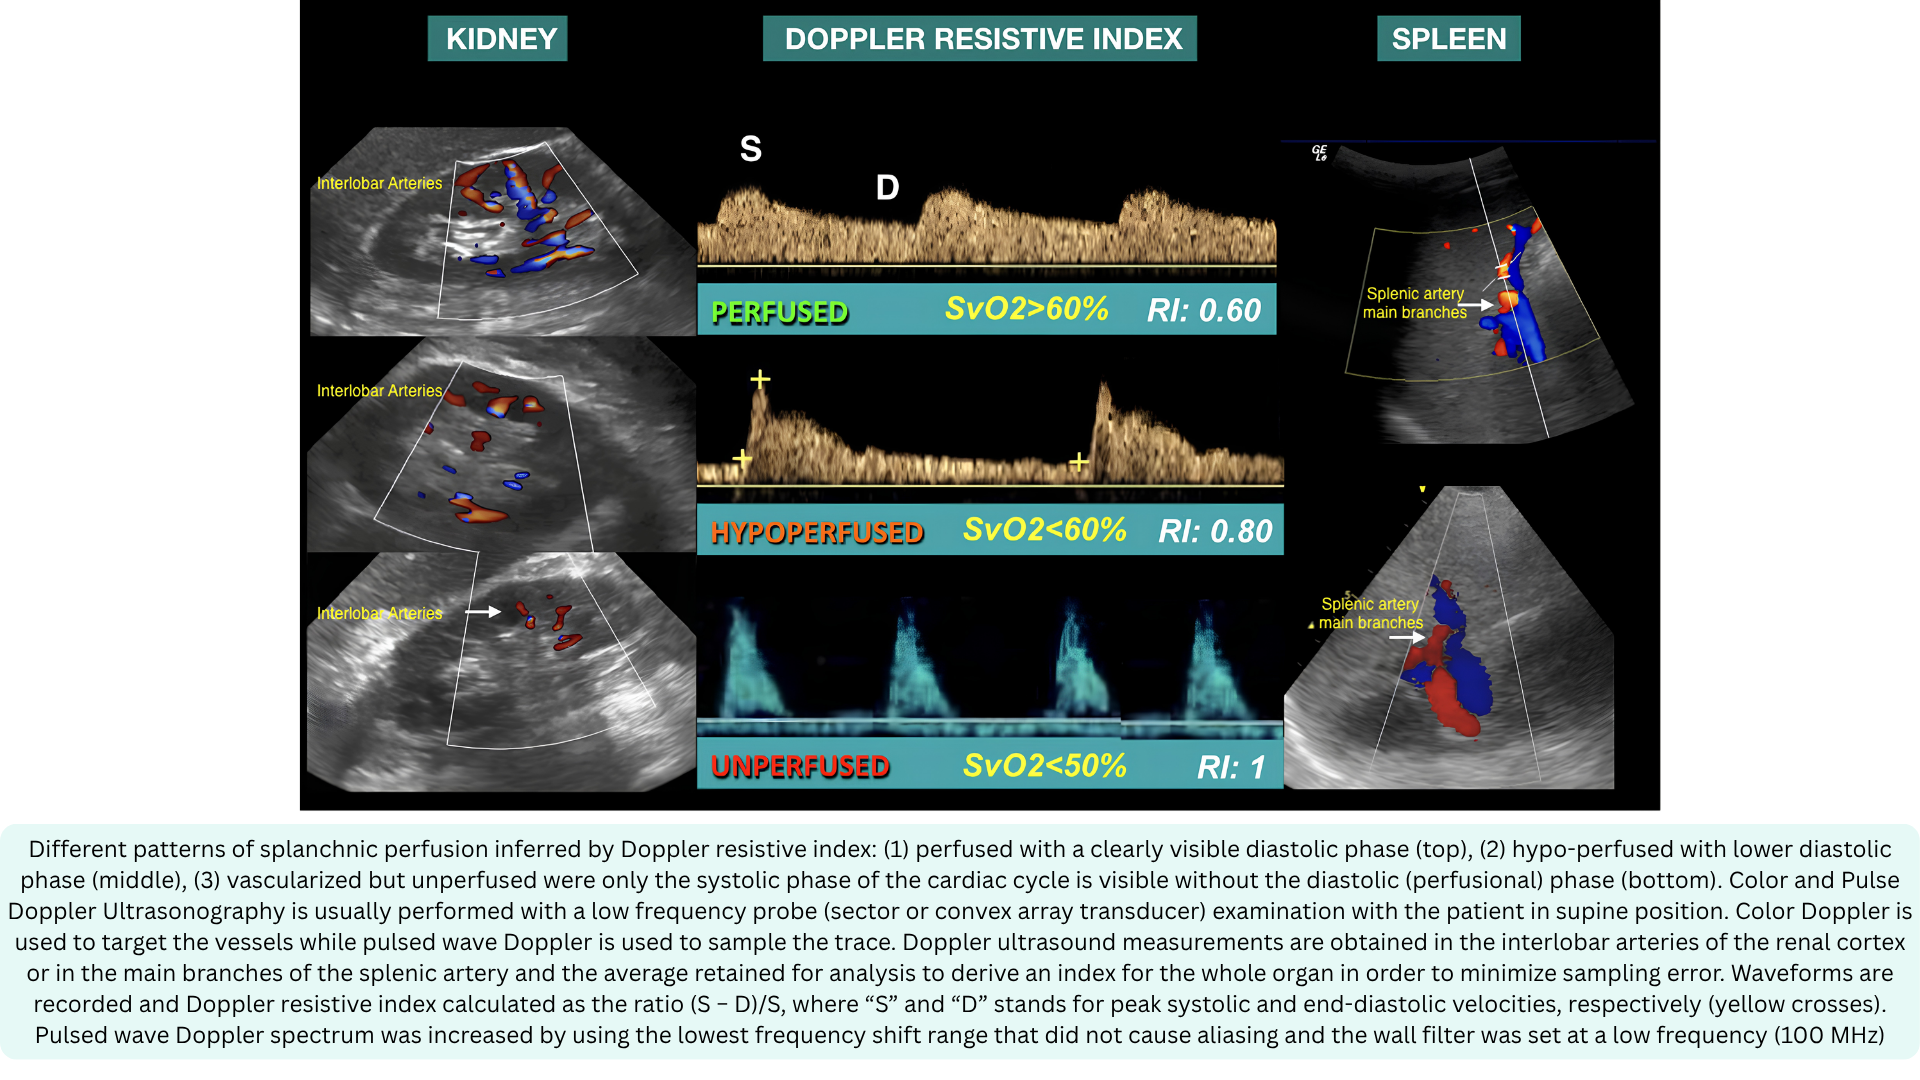
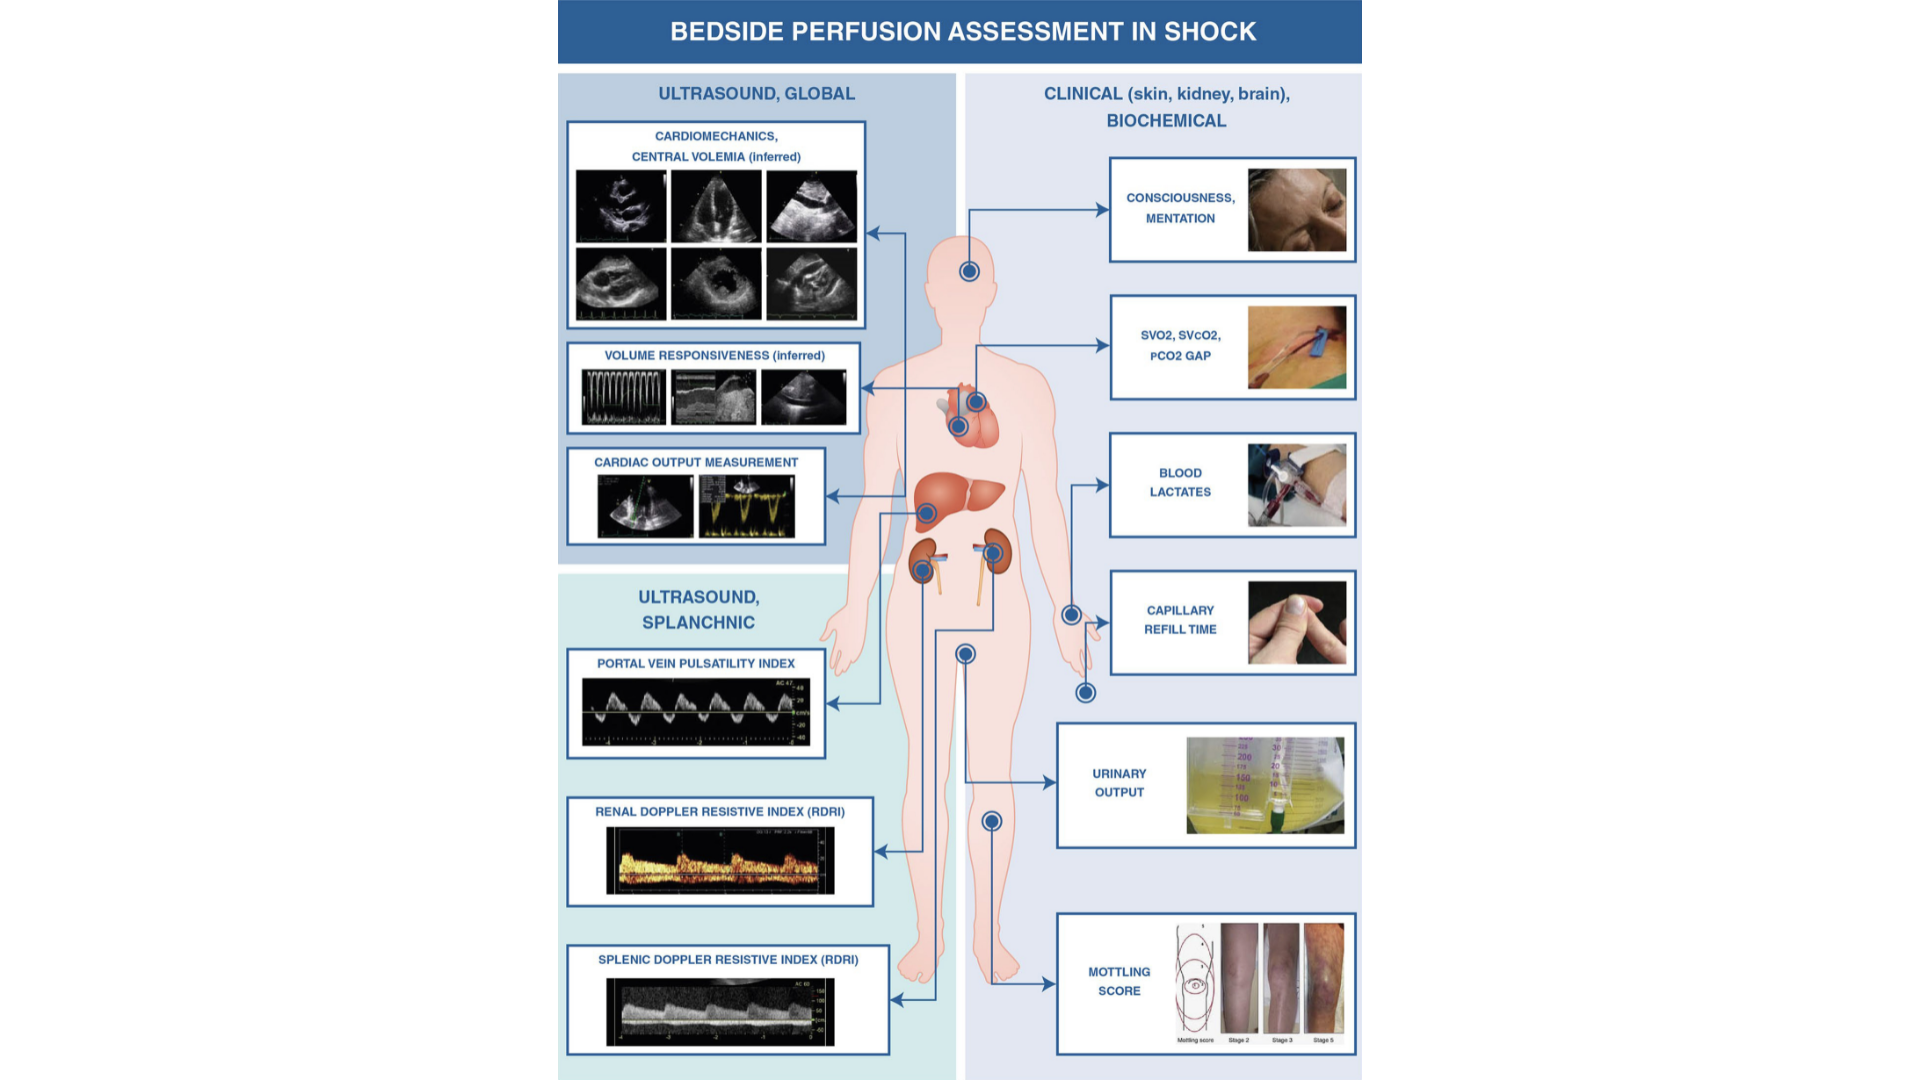
The resistive index (RI) is a Doppler-derived measure of pulsatile blood flow that reflects the resistance of the microvascular bed. The RI is used at the bedside to assess splanchnic organ perfusion in shock
The general concept is that the higher the RI, the lower the organ perfusion, because hypoperfusion alters the microcirculation by increasing flow resistance, which in turn increases the RI
◾️How it is measured
- Using PWD, the sample volume is placed in the interlobar arteries of the kidney or the splenic artery branches. Peak systolic velocity (S) and end-diastolic velocity (D) are measured from the spectral waveform. RI is calculated as:
- RI = (S − D) / S
◾️Interpretation:
- RI 0.60 — perfused (normal)
- RI 0.80 — hypoperfused (reduced perfusion)
- RI 1.0 — unperfused (no diastolic flow)
🚨Clinical utility in emergency and critical care
- Renal Doppler RI detects occult hypoperfusion, predicts acute kidney injury in sepsis, and titrates vasoactive therapy. Splenic Doppler RI mirrors cardiac responsiveness to fluid challenge and correlates with lactate and SvO₂
⚠️Key limitations
- RI is influenced by arrhythmias, arterial stiffness, intra-abdominal pressure, hypoxia, right heart function, and increased parenchymal wedge pressure — all must be considered when interpreting the value
Carotid Doppler Ultrasonography
Carotid Doppler ultrasonography is a versatile, non-invasive bedside tool that serves three distinct purposes in the hemodynamic evaluation of the critically ill patient:
- Hemodynamic assessment
- Cardiac disease detection
- Cerebrovascular evaluation (will be discussed separately).
The carotid artery is an accessible, low-resistance vessel supplying a high-metabolic-demand organ. Its monophasic waveform, rapid systolic upstroke with continuous forward diastolic flow—reflects cerebral perfusion and offers a window into both cardiac function and systemic hemodynamics.
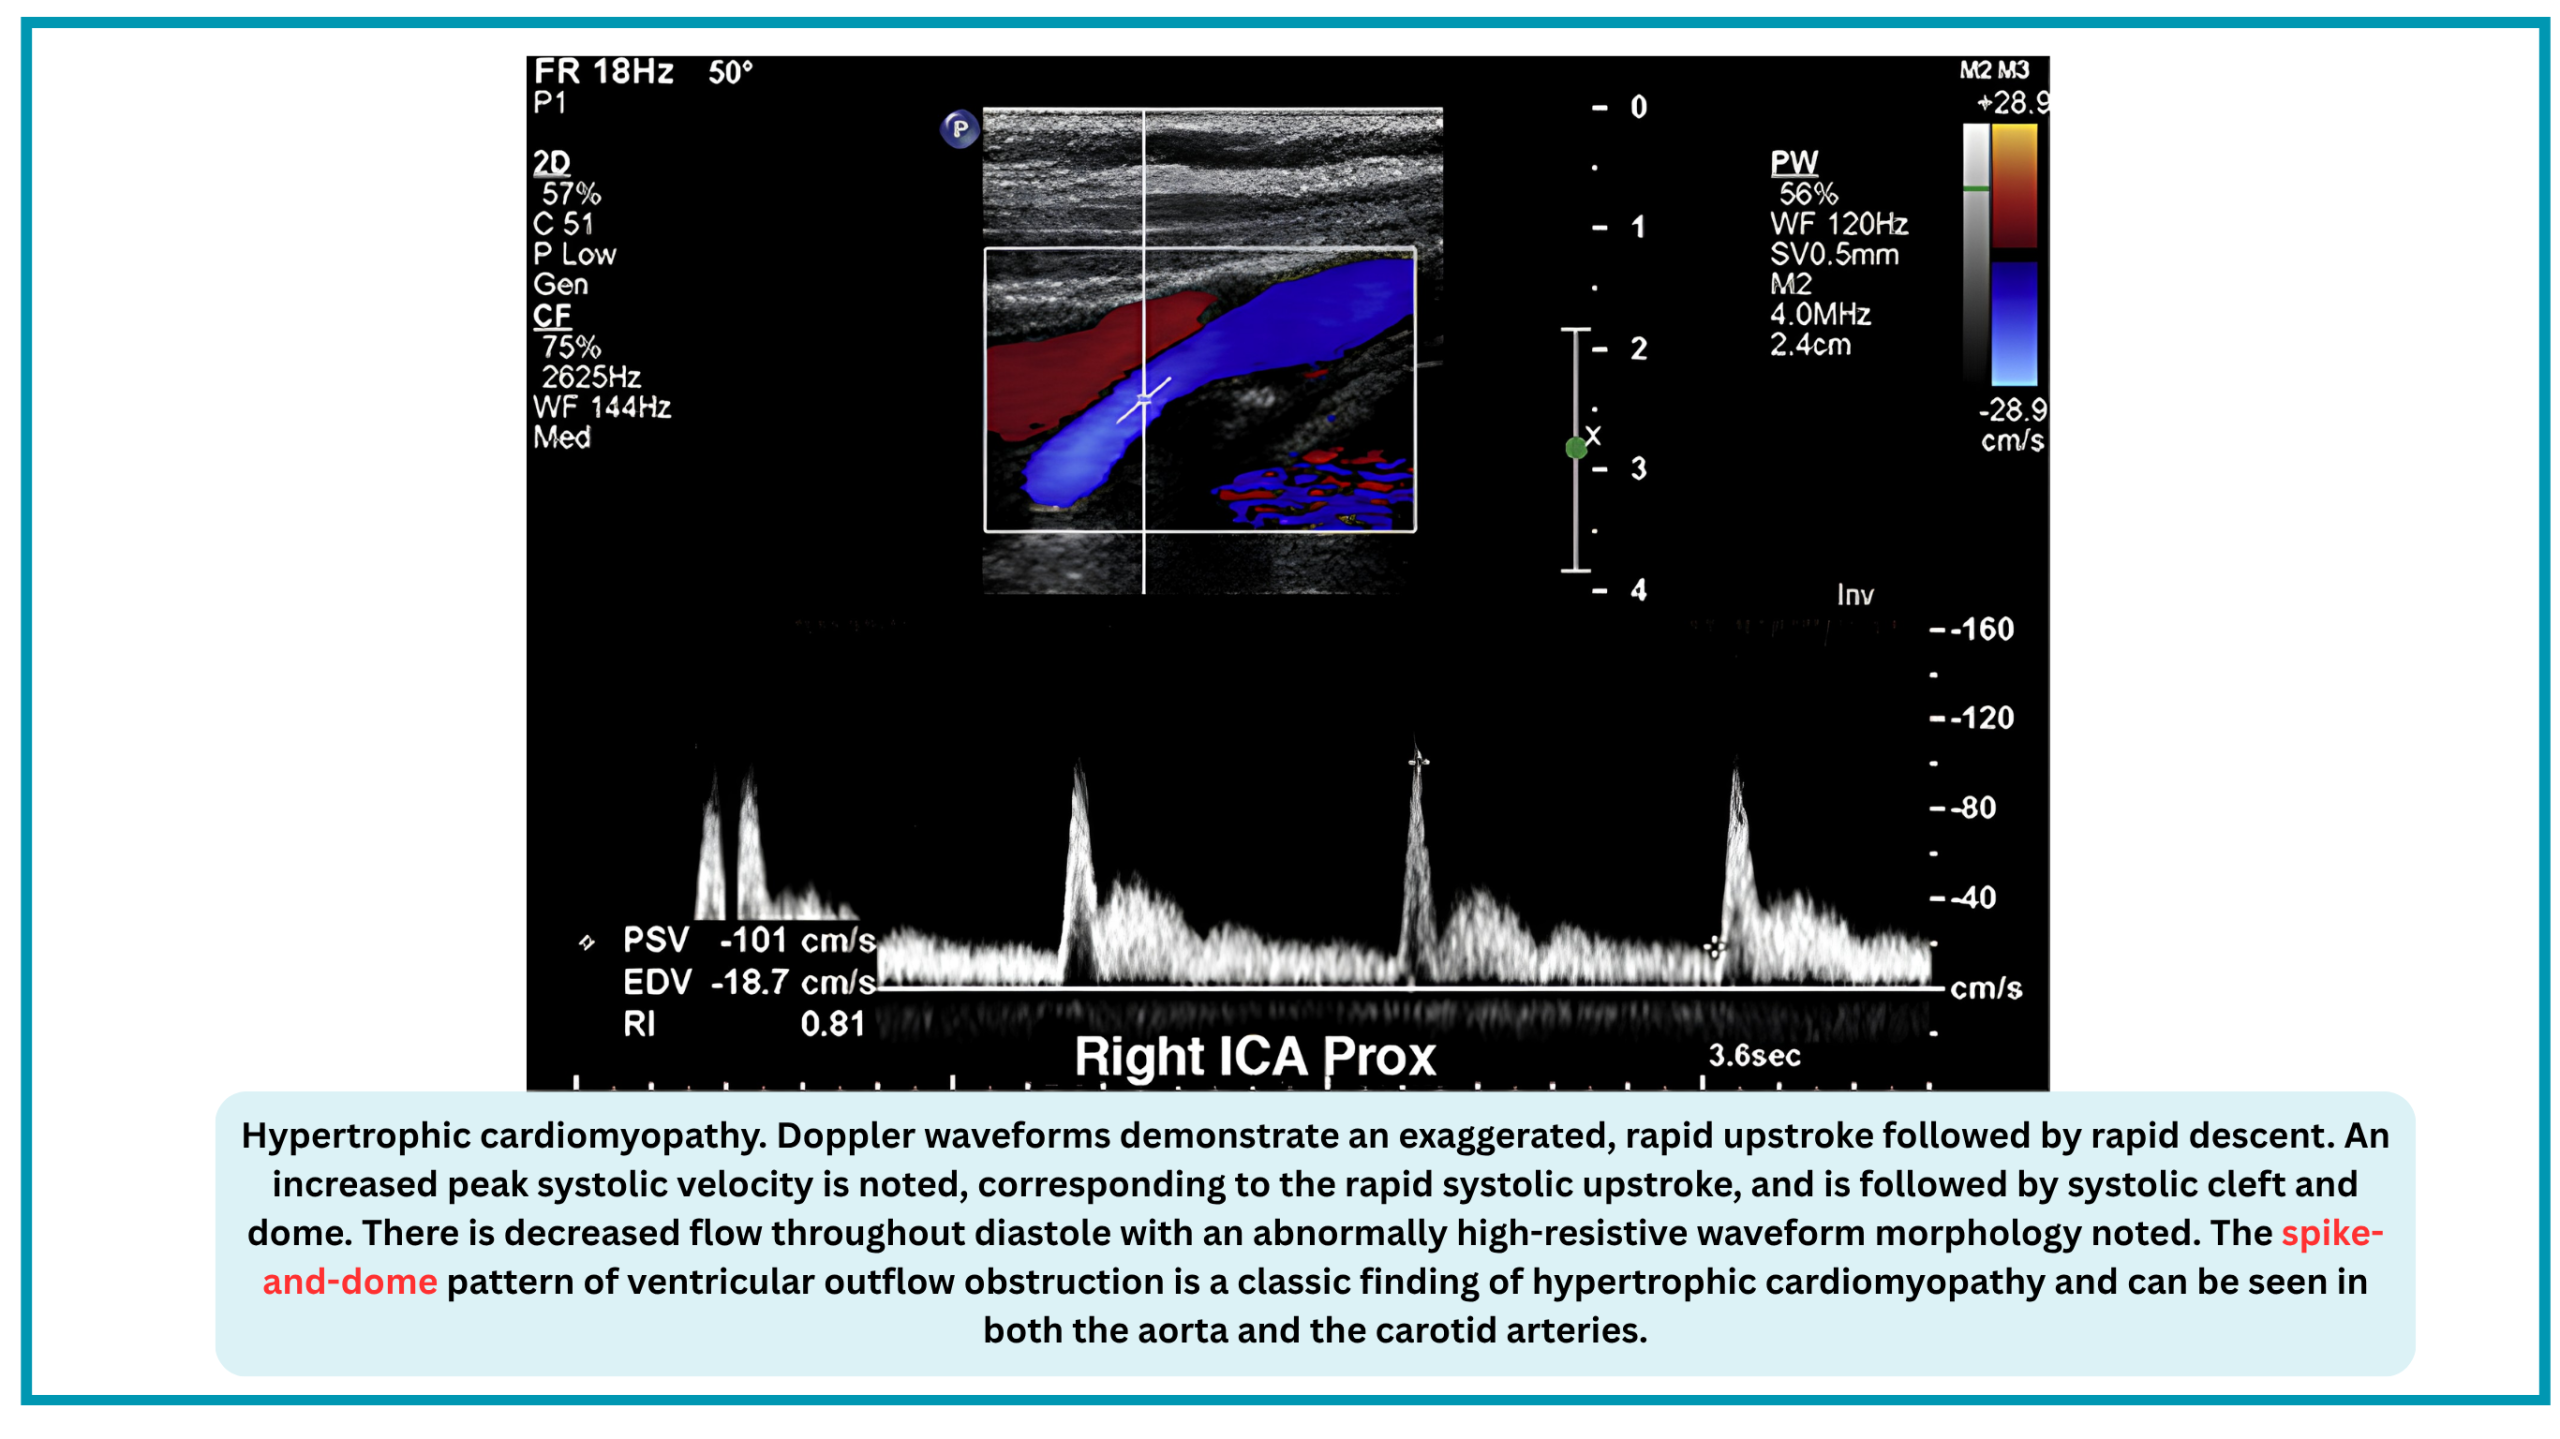
However, the same PSV used for stenosis grading can be distorted by cardiac pathology—independent of any carotid lesion. A tardus-parvus waveform may signal severe aortic stenosis; a bisferiens pattern may indicate aortic regurgitation; a spike-and-dome morphology may reveal hypertrophic cardiomyopathy. Recognizing these patterns is essential to avoid misdiagnosis and to guide appropriate management.
This section reviews the technical acquisition, quantitative indices, and waveform interpretation of carotid Doppler—integrating its hemodynamic, cardiac, and cerebrovascular applications into a unified bedside assessment.
Carotid Doppler for Hemodynamic Assessment
In the critical care setting, carotid Doppler is not used to grade stenosis, but to assess forward flow and fluid responsiveness at the bedside.
- Carotid Doppler allows real-time, non-invasive tracking of stroke volume trends—making it a practical tool for guiding fluid resuscitation when invasive monitoring is unavailable or impractical.
- Predicting Return of Spontaneous Circulation (ROSC) During CPR
- A prospective study of 51 cardiac arrest patients found that carotid Doppler-derived parameters—including velocity-time integral (VTI), peak systolic velocity (Vmax), minimum velocity (Vmin), time-averaged velocity (TAV), and resistive index (RI)—differed significantly between patients who achieved ROSC and those who did not *.
🩺 Hemodynamic Assessment — Fluid Responsiveness & ROSC Prediction
| Parameter | How It Is Measured & Normal Range | Clinical Application |
|---|---|---|
| Corrected Carotid Flow Time (ccFT / FTc) | Systolic time (onset of upstroke to dicrotic notch) divided by the square root of the cycle time (Bazett's formula) or corrected using Wodey's equation. Normal: 325 ± 22 ms0.5 (range ~300–350 ms0.5). A change of +7 ms after passive leg raise predicts fluid responsiveness. |
Duration of mechanical systole is directly proportional to stroke volume; tracks SV changes and fluid response. |
| Carotid Velocity-Time Integral (VTIc) | Area under the systolic velocity-time curve (cm) over one cardiac cycle. Normal: No universally established range; trends are more useful. A +18% increase after preload augmentation suggests fluid responsiveness. |
Direct surrogate of stroke volume (distance blood travels per beat). |
| ΔCPSV (Carotid Peak Systolic Velocity Variation) | Respiratory variation in carotid PSV in mechanically ventilated patients. Threshold: AUC 0.93 for predicting fluid responsiveness in septic shock. |
Highly accurate, comparable to invasive pulse pressure variation (PPV). |
| ΔCVTI (Carotid Velocity-Time Integral Variation) | Respiratory variation in carotid VTI in mechanically ventilated patients. Threshold: AUC 0.90 for predicting fluid responsiveness in septic shock. |
Non-invasive alternative to PPV. |
| Carotid Artery Doppler Flow Velocity (CADFV) | Measured flow velocity in the carotid artery. Finding: Lower CADFV significantly associated with mortality in septic shock. |
Correlates moderately with CVP and IVCCI; prognostic marker. |
| Carotid VTI (during CPR) | Velocity-time integral obtained during chest compressions. Finding: Higher VTI associated with ROSC. |
Reflects cerebral perfusion during CPR; predicts ROSC. |
| Peak Systolic Velocity (Vmax) during CPR | Highest velocity during systole from compressions. Finding: Higher Vmax associated with ROSC. |
Reflects forward flow generated by compressions. |
| Minimum Velocity (Vmin) during CPR | Lowest velocity during decompression phase. Finding: Higher Vmin associated with ROSC. |
Reflects diastolic flow during decompression. |
| Time-Averaged Velocity (TAV) during CPR | Mean flow velocity over the cardiac cycle. Finding: Higher TAV associated with ROSC. |
Reflects mean cerebral perfusion during CPR. |
| Resistive Index (RI) during CPR | (PSV − EDV) / PSV obtained during compressions. Finding: Lower RI associated with ROSC. |
Reflects downstream cerebral resistance during CPR. |
Clinical application:
- Carotid Doppler allows real-time, non-invasive tracking of stroke volume trends—making it a practical tool for guiding fluid resuscitation when invasive monitoring is unavailable or impractical.
- Carotid Doppler during CPR provides real-time feedback on the adequacy of chest compressions and may guide resuscitation efforts by identifying patients with a higher likelihood of ROSC.
Carotid Doppler for Cardiac Disease Detection
The same PSV used for hemodynamic assessment and stenosis grading can be altered by cardiac pathology, independent of any carotid lesion. This is a critical pitfall: a low or high PSV may reflect the heart, not the carotid.
The following cardiac conditions produce characteristic carotid Doppler patterns that must be recognized *.
- Aortic regurgitation
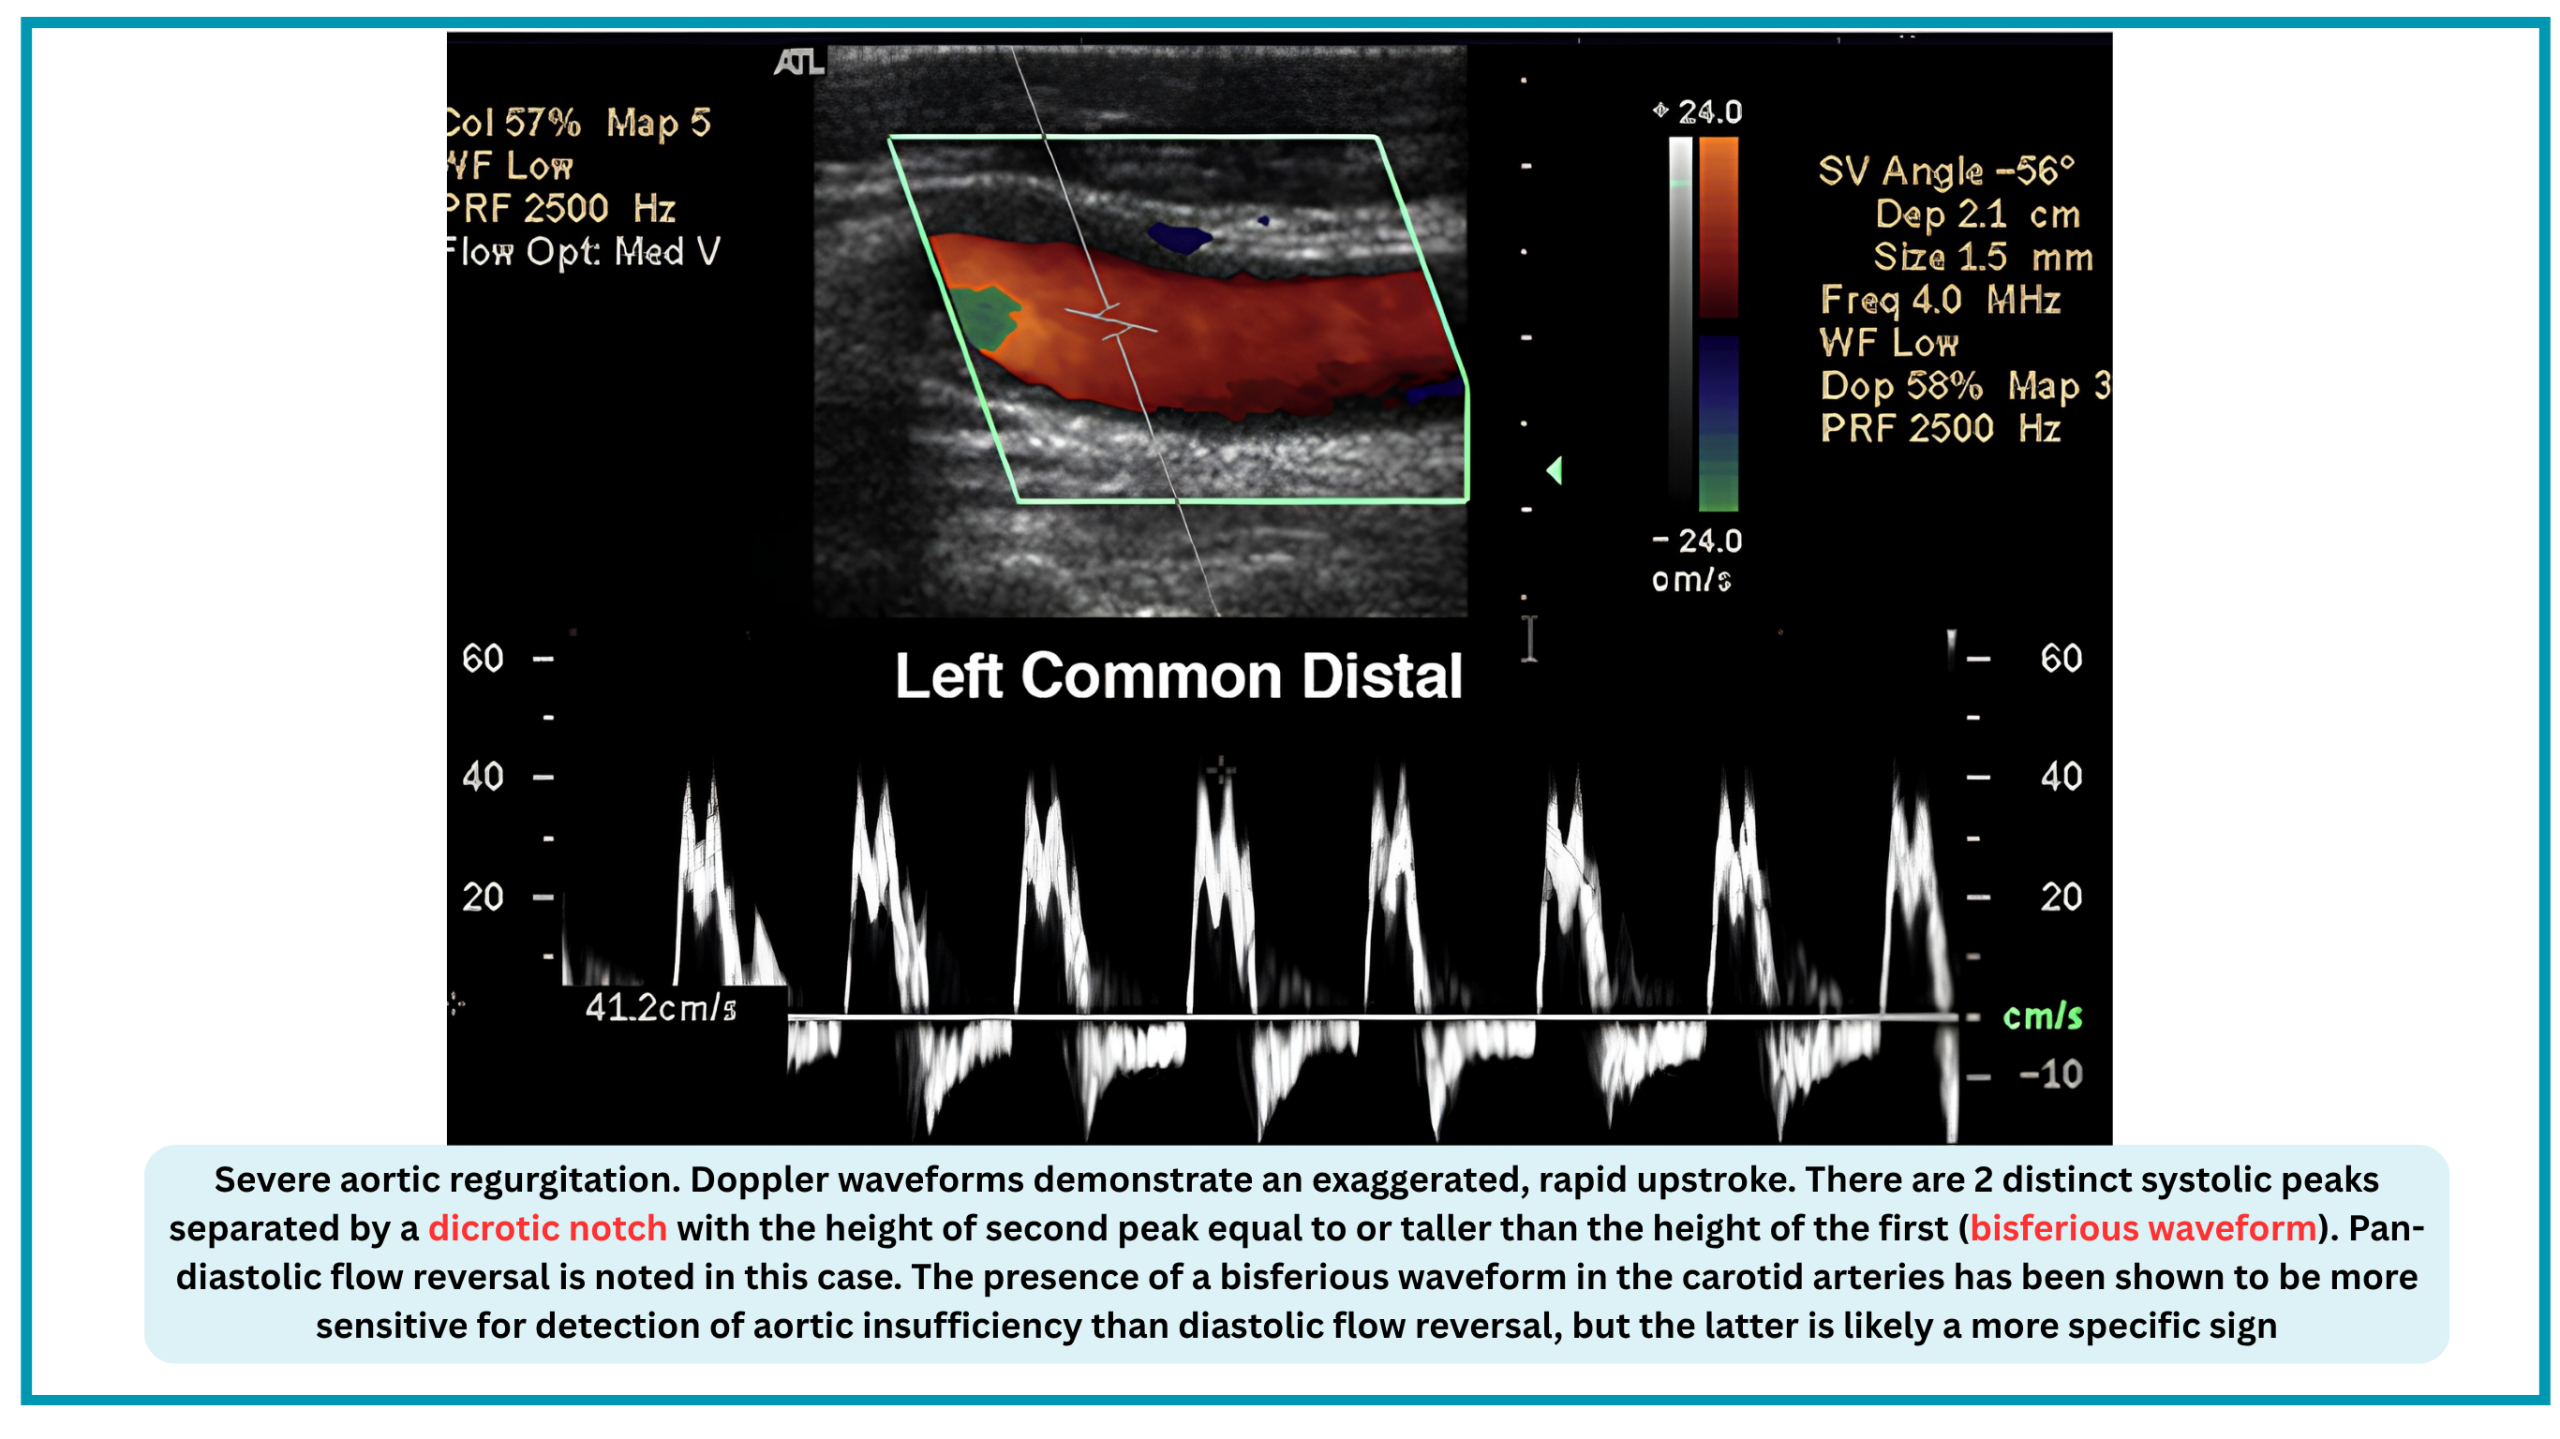
- The bisferious pulse (two systolic peaks) is characteristic of AR and is reversible after valve replacement *. Diastolic flow reversal and increased pulsatility index correlate with severity.
- Aortic stenosis
- Severe AS produces a delayed upstroke, increased acceleration time, decreased peak velocity, and rounded waveform. Systolic upstroke time (SUT) ≥180 ms in the common carotid artery is a criterion for critical AS. Importantly, severe AS can mask carotid stenosis by reducing supra-aortic flow velocities.
- Hypertrophic obstructive cardiomyopathy
- The bisferious or spike-and-dome pulse reflects dynamic outflow obstruction and correlates with SAM-septal contact timing *.
- Low cardiac output
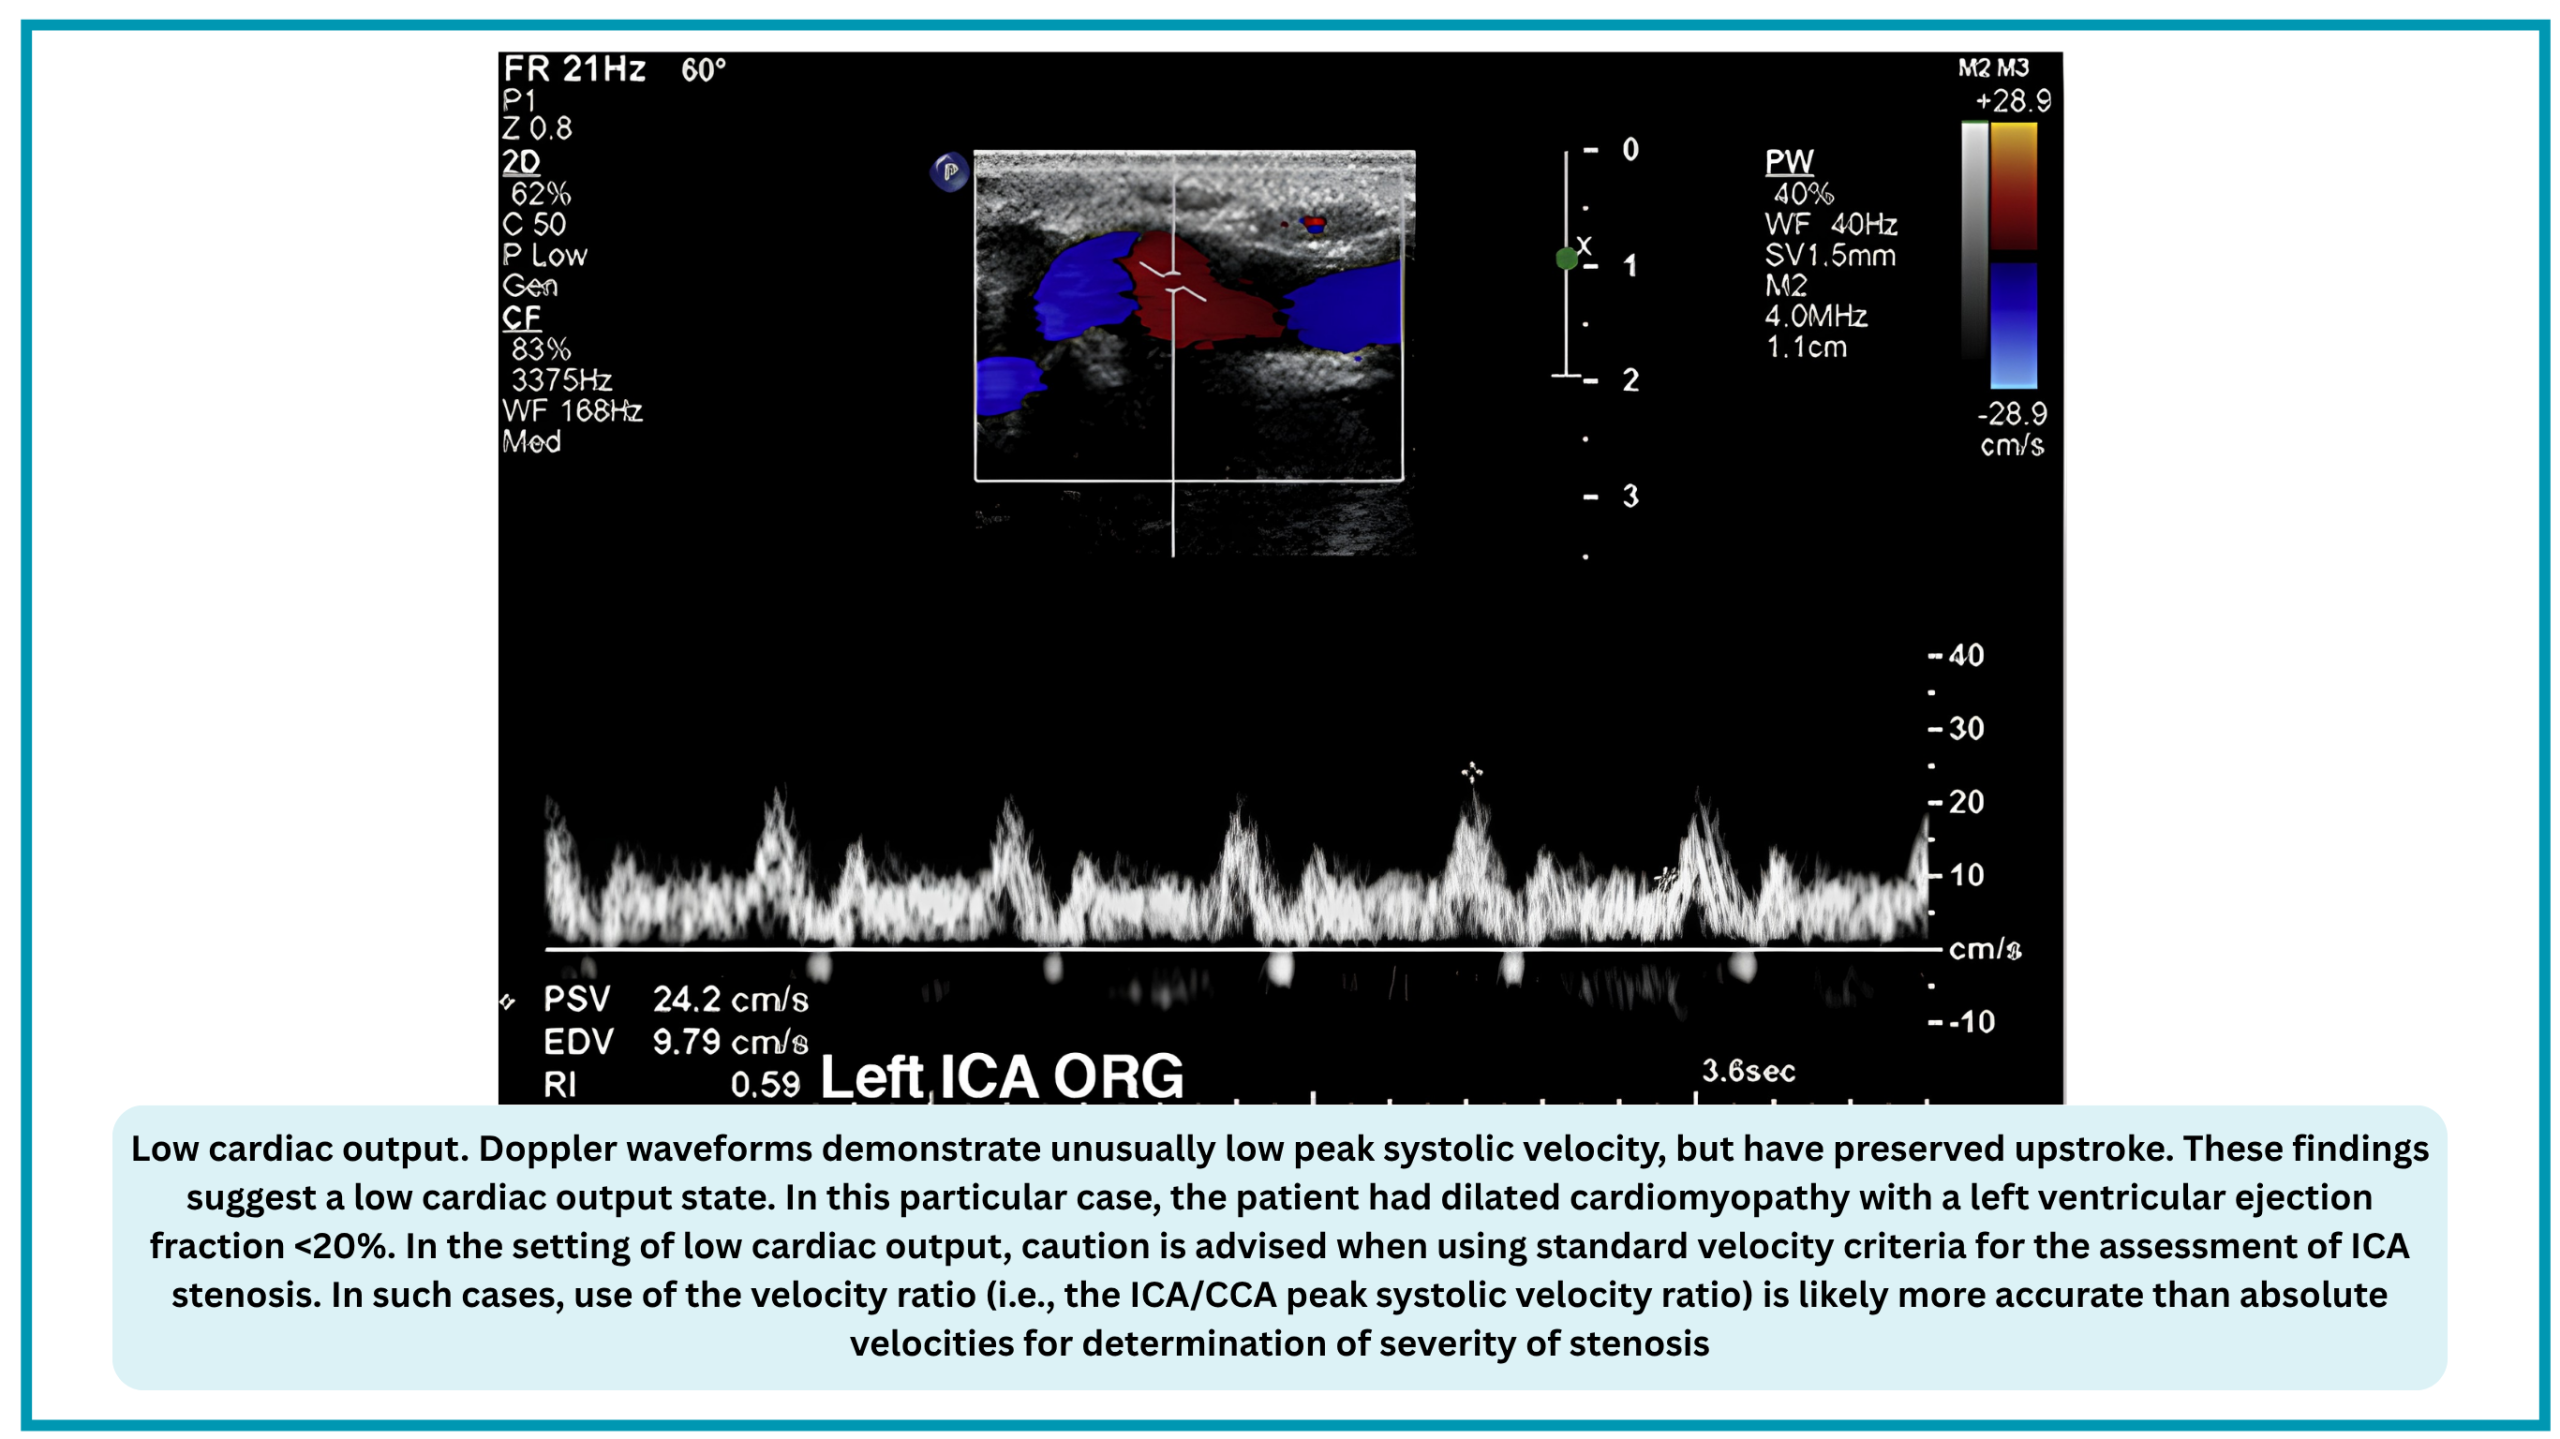
- Reduced flow velocities in the internal carotid, common carotid, and vertebral arteries may indicate low cardiac output states *.
- Mitral valve prolapse
- Early systolic flutter (ESF) on carotid Doppler is significantly associated with MVP and may suggest a cardiac source of emboli *
❤️ Cardiac Disease Detection — Carotid Doppler Waveform Patterns
| Cardiac Condition | Carotid Doppler Pattern & Mechanism | Impact on PSV |
|---|---|---|
| Severe Aortic Stenosis | Pulsus tardus et parvus — delayed systolic upstroke, blunted rounded peak. Mechanism: Fixed obstruction to LV outflow. |
Falsely low PSV — may underestimate or overestimate stenosis severity. |
| Severe Aortic Regurgitation | Bisferiens waveform — two systolic peaks with dicrotic notch; second peak ≥ first; pan-diastolic flow reversal. Mechanism: Rapid ejection, then regurgitant volume creates a second peak. |
Falsely elevated or distorted PSV — unreliable for stenosis grading. |
| Hypertrophic Cardiomyopathy (HCM) | Spike-and-dome — rapid upstroke, high PSV, systolic cleft, then dome; decreased diastolic flow (high-resistance pattern). Mechanism: Dynamic LVOT obstruction. |
Falsely elevated PSV — mimics stenosis. |
| Low Cardiac Output States | Low PSV with preserved upstroke. Mechanism: Reduced stroke volume from systolic dysfunction. |
Falsely low PSV — use ICA/CCA ratio instead of absolute velocities. |
| Intra-Aortic Balloon Pump (IABP) | Two systolic peaks per pulse — first from native LV contraction, second from balloon inflation; end-diastolic velocity indeterminate; flow reversal after augmented peak. Mechanism: Mechanical augmentation of diastole. |
PSV unreliable — use first (non-augmented) peak if IABP cannot be turned off. |
| Left Ventricular Assist Device (LVAD) | Low-velocity flow, delayed upstroke, loss of pulsatility (continuous flow pattern). Mechanism: Continuous pump flow. |
PSV unreliable — waveform morphology varies with pump settings. |

◾️Clinical significance: Why This Matters?
- The clinician performing carotid Doppler for hemodynamic assessment must be aware of these cardiac confounders for three reasons:
-
- Misdiagnosis of carotid stenosis: A low PSV from low cardiac output may be misinterpreted as "no significant stenosis" when a lesion is actually present; a high PSV from HCM may be misinterpreted as stenosis when none exists.
- Misinterpretation of hemodynamic data: A tardus-parvus waveform may be attributed to carotid disease when it actually signals severe aortic stenosis—a critical cardiac diagnosis.
- Therapeutic implications: Recognizing a bisferiens pattern or spike-and-dome morphology may be the first clue to aortic regurgitation or HCM, prompting formal echocardiography and altering management.

Add comment