

5 September 2023 by Shahriar Lahouti. Peer-reviewed by Mojtaba Chardoli. Last update 16 July 2025.
CONTENTS
- Preface
- Anatomic backbone
- End-organ injury
- Hemodynamic monitoring
- Macro-circulatory static variables
- Micro-circulatory static variables
- Principles of resuscitation in shock
- References
Preface
The primary goal of hemodynamic monitoring in critically ill patients includes making a diagnosis, assessment, and optimization of the circulatory system to ensure adequate tissue delivery of oxygen relative to tissue demand. Critical illness is associated with marked physiological stress and has a great dynamic impact on hemodynamic status. In recent years, new trends in patient diagnosis as well as monitoring the response to treatment have been changed from using invasive methods to non-invasive more efficient methods such as echocardiography. In contemporary hemodynamic monitoring, echocardiography plays a key role. Critical care echocardiography requires an understanding of the complex pathophysiology of the hemodynamics of circulatory failure and the integration of hemodynamic variables in appropriate clinical contexts concerning individual cardiovascular physiologic profiles.
This review aims to highlight the key role of echocardiography and explain the pathophysiology of hemodynamic variables interplay in the context of applied echocardiography. At the end of this post, the phases of resuscitation and general principles of hemodynamic resuscitation in specific clinical conditions are reviewed.
Anatomic backbone
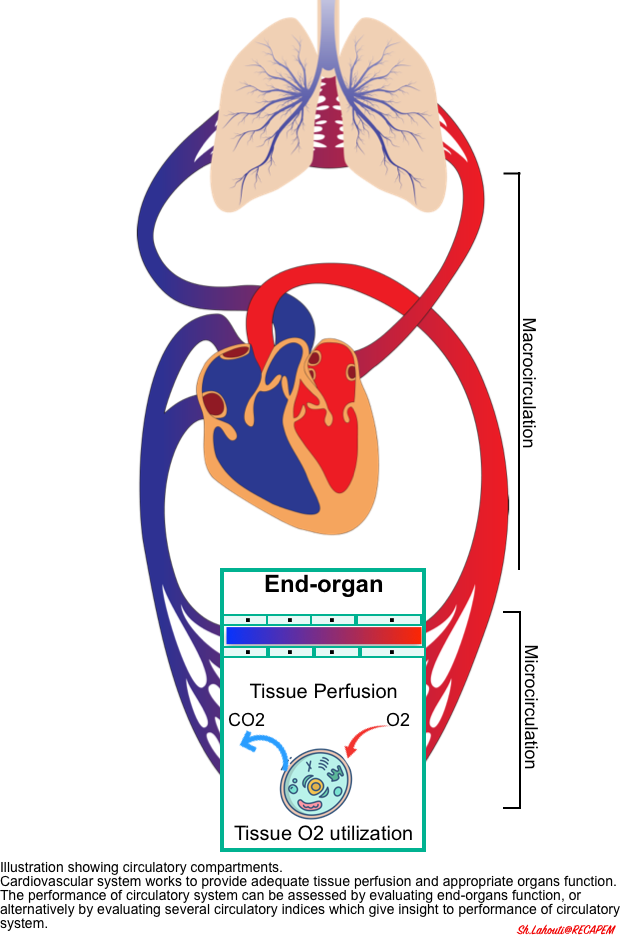
The essential function of the cardiovascular (CV) system is to provide optimal conditions for the body’s organs by establishing adequate tissue perfusion. Effective tissue perfusion is the interplay of upstream and downstream circulatory compartments, including (figure below):
- Upstream (macro-circulation)
- The heart, vena cava, pulmonary artery, and aorta provide blood flow and pressure gradient through the organs *.
- The majority of the existing hemodynamic variables (e.g. cardiac output, blood pressure, right atrial pressure) monitor macro-circulatory functions and will be discussed in detail in this post.
- Downstream (micro-circulation)
- The small vessels and capillary system work at the tissue level and contribute to the distribution of flow, supply of oxygen and nutrients, and elimination of waste products such as carbon dioxide *.
- Novel tools are developing to assess the alterations in tissue oxygenation and microvascular blood flow as well as organ function.
- The pathophysiology of end-organ dysfunction and the relevant markers (perfusion markers) are discussed in this post.
End-organ injury
Background
- Progressive cellular hypoxia and tissue injury can occur as a result of reduced tissue perfusion.
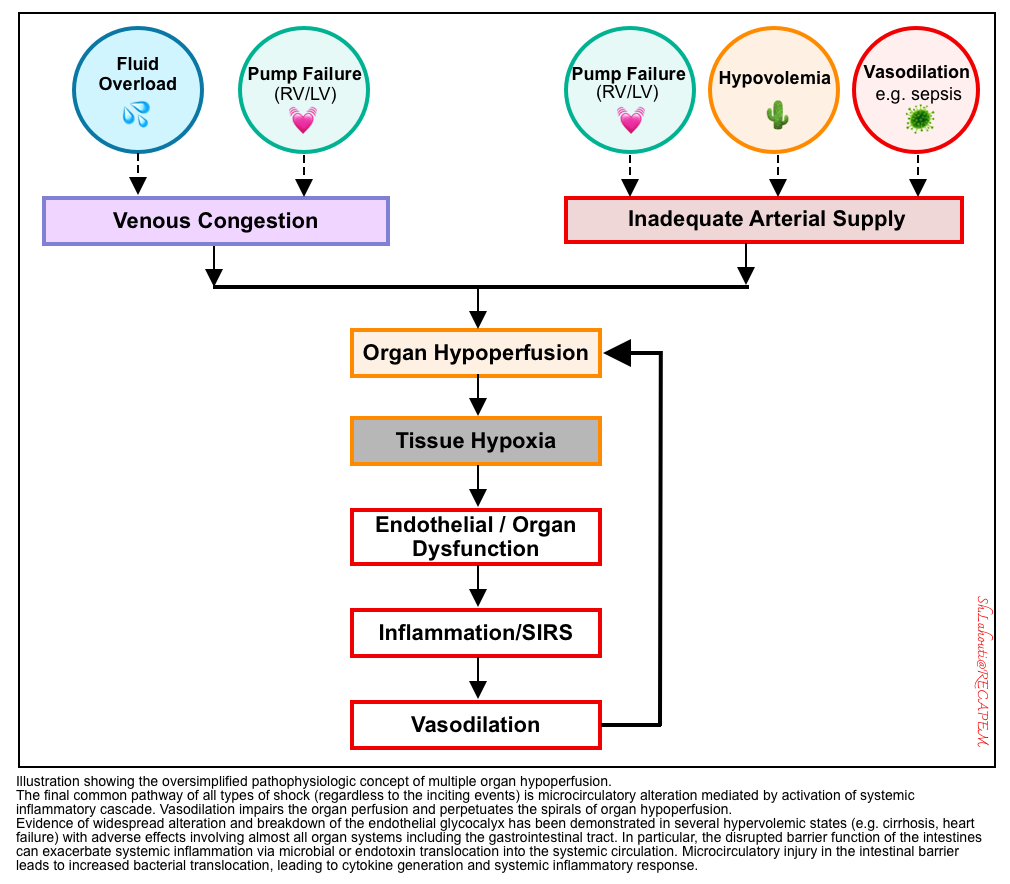
- Tissue perfusion can be reduced either due to inadequate forward flow, which results in ischemic organ injury, or it can happen secondary to congestion (e.g., fluid overload or elevated right atrial pressure), leading to edema formation and systemic organ congestion and injury (e.g., congestive hepatopathy) *. This concept is illustrated below.
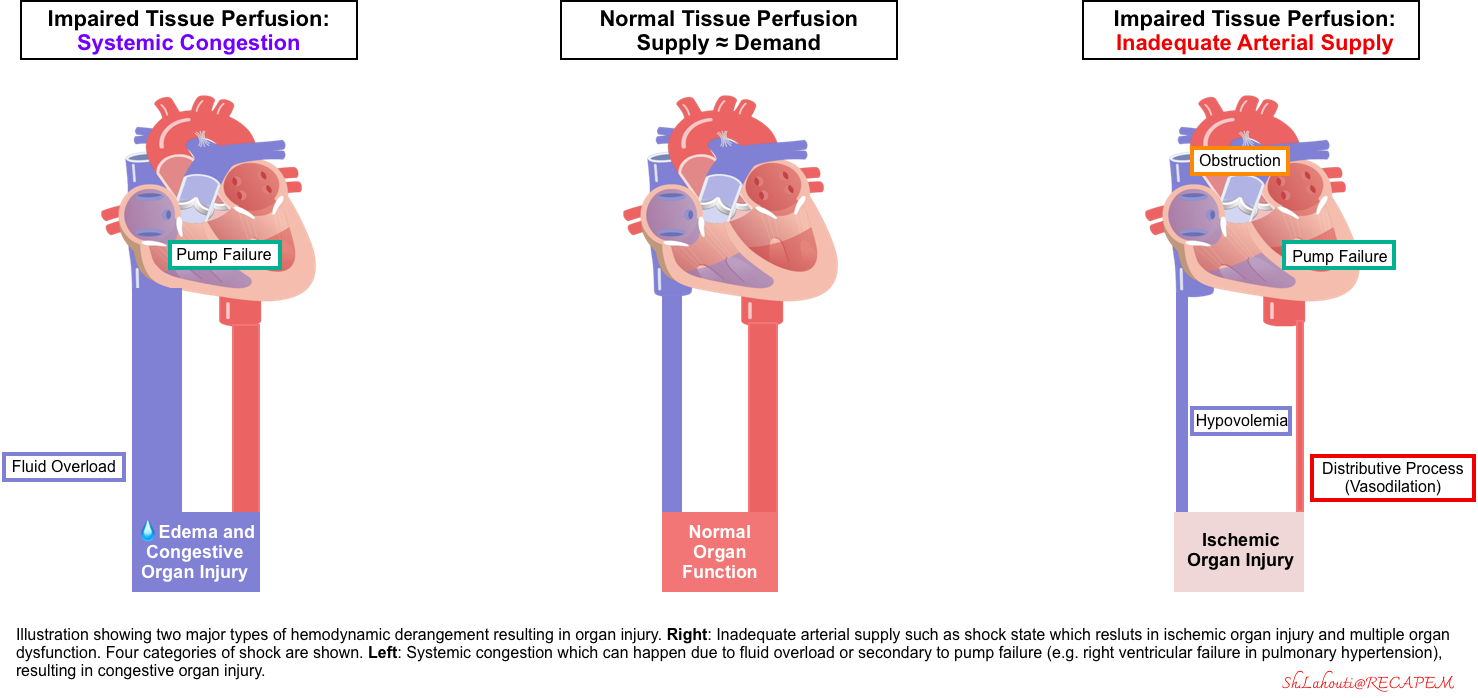
Spectrum of disease
- Regardless of the mechanism of circulatory failure, hemodynamic alteration often precedes clinical manifestation of organ dysfunction.
- This principle underscores the hemodynamic evaluation in critically ill patients, which allows early diagnosis and prompt correction of the underlying cause of circulatory failure.
- For example, in the setting of fluid overload, elevated right atrial pressure can be detected sooner than the overt manifestation of congestive organ failure.
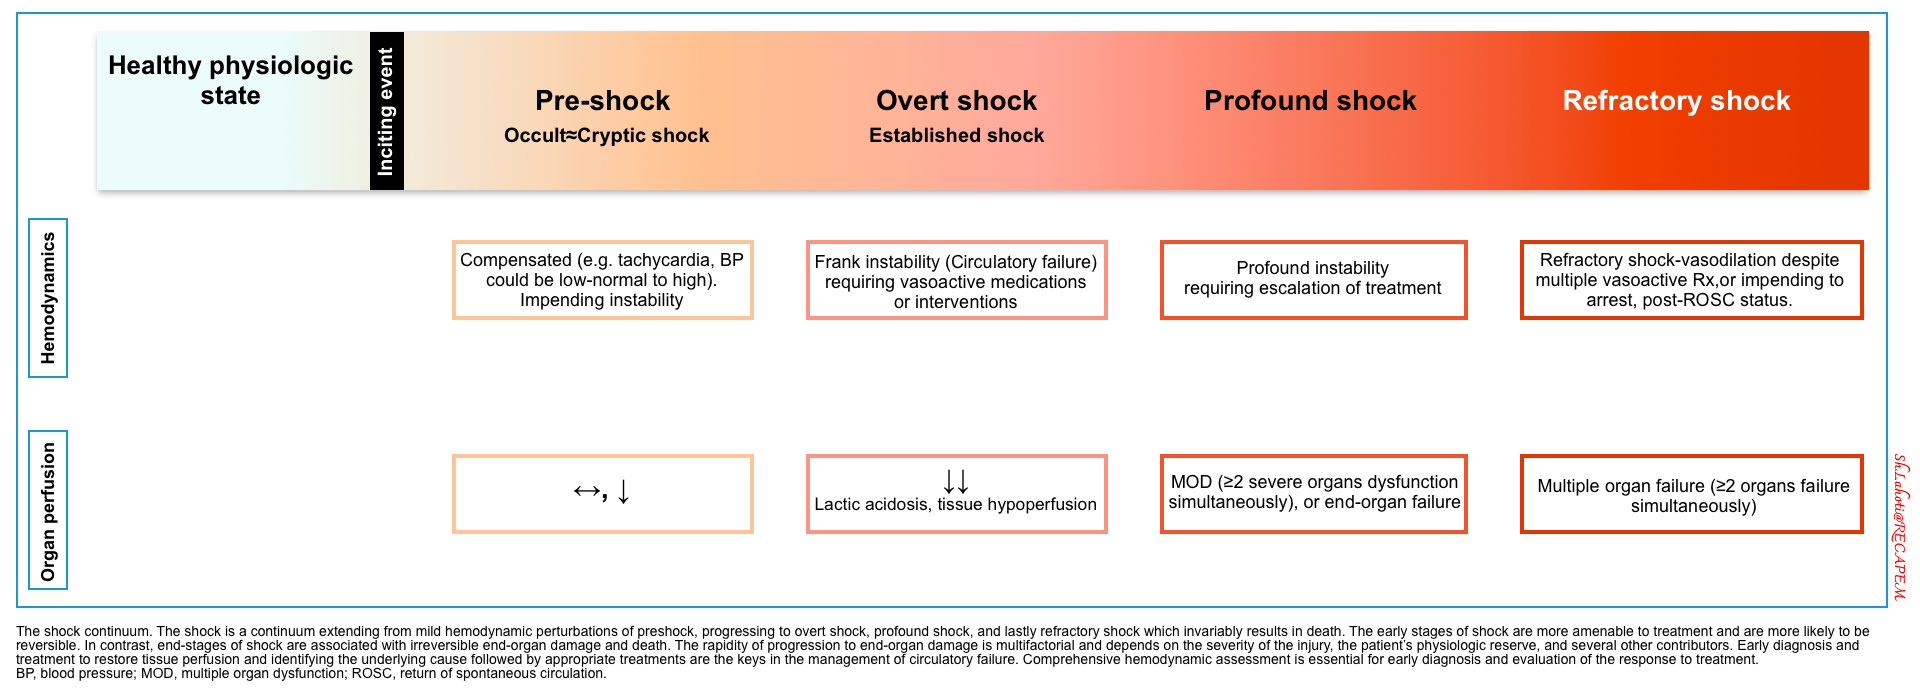
- The same principle is applied in the shock state. Shock is a physiologic continuum; beginning with an inciting event (e.g., focus of infection) which triggers pathophysiological changes that can progress through several stages (figure below) *. During the occult phase of shock, tachycardia and other compensatory responses take place before the overt manifestation of organ dysfunction (e.g,. altered level of consciousness).
Pathophysiology
- Endothelial disruption and generation of systemic inflammatory response are the final common pathways of end-organ hypoperfusion and congestion (figure below). These will cause vasodilation, which further perpetuates the spirals of organ hypoperfusion.
- Traditionally, shock has been classified based on systemic hemodynamic profile (e.g., hypovolemic, cardiogenic, obstructive, and distributive) *. However, this mechanistic classification of shock is an oversimplification *.
- Evidence of widespread endothelial alteration and breakdown has been shown in venous congestion, leading to worsening tissue edema and organ perfusion *,*.
- Traditionally, shock has been classified based on systemic hemodynamic profile (e.g., hypovolemic, cardiogenic, obstructive, and distributive) *. However, this mechanistic classification of shock is an oversimplification *.
Hemodynamic monitoring
- The rationale for hemodynamic monitoring includes:
- Diagnosis
- Initial hemodynamic evaluation helps diagnose the clinical state of cardiovascular insufficiency as well as provide pivotal clues for making a mechanistic diagnosis (e.g., cardiogenic vs. distributive shock).
- Specific pitfalls related to the diagnostic utility of hemodynamic variables are discussed below.
- Therapeutic and preventive
- Hemodynamic monitoring is the key to successful resuscitation. It will provide clues to choose the appropriate treatment and assess the response to such treatments. Therapeutic caveats for hemodynamic variables are discussed here.
- Monitoring critically ill patients is helpful to prevent organ injury even when the patient is stabilized.
- Diagnosis
Hemodynamic tool kit
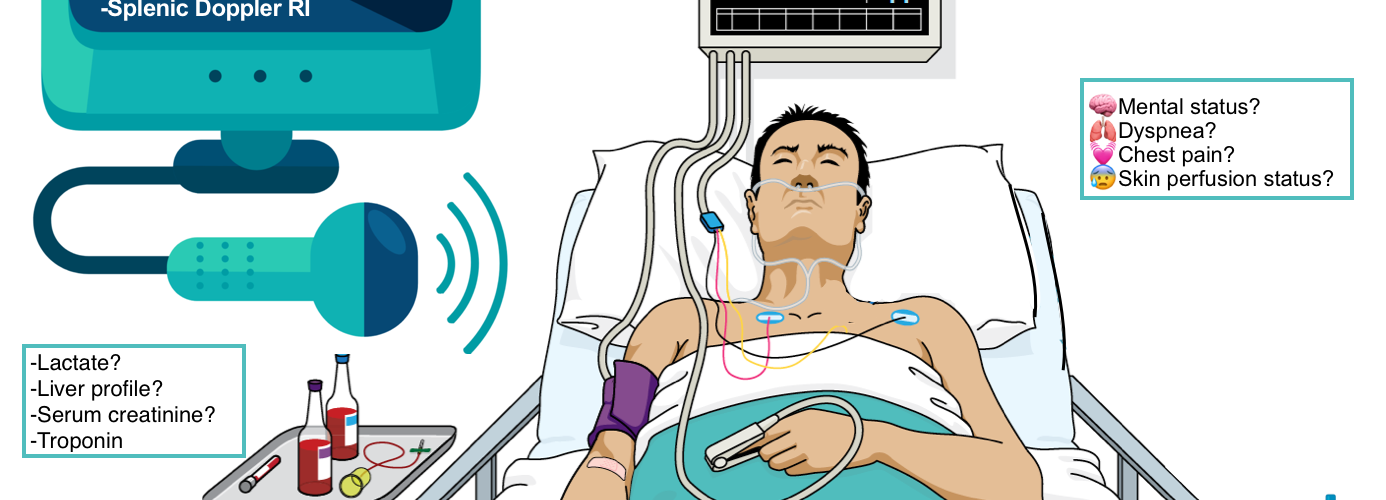
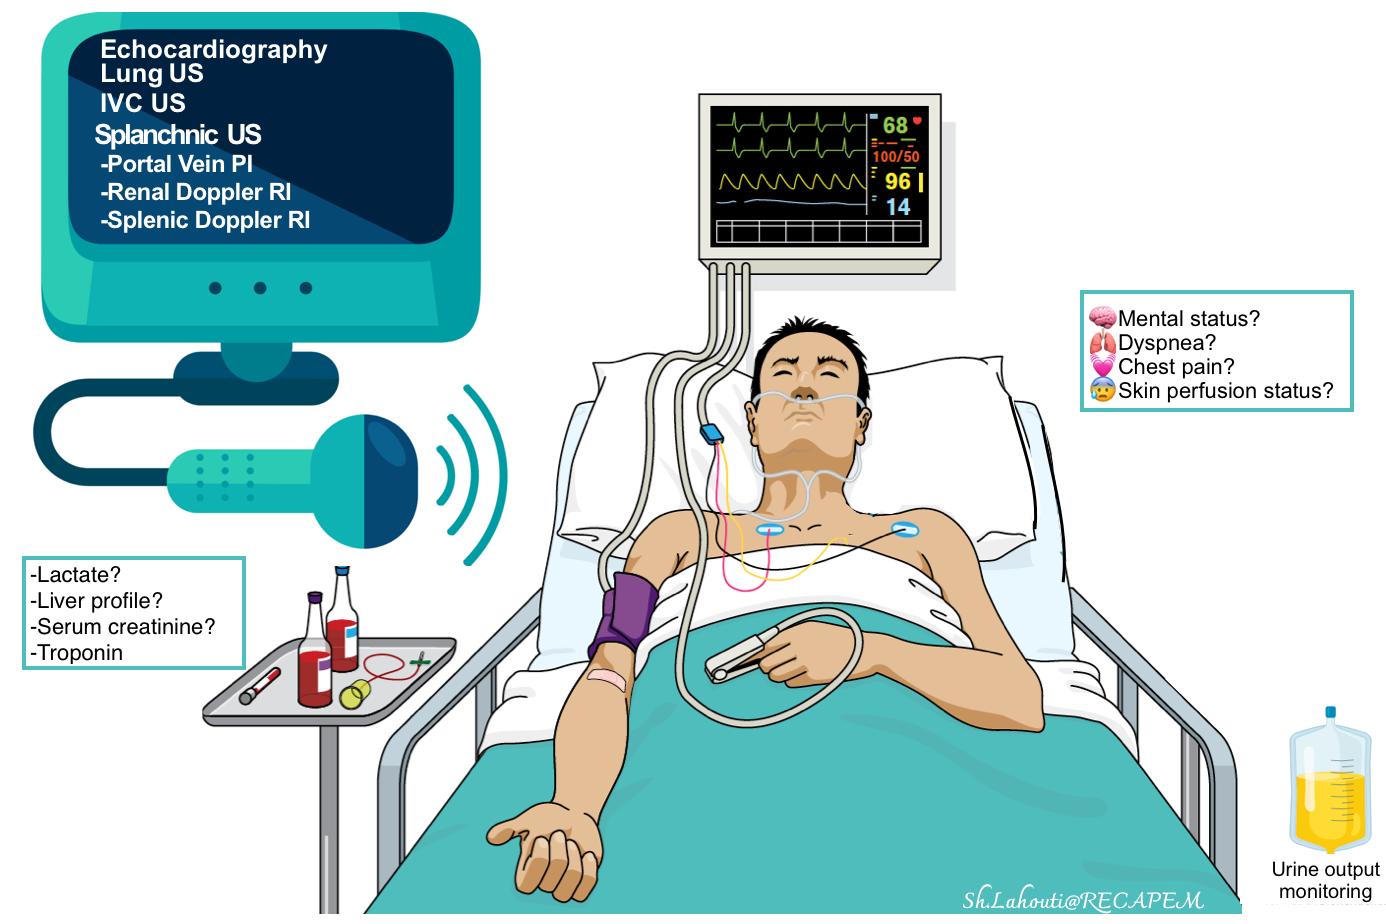
The most commonly available non-invasive methods include:
- Clinical:
-
- Mental status changes, skin perfusion status, urine output monitoring, etc.
- Cardiac and BP monitoring, pulse oximetry.
- Labs: Serum lactate level, liver profile, serum creatinine, etc.
- Diagnostic: Echocardiography and bedside ultrasound.
Echocardiography and bedside ultrasound
- A complete hemodynamic evaluation can be performed in critically ill patients by using echocardiography, and ultrasound of the abdomen and lungs *.
- Echocardiography
- It can noninvasively evaluate and track both RV and LV hemodynamic status *.
- Advantages of echo over invasive methods such as pulmonary artery catheterization (PAC):
- Several conditions can be diagnosed by echo (e.g. tamponade, aortic dissection, valvular lesions, dynamic LVOTO), whereas PAC is not helpful for the diagnosis of such these conditions.
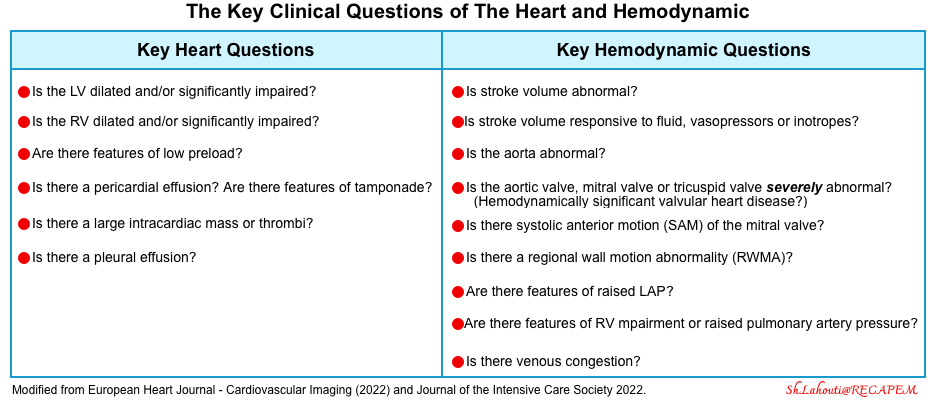
- Structured echocardiography answers the key clinical questions at the bedside (table below), while PAC will always reveal abnormal numbers, but it’s unknown what we should do with this data *. For example, there is no defined goal for cardiac output or systemic vascular resistance. A cardiac index that may be adequate for one patient will leave another patient in cardiogenic shock.
- Limitation:
- Echocardiographic information allows only to infer indirect inference on the adequacy of global body perfusion.
- Regional organ perfusion cannot be inferred by echo data.
- Echocardiographic data provides partial and indirect information regarding the vascular tone status.
- Echocardiography
-
- Doppler ultrasound of splanchnic veins (VExUS)
- Traditional central venous catheterization (CVC) for CVP monitoring is invasive, and the absolute CVP value does not necessarily predict whether venous flow is affected.
- VExUS is a non-invasive method for estimating CVP (which is roughly equal to right atrial pressure).
- It has high specificity for predicting acute organ injury, outperforming CVP and isolated IVC measurements *.
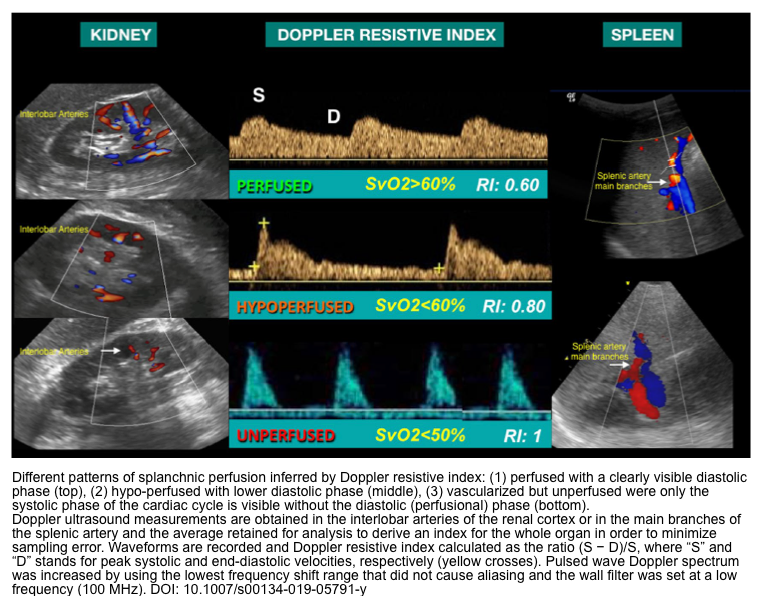
- Doppler ultrasound of splanchnic arteries
- Provide direct information regarding end-organ perfusion status.
- PW Doppler sampling of the kidney’s interlobar arteries and splenic artery flows allows for the calculation of the renal Doppler resistive index (RDRI) and the splenic Doppler resistive index (SDRI), which provide insight into the state of splanchnic perfusion *. More on this below.
- Lung ultrasound (LUS)
- Diagnosis value
- An integrated cardiopulmonary ultrasound is highly informative in patients with acute HF of any etiology and, more generally, in patients with acute respiratory failure and hypotension/shock *.
- It has a high negative predictive value (≈100%) to rule out the diagnosis of acute HF *. When multiple, diffuse, bilateral B-lines are present, LUS has a positive predictive value of 87% to rule in acute hemodynamic pulmonary edema.
- LUS may also reveal pleural effusion, which, when large, may contribute to dyspnoea and support the diagnosis of pre-existing heart failure.
- Monitoring and prognostic stratification
- Monitoring dynamic variations of B-lines in patients with acute HF allows us to better manage and titrate diuretic therapy *.
- The residual number of B-lines at discharge, as a sign of persistent subclinical congestion, has a high prognostic impact in predicting new hospitalizations for acute HF in the following months *.
- LUS can monitor the evolution of pneumothorax, as well as the extension of pulmonary consolidations.
- The appearance of B-lines during fluid administration without clinical improvement in hemodynamics can also be a sign of distributive shock *.
- It can be used to titrate ventilation parameters in intubated patients and to help understand the correct timing of weaning *.
- Diagnosis value
- Doppler ultrasound of splanchnic veins (VExUS)
Effective Monitoring
Hemodynamic monitoring requires a manifold approach, as its use is both context and disease-specific. There are several pitfalls in the appropriate use of variables for diagnosis and therapeutic purposes which will be reviewed here.
Diagnostic Role
Pitfalls
- No single variable is sensitive and/or specific enough to be used for identifying cardiovascular insufficiency *.
- For example, patients may have signs and symptoms of low perfusion (e.g., ↓urine output and cold mottled skin), despite a MAP of > 65mmHg.
- The hemodynamic variables may be clouded by preexisting diseases or medications.
- As an example, tachycardia as a compensatory reflex to hypotension may not be seen in the elderly, diabetic, and patients who take beta-blockers.
Effective strategy
- Multidimensional assessment: Collect and collate all feasible information, including multiple hemodynamic variables.
- Any single hemodynamic variable should be placed in its clinical context and used in conjunction with other hemodynamic variables to create a comprehensive hemodynamic profile *.
Therapeutic Role
- Upstream variables such as BP or CO do not provide accurate information regarding tissue perfusion status.
Effective strategy#1
- In the absence of widely available devices that directly measure tissue perfusion, use perfusion parameters (e.g. skin perfusion, urine output, level of consciousness) in conjunction with traditional macrocirculatory markers (e.g. BP, RAP, CO) as well as other echocardiographic data (e.g. status of LV/RV function) to guide resuscitation.
Pitfall #2
- Interpretation of hemodynamic variables is complex. The related values are often confounded by the patient’s comorbidities, the pathophysiology of the underlying disease, and the time point in the disease process.
Effective strategy#2: Interpretation of variables should be made in the context of the patient, pathophysiology, and the time point in the disease process.
- ⚠️Avoid adjusting any abnormal value toward normal.
- The hemodynamic data should be interpreted in the clinical context. The belief that any values should be adjusted towards normal is not correct.
- For example, in a patient with chronic atrial fibrillation in septic shock, tachycardia in the range of < 150 bpm is a compensatory mechanism. In the absence of structural heart disease (that is poorly tolerant to tachycardia e.g., MS, diastolic HF, PH), attempting to “normalize” the heart rate will reduce the cardiac output. Such patients may benefit from “permissive tachycardia“.
- Another example is trying to normalize elevated SBP (sometimes can reach in the range of 200 mm Hg) in hypertensive hyperadrenergic tamponade *. These patients with cardiac tamponade often have a history of HTN and advanced CKD. Antihypertensive medications will blunt physiologic compensatory responses and cause worsening hemodynamic status.
- The hemodynamic data should be interpreted in the clinical context. The belief that any values should be adjusted towards normal is not correct.
- ⚠️Avoid “one-size-fits-all” approach
- Personalize the resuscitation endpoints (e.g., MAP, skin perfusion) *.
- The cardiovascular disturbances that characterize the shock state vary from one patient to another and can also change over time in the same patient. Therefore, different therapies (fluids, vasopressors, and inotropes) should be individually and carefully adapted to provide personalized and adequate treatment *.
- For example, a MAP of 65 mm Hg may be low in patients with chronic hypertension or may be high in patients with cirrhosis.
Pitfall #3
- Most commonly measured hemodynamic variables are static variables, which measure the current hemodynamic status, while what is desired is the responsiveness of the circulatory system to a treatment that improves patient-centric outcomes (e.g., ↓ICU length of stay, ↓hypotension time, ↓complications e.g., AKI) *,*.
Effective strategy#3
- Evaluate the response to treatment by monitoring dynamic variables. This concept is called functional hemodynamic monitoring.
- Fluid responsiveness (FLR)
- It is defined based on achieving an increase in cardiac output by >15% following administration of 500mL crystalloid IV fluid over 10-15min *.
- For fluid administration to improve cardiac output, both the right and the left ventricles must be functioning on the steep part of the Starling curve (wherein increased filling improves cardiac output).
- The presumption is that increased cardiac output will lead to increased oxygen delivery (DO2) and increased tissue utilization. However, this is not always the case, and may not benefit the patient anyway! More on this 👉 Myth-busting the fluid bolus (PulmCrit)
- How to predict FLR? Some predictive parameters are:
- For more on this, see Media below.
- It is defined based on achieving an increase in cardiac output by >15% following administration of 500mL crystalloid IV fluid over 10-15min *.
- Inotrope responsiveness: Epinephrine challenge, dobutamine challenge.
- Epinephrine challenge is reasonable in patients who are not responding well to norepinephrine.
- Indications
- Hypoperfusion (e.g., poor urine output, cold extremities, mottling, poor capillary refill), plus
- Some indicators that epinephrine might help, for example:
- POCUS shows an ↓ejection fraction.
- Heart rate is inappropriately slow or normal (e.g,. <80 bpm)
- Lactate is inappropriately low relative to the severity of illness (inappropriate normolactatemia, suggesting inadequate endogenous epinephrine release).
- Hypoperfusion (e.g., poor urine output, cold extremities, mottling, poor capillary refill), plus
- Contraindications
- Significant tachycardia (e.g. heart rate >120 bpm)
- Echocardiography shows that LV is already hyperkinetic.
- How to perform an epinephrine challenge test?
- Give a low-dose epinephrine infusion (e.g., ~4-5 mcg/min), and assess the patient’s response based on clinical and echocardiographic variables.
- Epinephrine responsiveness is suggested by observing favorable responses of hemodynamic variables such as:
- Increasing MAP. Able to titrate down norepinephrine by >> 5mcg/min.
- HR in the range of 80-120 bpm (note that HR >130 bpm is an unfavorable response).
- Skin: No mottling, warmer extremities, improving capillary refill time.
- Urine output > 0.5 cc/kg/h.
- Fluid responsiveness (FLR)
Hemodynamic Variables
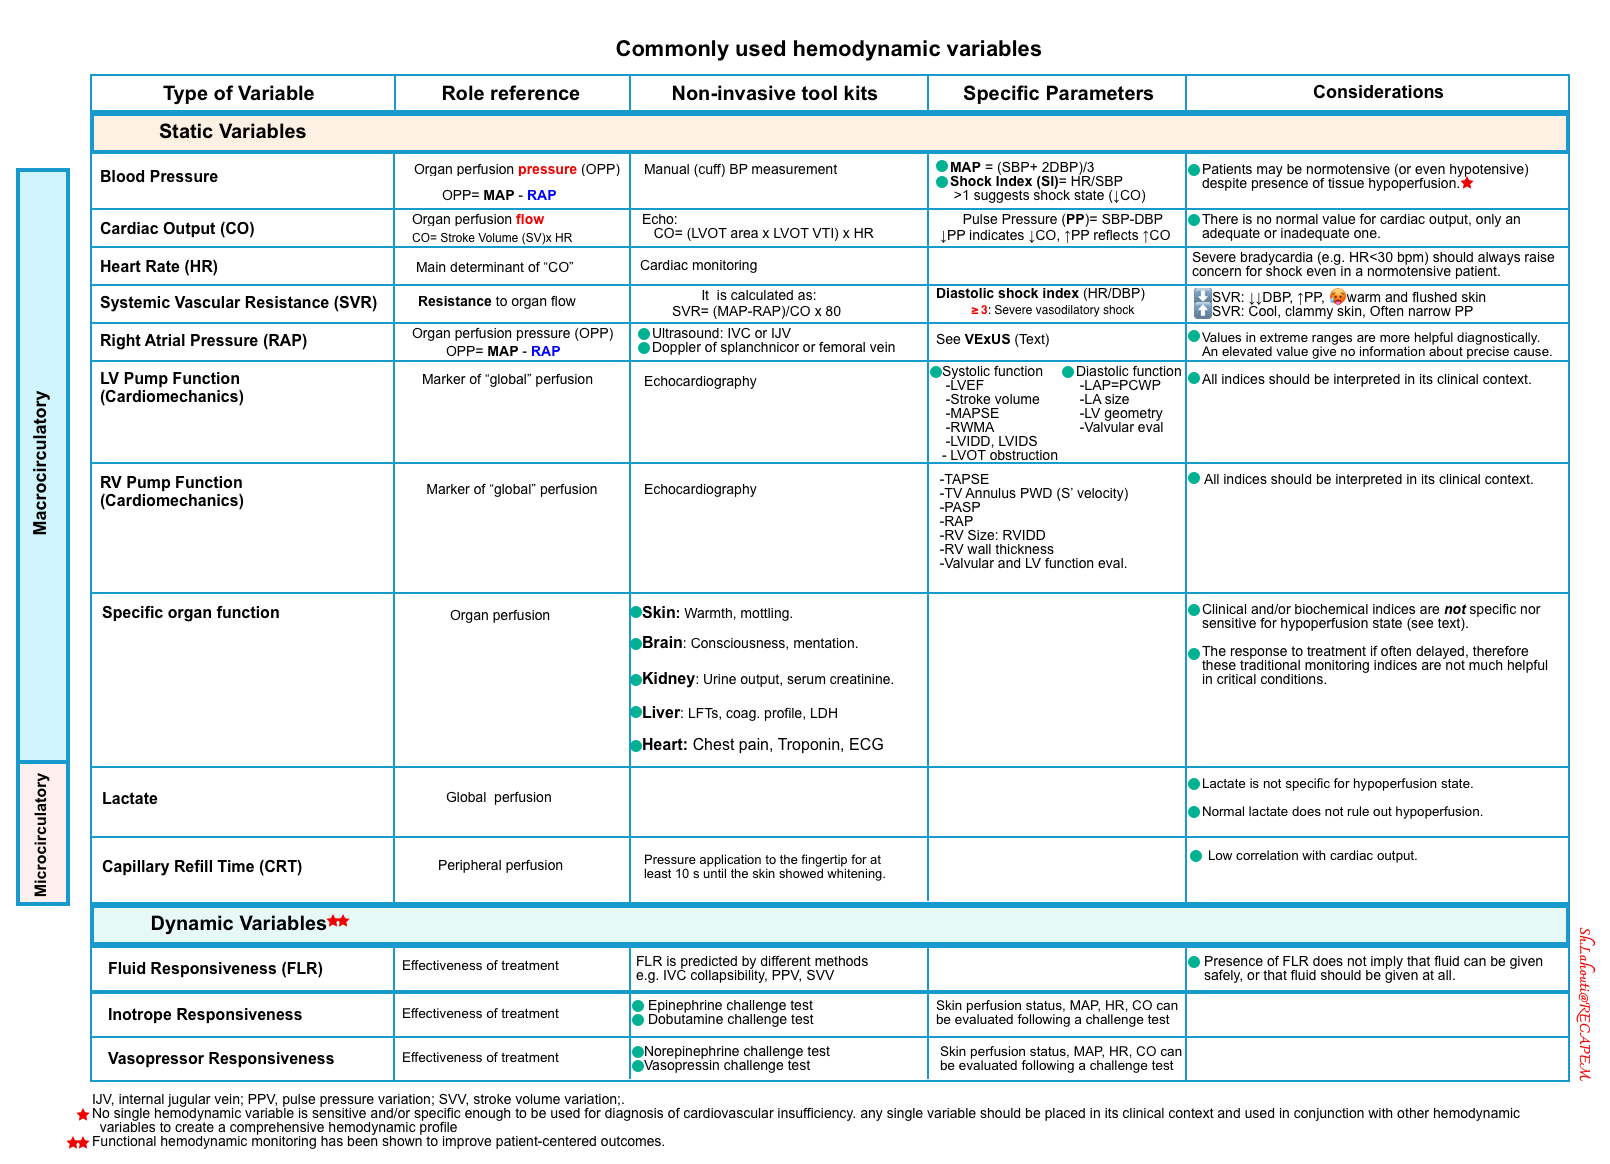
The commonly used hemodynamic markers of macrocirculatory and microcirculatory function are summarized in the table below. These markers will be explored in this post (click on the image to enlarge). For the reference range of variables (measured by PAC), see appendix.
Organ perfusion
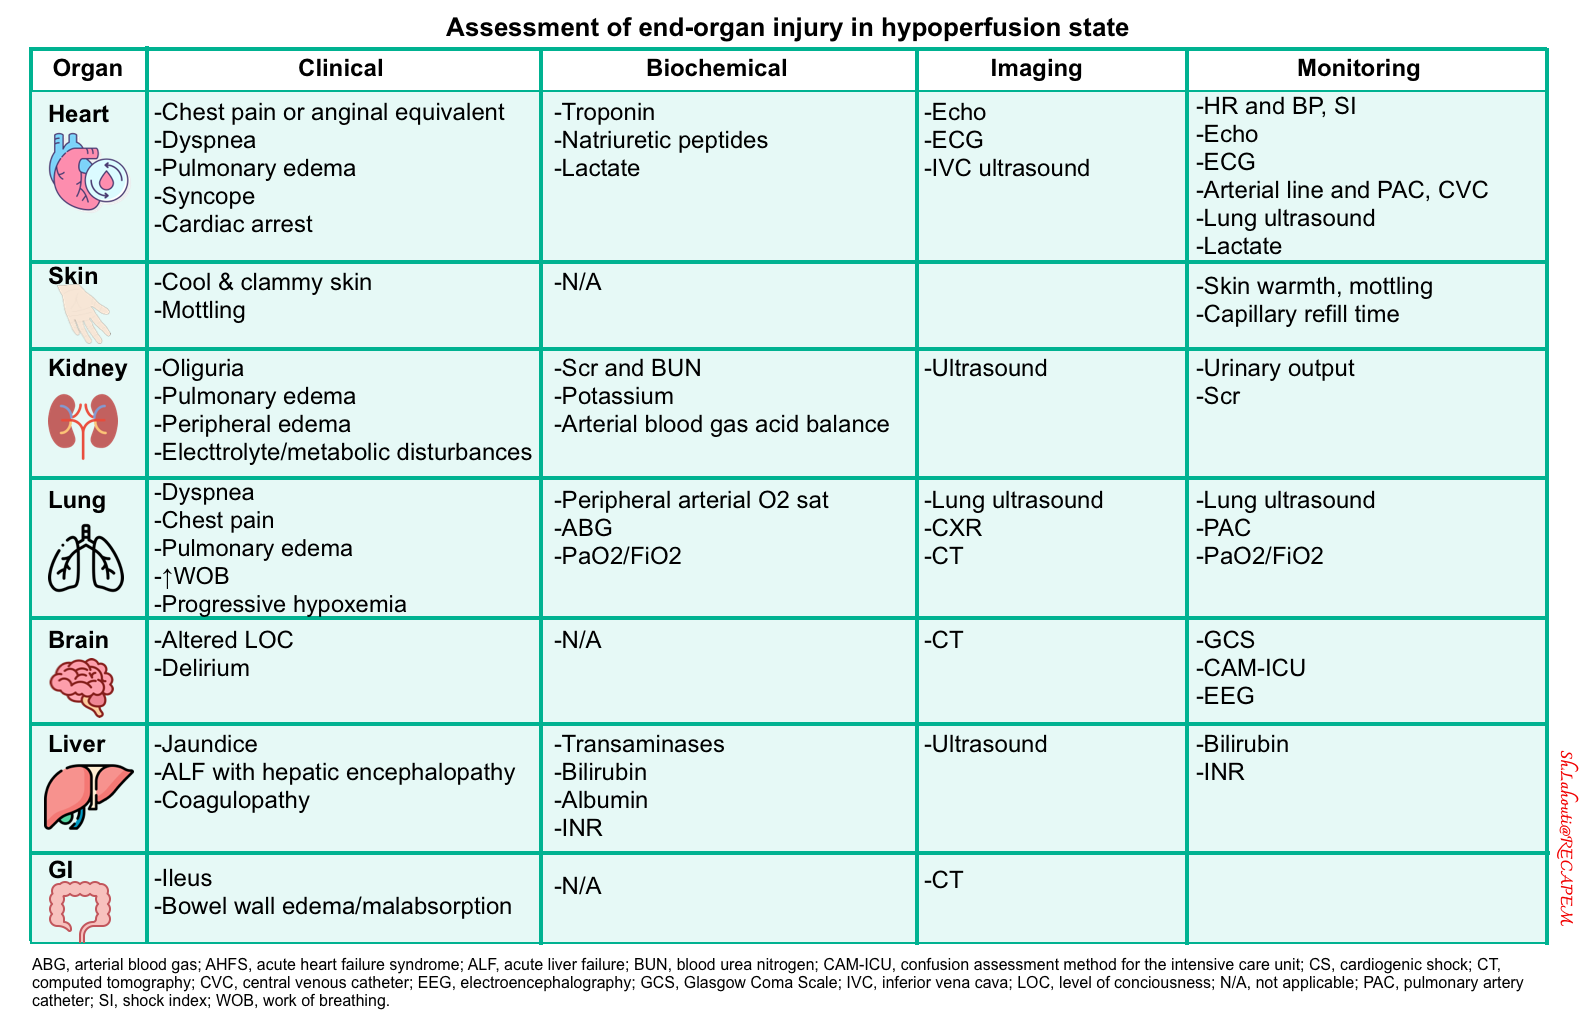
Assessment of organ perfusion is essential for the initial diagnosis and management of the shock state. Monitoring for biochemicals and clinical signs and symptoms of end-organ hypoperfusion is the cornerstone of non-invasive hemodynamic monitoring.
- ⚠️Pitfalls
- The traditional organ perfusion assessment is difficult and most often relies on functional surrogates, e.g., urine output (table below).
- These variables are relatively sensitive but not specific for hypoperfusion states *. See appendix.
- 👉Therefore, additional measurement such as echocardiography remains necessary to diagnose a low cardiac output state *.
- They also show a delayed response to treatment.
- Novel methods to evaluate organ perfusion
- Bedside ultrasound can help assess optimal perfusion pressure.
- The evaluation of regional splanchnic (kidney, spleen) hemodynamics by color Doppler resistive index provides a useful tool for detecting early hemodynamic abnormalities related to organ dysfunction before the occurrence of biochemical or macro-hemodynamic changes *.
- Splanchnic Doppler resistive index (SDRI) > 0.71 is very sensitive in detecting occult hypovolemic shock. This enables providers to titrate the adequacy of resuscitation when arterial lactates are still normal *,*.
- It gives a qualitative surrogate of tissue perfusion *.
- Evaluation: Skin warmth? Mottling? Capillary refill time? *
- Cool, clammy skin is due to compensatory peripheral vasoconstriction that redirects blood centrally, to maintain vital organ perfusion (i.e., coronary, cerebral, and splanchnic flow) *. Caveats:
- A cool, clammy, or cyanotic skin may also be due to the underlying peripheral arterial vascular disease.
- A warm, hyperemic skin does not exclude the absence of shock because such an appearance may be present in early distributive shock (pathologic vasodilation, vasoplegia).
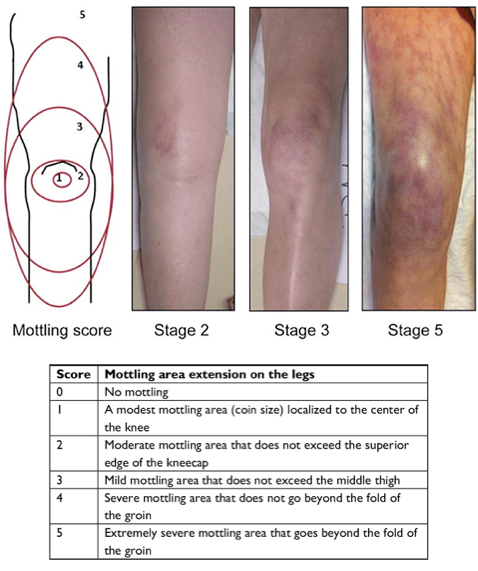
- Mottling
- Patchy skin discoloration usually starts around the knees because of heterogeneous small vessel vasoconstriction *. The suggested scoring system is shown below.
- Mottling suggests active endogenous vasoconstriction, implying that the patient would benefit from an increase in cardiac output (e.g. an inotrope), rather than additional exogenous vasoconstrictors.
- Mottling is less sensitive, but more specific for hypoperfusion and increased mortality *,*, *. A cyanotic, mottled appearance is a late and worrisome feature of shock.
- Capillary refill time (CRT)
- Defined as “the time needed for skin’s color to return to baseline on a finger’s tip after application of blanching pressure”.
- CRT can be clinically measured over the fingertip or the knee area.
- The ideal technique may be to compress the fingertip using a slide with enough pressure to cause blanching, and then maintain pressure for 10 seconds. Normal capillary refill time is ≤ 3, whereas values >3 seconds suggest impaired perfusion *.
- CRT is a measure of peripheral capillary blood flow.
- It has a low correlation with cardiac output *, however, prolonged CRT is associated with ↑mortality *.
- Defined as “the time needed for skin’s color to return to baseline on a finger’s tip after application of blanching pressure”.
- Background
- Altered sensorium is a continuum that begins with agitation, progresses to confusion or delirium, and ends in obtundation or coma. In the context of shock, it is usually due to poor perfusion or metabolic encephalopathy *.
- Altered mental status is neither sensitive nor specific for shock.
- Altered mentation is not a specific symptom of cerebral hypoperfusion in a shock state *.
- It is not a sensitive symptom for shock either. Normal mental status does not rule out a hypoperfusion state.
- Most patients with cardiogenic shock often have normal mentation despite poor perfusion of other organs. Often, they may have preserved mentation until very late in the disease process. For example, some patients in occult cardiogenic shock may have normal mentation despite malperfusion of other organs (e.g., shock liver and acute kidney injury).
- Monitoring: GCS, CAM-ICU, EEG, Brain CT *.
Heart
- Background
- Inadequate perfusion of the heart results in myocardial ischemia (and if severe) can result in pump failure.
- Cardiac injury occurs due to ↓Coronary Perfusion Pressure (CPP). This is the pressure gradient that drives forward coronary flow for myocardial perfusion.
- Coronary blood flow (CBF) of the left heart takes place in diastole, while in the right heart, it occurs both in systole and diastole, as shown in the figure below *.
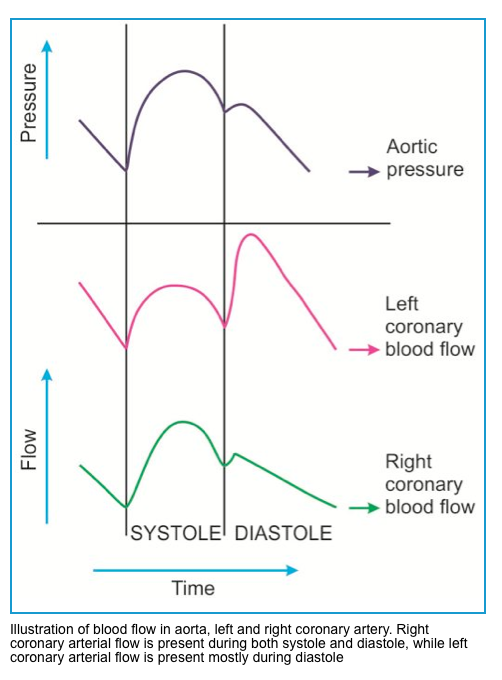
- The left main coronary artery (LMCA) receives 75% of coronary blood flow (~190 mL/min), predominantly in diastole.
- Coronary perfusion pressure (CPP) of LV is defined as (DBP – LVEDP) *. The CPP of LV is reduced in the following conditions:
- Tachycardia (↓diastolic time)
- ↓Aortic DBP: Aortic stenosis, hypovolemia, vasodilation (e.g., sepsis), other causes of hypotension, and shock state.
- ↑LV end-diastolic pressure, e.g., LVH
- ↓Vessel radius: Atherosclerosis, drugs e.g,. cocaine.
- Coronary perfusion pressure (CPP) of LV is defined as (DBP – LVEDP) *. The CPP of LV is reduced in the following conditions:
- The right coronary artery (RCA) receives 25% of coronary blood flow (~60 mL/min) throughout both systole and diastole.
- Coronary perfusion pressure (CPP) of RV in systole is defined as (SBP – RVSP), while CPP of RV in diastole is defined as (DBP – RVDP)*. The CPP of the RV is reduced in the following conditions.
- Tachycardia (↓diastolic time)
- ↓Aortic BP: Hypovolemia, vasodilation (e.g., sepsis), other causes of hypotension, and shock state.
- ↑RVSP (≈↑PASP): Pulmonary hypertension, pulmonary embolism.
- ↑RVDP (≈↑RAP): Hypervolemia, RV infarction, pulmonary hypertension, pulmonary embolism, tamponade, PEEP.
- ↓Vessel radius: Atherosclerosis, drugs e.g,. cocaine.
- Coronary perfusion pressure (CPP) of RV in systole is defined as (SBP – RVSP), while CPP of RV in diastole is defined as (DBP – RVDP)*. The CPP of the RV is reduced in the following conditions.
- Monitoring
- Clinical signs and symptoms of ↓CPP include ischemic chest pain, dyspnea, and cardiac arrest.
- TN, BNP, ECG, imaging (e.g. echo, lung, and IVC ultrasound) *.
- Background
- Elevated serum creatinine over the baseline and/or oliguria are not specific for the diagnosis of shock state.
- Acute kidney injury (defined by KIDGO’s definition of AKI) can be caused by different etiologies. More on this here.
- Monitoring
- Oliguria: a urine output <0.5 mL/kg/h is worrisome for renal malperfusion *.
- Immediately following Foley catheter placement, the urine output won’t be known. In this situation, scant and dark urine is worrisome.
- Urine output should be monitored by Foley catheter placement early in the ED course, as an accurate estimation requires at least 30 min of collection.
- During early resuscitation, urine production is considered normal for >1 mL/kg/h, mildly reduced for 0.5-1 mL/kg/h, and severely reduced for <0.5 mL/kg/h.
- Elevated creatinine (creatinine doubling over baseline)
- Oliguria: a urine output <0.5 mL/kg/h is worrisome for renal malperfusion *.
- Background
- Lung injury causes impaired oxygenation and ventilation. This can result in respiratory distress/failure, which presents with a variable degree of dyspnea, ↑work of breathing, tachypnea, hypoxemia (↓PaO2/FiO2), hypercapnia, and cyanosis.
- Note that tachypnea and dyspnea are not specific for lung injury. For DDx of dyspnea/tachypnea, see 👉 here.
- Keep in mind that different etiologies can cause respiratory distress/failure either by involving the pulmonary parenchyma (e.g., pneumonia), interstitium (e.g., pulmonary fibrosis), airway (e.g., COPD), or vascular beds (e.g., PE).
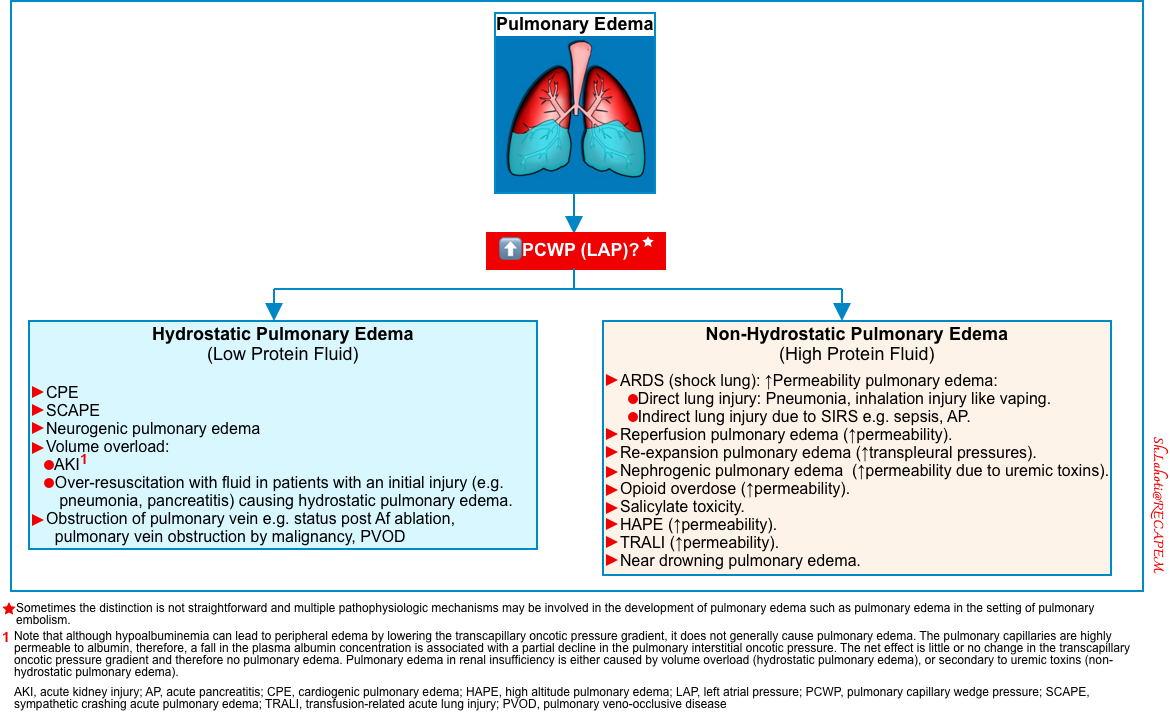
- For this discussion, the pathophysiology of pulmonary edema is briefly reviewed here (figure below).
- The two predominant pathophysiologic mechanisms that cause pulmonary edema include:
- The distinction between cardiogenic and noncardiogenic causes is not always possible, since the clinical syndrome may represent a combination of several different disorders.
- Lung injury causes impaired oxygenation and ventilation. This can result in respiratory distress/failure, which presents with a variable degree of dyspnea, ↑work of breathing, tachypnea, hypoxemia (↓PaO2/FiO2), hypercapnia, and cyanosis.
- Monitoring: PaO2/FiO2, lung ultrasound, CT *.
- Background
- The differential diagnosis of liver failure and associated impaired liver function is broad (more on this here). In the context of hemodynamic insult, two distinct hepatocellular injuries can happen:
- Congestive hepatopathy (due to elevated RAP)
- Mild-moderate transaminitis with elevated ALP x2-3 UNL.
- Elevated both direct and indirect bilirubin with total bilirubin level often < 3 mg/dL *.
- Shock liver (ischemic hepatitis)
- Severely elevated AST (> x10 UNL) *.
- Severe hyperbilirubinemia with a total bilirubin level as high as 15-20 mg/dL *.
- Markedly ↑LDH. Increased LDH tends to be massive, and an ALT/LDH ratio of <1.5 helps distinguish ischemic injury from other forms of acute hepatitis *.
- Mild-moderate ↑ALP is also reported.
- Congestive hepatopathy (due to elevated RAP)
- The differential diagnosis of liver failure and associated impaired liver function is broad (more on this here). In the context of hemodynamic insult, two distinct hepatocellular injuries can happen:
- Monitoring: Liver function test, coagulation profile, ultrasound.
- Acute hypoperfusion can compromise the barrier and absorptive functions of the intestines; this clinical situation in the context of cardiogenic shock is termed cardiointestinal syndrome *.
- Microcirculatory injury in the intestine leads to disrupted barrier function of the intestines, which results in microbial or endotoxin translocation into the systemic circulation. This entry contributes to cytokine generation and systemic inflammatory response *, leading to worsening or adding a component of vasodilatory state (mimicking distributive shock) to the clinical picture of patients.
Summary table. Perfusion status assessment.
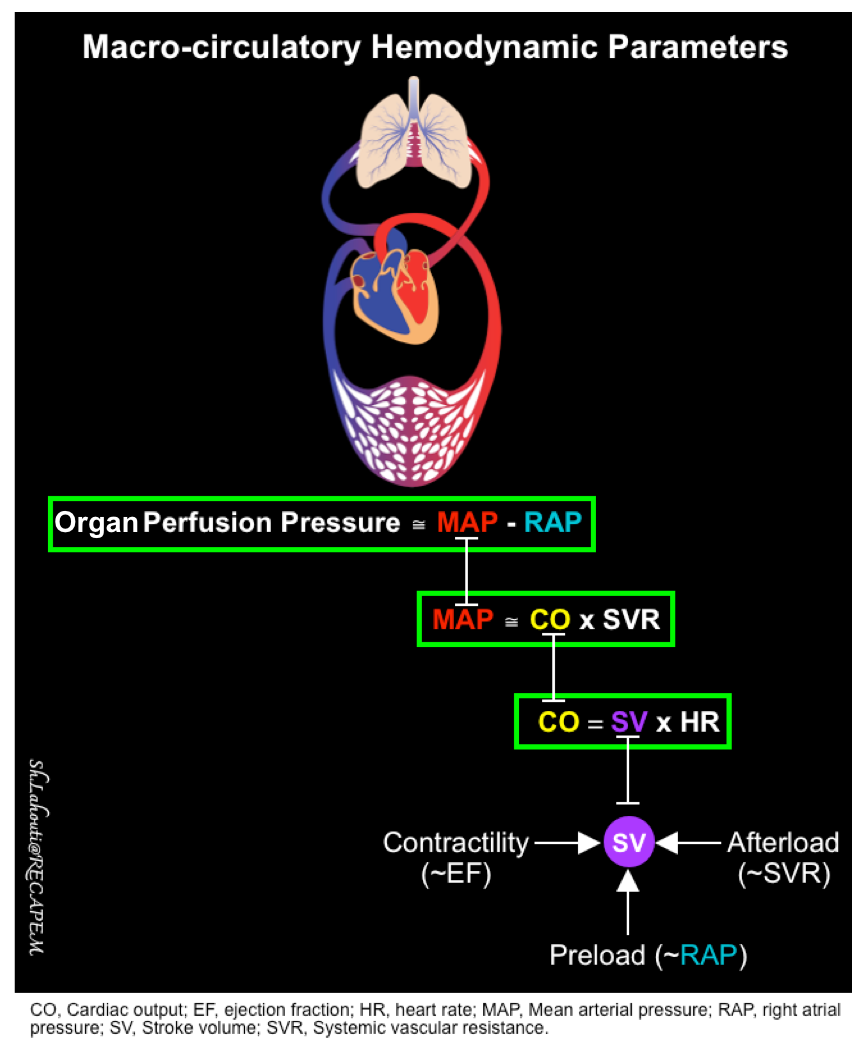
Macro-circulatory static variables
| 🔴Organ Perfusion Pressure (OPP) = MAP – RAP |
Basic physiology
- Organ perfusion pressure (OPP) is the most relevant macro-circulatory metric, reflecting tissue perfusion *.
- It provides an indirect measure of blood flow to the organs.
- In general, organ perfusion pressure (OPP) is influenced by the MAP and central venous pressure (~RAP).
Clinical pearl
- OPP is reduced in the following conditions:
- ⬇️MAP (hypoperfusion states), e.g. hypovolemic shock.
- ⬆️RAP (systemic congestion), e.g. isolated RV failure (e.g. PH), or biventricular heart failure.
| 🔴Mean Blood Pressure (MAP) = CO x SVR |
- The major physiologic determinants of arterial blood pressure are cardiac output (CO) and systemic vascular resistance (SVR).
- Arterial blood pressure is the inflow pressure for “organ perfusion”; therefore, it provides an indirect measure of blood flow to the organs.
- Systolic blood pressure (SBP) more sensitively reflects LV stroke volume and systolic heart function *.
- Diastolic blood pressure (DBP) reflects in part the vascular tone (when the aortic valve is competent) *. DBP is also influenced by:
- The duration of the cardiac cycle: Shortening diastolic times (tachycardia) is associated with higher DBP, while prolonged diastole (bradycardia) leads to decreased DBP *.
- The blood volume is ejected to the aorta.
- Arterial compliance.
- Mean blood pressure (MAP) is calculated as: MBP = (SBP +2 DBP)/3
- MAP more closely reflects the entry pressure for perfusion of most vital organs *.
- In cases where MAP is lower than the auto-regulation threshold, the perfusion of organs such as the brain and kidneys can be reduced, even when cardiac output is high.
- MBP is independently associated with mortality in shock *.
⚠️Pitfalls
- No threshold BP value defines adequate organ perfusion among organs, between patients, or in the same patient over time.
- Organ perfusion can be impaired despite preserved MBP when RAP is increased (Perfusion Pressure=MBP-RAP).
- Circulatory shock does not require the presence of hypotension *.
- It is well recognized that in shock, compensatory mechanisms may preserve blood pressure through vasoconstriction, while tissue perfusion and oxygenation may be significantly decreased. Thus, hypoperfusion is not always accompanied by hypotension.
- Patients with excessive sympathetic-adrenergic response to distress can present with “hypertension“, even though cardiac output is low (shock state). This can be seen in patients with early sepsis or patients with tamponade *.
Clinical pearl
- Hypotension may be absolute (e.g. SBP <90 mm Hg; MAP<65 mm Hg), relative (e.g. a drop in SBP >40 mm Hg); or profound (e.g. vasopressor-dependent).
- The resuscitative end-point should be targeted personally. A one-size-fits-all approach is not suitable.
- A higher MAP goal might be targeted in the presence of the following conditions *,*
- Critical aortic stenosis
- Severe LVH
- Hypertrophic obstructive cardiomyopathy and “SAM” need higher MAP to stent open the LVOT.
- RV dysfunction (to maintain RV coronary perfusion). A higher MAP will also increase the LV afterload, which may counteract septal flattening and thereby promote normal cardiac geometry *.
- Patent foramen ovale and right-to-left shunting: A higher MAP results in an elevation of left-sided pressures, helping to reduce the amount of shunting.
- A lower MAP goal might be indicated in the following setting:
- Hemodynamically significant AR.
- Hemodynamically significant MR *.
- A higher MAP goal might be targeted in the presence of the following conditions *,*
| 🔴Heart Rate (HR) |
- The effect of HR on cardiac output
- Tachycardia
- It has a mixed impact on cardiac output:
- Increased HR tends to increase cardiac output. This effect is generally seen in mild-moderate sinus tachycardia which often takes place as an early compensatory mechanism in patients with shock.
- Decreased diastolic filling time tends to decrease the stroke volume, which decreases cardiac output. This is often seen in severe tachycardia (HR >170 bpm).
- It has a mixed impact on cardiac output:
- Bradycardia
- Bradycardia directly pulls down the cardiac output, potentially causing shock.
- Despite that, bradycardia may cause a minimal increase in diastolic filling (thereby increasing the stroke volume); however, this compensatory factor is weak and extremely limited.
- Severe bradycardia (e.g., HR< 30 bpm) should always raise concern for shock even in normotensive patients.
- Keep in mind that blood pressure can be maintained by compensatory systemic vasoconstriction, while cardiac output and perfusion may still be poor (occult bradycardic shock).
- Bradycardia directly pulls down the cardiac output, potentially causing shock.
- Tachycardia
- 💡Keep in mind that hemodynamic variables should be interpreted in the clinical context and other hemodynamic variables.
Clinical pearl
- Determining the cause of hemodynamic instability
- In a hypotensive patient with abnormal HR, try to determine whether the HR abnormality is the cause of hypotension or if an abnormal HR is a compensatory response to hypotension.
- By and large, abnormal HR is considered to be the primary cause of hemodynamic instability if:
- Non-sinus tachycardia > 170 bpm
- AF with RVR >150 bpm
- Marked bradycardia (e.g., HR <30 bpm)
- Differential diagnosis of abnormal HR in a clinical context
- A helpful way to understand tachycardia within the context of blood pressure is to calculate the shock index.
- Generally, when BP drops, HR increases, and vice versa. When both BP and HR are changing in the same direction, something is wrong!
- Concordant changes
- ⬇️MAP, ⬇️HR
- Drug intoxication: BB, CCB, clonidine, digoxin, organophosphate (cholinergic), opioid, amiodarone, local anesthetic systemic toxicity (LAST).
- Inferior myocardial infarction.
- Electrolytes/metabolic disturbances: ↑K, hypoglycemia, myxedema coma, severe acidosis, hypercapnia, hypoxia, hypothermia.
- Septic shock
- Neurogenic: Intracranial hemorrhage (ICH)
- Keep in mind that bradycardia can cause ↓level of consciousness by decreasing cardiac output. However, when the level of consciousness is disproportionately decreased for a given bradycardia (for example, a GCS of 8 with HR ~ 40 bpm), another cause of bradycardia should be considered, e.g., ICH, or drug intoxication.
- ⬆️MAP, ⬆️HR (hyper-adrenergic state)
- Early shock state
- Sympathetic crashing acute pulmonary edema (SCAPE).
- Thyrotoxicosis, pheochromocytoma, hyperglycemia, hyperthermia.
- Drugs: Stimulant intoxication, sedative/hypnotic withdrawal
- ⬇️MAP, ⬇️HR
- Discordant changes
- ⬆️MAP, ⬇️HR
- Hypertensive emergency/urgency.
- Impending brain herniation (Cushing response)
- ⬇️MAP, ⬆️HR
- Overt shock state
- ⬆️MAP, ⬇️HR
LV systolic function
Assessment of left ventricular systolic function can be performed by measuring LV cardiac output (CO), stroke volume (SV), and LV ejection fraction (LVEF). However, it is important to understand that LV systolic function can be affected by several other parameters.
Basic physiology
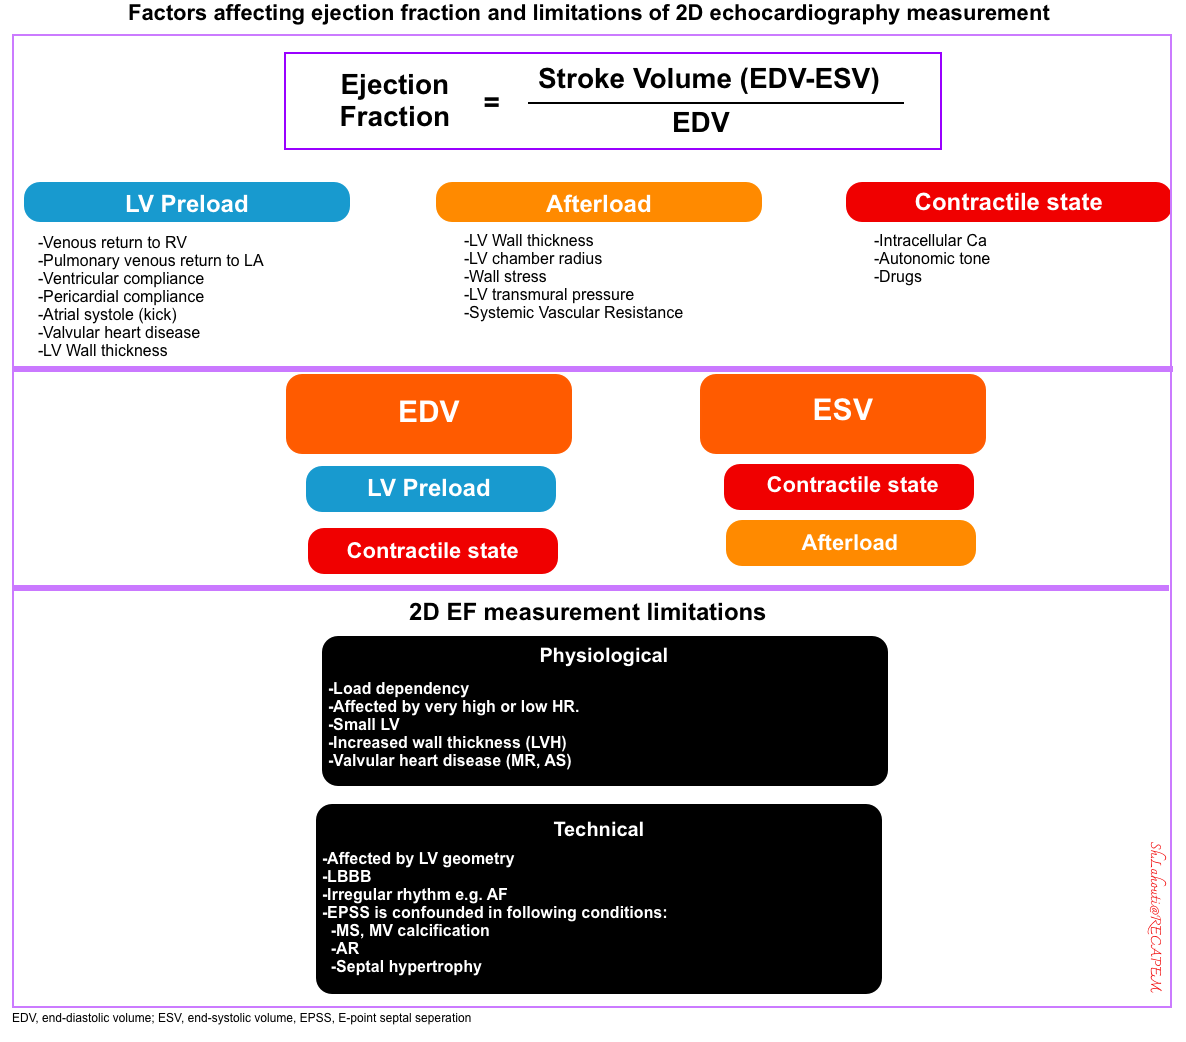
Markers of LV systolic function (e.g. SV, LVEF) are affected by myocardial contractility, afterload, preload, and chamber geometry (figure below).

1.Mocardial contractility (true contractility) refers to the inherent capacity of the myocardium to contract independently to loading conditions (preload or afterload) and geometry (LV remodeling). There’s no clinical method to assess myocardial contractility in vivo.
- The key factor affecting true contractility is intracellular Ca2+, which could be affected by autonomic tone, drugs (e.g. digoxin), etc.
- Note that contractility improves at faster HR. This is because the myocardium does not have time to remove calcium, so it accumulates intracellularly.
2.Afterload: Refers to the total resistance to ejection of blood from the ventricle during contraction (👉see below).
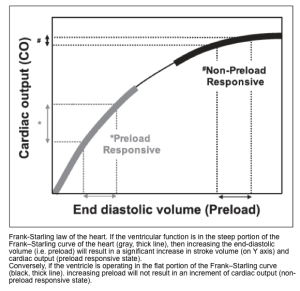
3.Preload: Defined as the myocardial sarcomere length just before contraction.
- Remember that in a healthy physiologic state, increasing the length of myofibril (before contraction) up to a certain limit will tend to increase cardiac contraction. This phenomenon is referred to as Starling’s law of the heart or the Frank-Starling mechanism (figure below).
Note that the RV preload should not be considered equal to the LV preload.
- LV preload depends on the following physiologic factors:
- Pulmonary venous return
- For example in a massive pulmonary embolism, pulmonary venous return to the LA is decreased, hence LV preload is reduced.
- Atrial kick
- For example, in mitral stenosis, there is an obstruction to LV filling. LV preload is decreased and is dependent on LA kick. A rapid HR as well as loss of the atrial contribution to ventricular filling in AF exacerbate hemodynamic compromise in the setting of MS *.
- LV compliance (wall thickness)
- A compliant LV will accommodate physiologic amounts of volume without a significant rise in pressure. In contrast, in a non-compliant LV, a lesser amount of volume will lead to a significant generation of pressure.
- In severe aortic stenosis, concentric LVH renders the LV non-compliant (diastolic dysfunction). This makes the ventricle dependent on an increased filling pressure to maintain cardiac output (“preload dependent”) *.
- Preload dependent (i.e. preload sensitive) state refers to a condition where increasing the preload results in increasing cardiac output.
- In AS with LVH, increasing preload results in increasing cardiac output. However, because of impaired LV compliance (diastolic dysfunction), the “preload reserve” of these patients is limited (i.e. the LVEDP rises significantly with a limited amount of volume). Therefore fluid administration to augment cardiac output should be performed under close monitoring *.
- Pericardial compliance is decreased in tamponade, more on this here.
- Loading condition, for example, LV preload is increased in AR, MR; and it is decreased in MS, AS.
- Pulmonary venous return
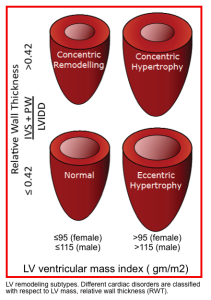
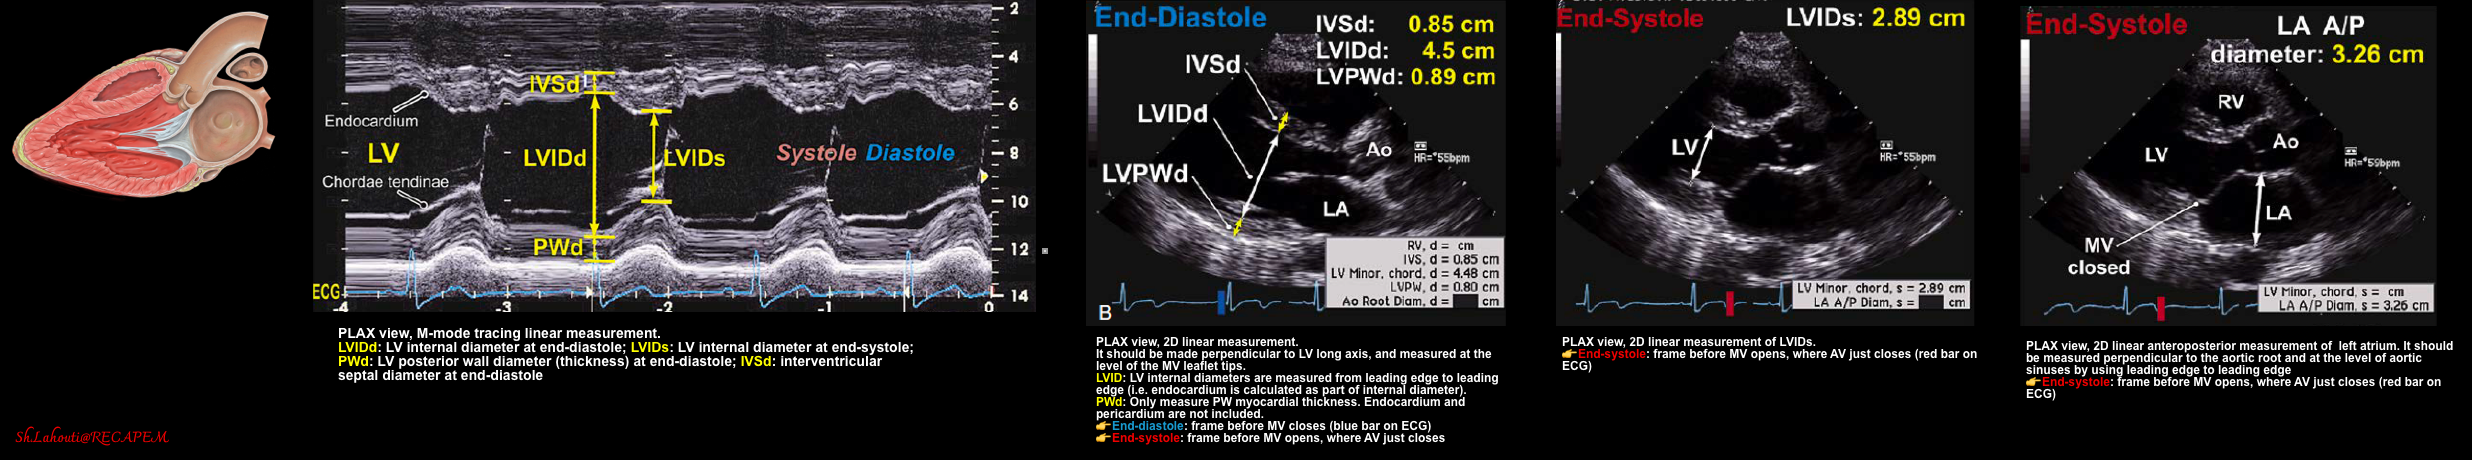
- LV geometry can be described based on mass and relative wall thickness (RWT), which can be assessed by M-mode in PLAX view (figure below).
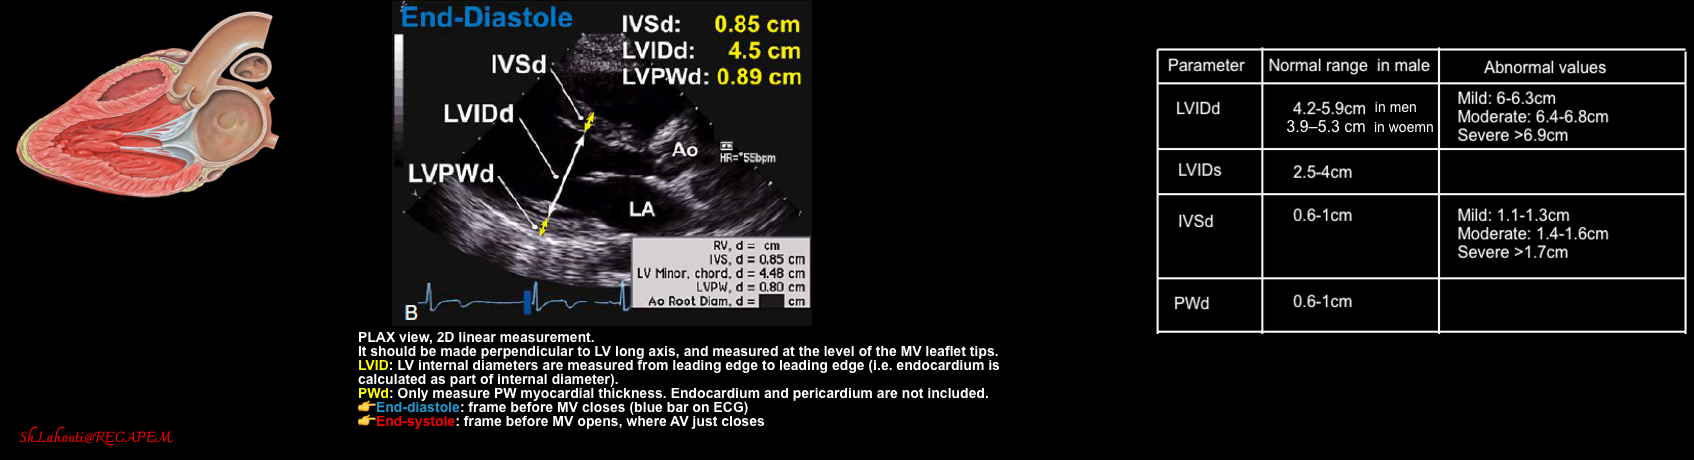
LV mass: An increase in LV mass points to the presence of LVH, which is associated with ↑cardiovascular mortality *.
LV mass= 0.8 [1.04 (IVSdd + LVIDd + PWTd)3 − LVIDd3]+0.6 g
In which IVSd is the interventricular septal diameter during diastolic, LVIDd is the diastolic LV cavity dimension, PWTd is the diastolic posterior wall thickness, and 1.04 is the specific gravity of myocardium.
The upper limit of normal: Women(162g), men (224g).
Relative Wall Tickness (RWT) = 2 × PWT/LVID. UNL: 0.42 *
The diastolic dimension of LV (LVID) is the denominator of the RWT equation. ↑diastolic diameter →↓RWT.
RWT also has been expressed as h/R, in which h is the wall thickness and R is cavity radius.
In the normal or compensated ventricle, the RWT increases in direct proportion to elevations in systolic pressure.
- LV mass and RWT determinations may be used to subdivide the altered LV geometry into 4 general categories (figure below):
- Concentric hypertrophy (↑both LV mass index and RWT) is seen in hypertension, aortic stenosis.
- ⚠️Concentric hypertrophy in a hypertensive patient is a poor prognostic marker.
- Patients with long-standing afterload (severe AS, hypertension) may show the transition from a state of ↑wall thickness and normal LV diameter to another state associated with LV dilatation and ↓RWT (eccentric hypertrophy).
- In the beginning, increased myocardial thickness is very helpful for decreasing wall stress and providing enough SV. When LV begins to dilate, wall stress is also increased due to Laplace’s law. Nevertheless, a dilated ventricle could provide enough SV in even a low contractile state.
- Eccentric hypertrophy(↑LV mass index with normal RWT) seen in AR, MR.
- ⚠️It has been shown that eccentric hypertrophy is a harbinger of poor survival in patients with heart failure *.
- Myocardial thinning (↓RWT) further increases wall stress and myocardial energy consumption.
- In a failing heart, eventually, compensatory mechanisms for providing enough SV are exhausted, and cardiac output declines.
- Concentric remodeling (normal mass index but abnormally ↑RWT) in HTN.
- Normal LV mass and RWT
- Concentric hypertrophy (↑both LV mass index and RWT) is seen in hypertension, aortic stenosis.
Markers of LV systolic function
| 🔴1. Cardiac Output (CO) = SV x HR. (nl ≈ 4-8 L/min). |
- Cardiac output is the amount of blood pumped by the heart per minute. It is a vehicle to achieve the goal of resuscitation, which must always be tissue perfusion *.
- As already discussed, cardiac output is affected by HR, afterload, LV preload, and contractility *.
- There are differences between sex, height, and weight as well. Indexing it to BSA would standardize it to a certain extent and then it is called cardiac index (CI).
Diagnostic performance
- Because blood flow varies to match metabolic requirements, which in turn can vary considerably, there is no one specific value of cardiac output or oxygen delivery that can be defined as normal *.
Assessment
- Direct assessment of CO
- TTE: Calculating cardiac output is based on the velocity-time integral (see stroke volume👇) *.
- TTE: Calculating cardiac output is based on the velocity-time integral (see stroke volume👇) *.
- Indirect assessment of CO
- Skin perfusion status
- Estimation of the CO using capillary refill time, mottling, and skin temperature has a sensitivity of 12% and a specificity of 98%, suggesting a good performance to rule in the presence of low flow states *.
- Other perfusion markers, e.g., urine output (table🖕).
- Shock index (SI) = HR/SBP
- SI > ~0.8 suggests significant instability and possible shock *.
- ⚠️Pitfall: Shock index may be insensitive in the presence of negative chronotropic medications (e.g., beta-blockers) or conduction system disease.
- Pulse Pressure (PP): Evaluation of pulse pressure is a window to assess cardiac output (indirectly).
- Pulse pressure = SBP – DBP (nl ≈30-60)
- Pulse pressure percentile (%PP) = PP/SBP
- Normal PP% is around 25–40%.
- Narrow PP% is <25%. A Wide PP% is >40%.
- PP% is more sensitive than absolute pulse pressure in clinical situations where the systolic blood pressure is preserved or elevated, but stroke volume is falling—meaning the absolute PP looks “normal,” but perfusion is poor. For example:
- Early or compensated shock (esp. bradycardic shock), or SBP is still preserved, but stroke volume is low.
- In elderly or hypertensive patients
- Their baseline SBP is high, so a normal-looking PP may mask poor flow.
- PP% adjusts for the higher SBP, revealing reduced effective output.
- 📍Example: BP 160/110 → PP = 50 (seems OK), PP% = 31% (possibly low if symptomatic).
- Vasoconstricted states (e.g., cold septic shock, cardiac tamponade)
- Diastolic pressure is high due to systemic vascular resistance.
- Absolute PP narrows modestly, but PP% falls more clearly
- Bottom line: Use PP% when SBP is fluctuating or deceptively normal, such as in early shock, bradycardia, vasoconstriction, or elderly patients, where absolute PP may miss the low perfusion state.
- Skin perfusion status
Pitfalls
- There is no normal value for cardiac output. It will only be adequate or inadequate to meet the metabolic demands of tissues.
- Some patients with chronic heart failure adapt to having a low CO, allowing them to avoid shock despite having a CO below normal values.
- There is no known cardiac output that should necessarily be targeted for critically ill patients.
- Having said that, increasing the CO will only be important if it improves MAP and if it improves oxygen consumption.
| 🔴2. Stroke Volume (SV) (nl≈ 60-100 mL/beat) |
Stroke volume (SV) is defined as the volume of blood pumped out of the left ventricle during each systolic cardiac contraction and is defined as the difference between end-systolic volume and end-diastolic volume, i.e. SV= EDV-ESV
- SV is a measure of systolic pump performance of the left ventricle, referring to the pumping ability of the LV, which results in the delivery of oxygenated blood to tissues *.
- SV is affected by preload, contractility, afterload, and chamber geometry.
Echocardiographic assessment of stroke volume (SV): Velocity-time integral (VTI) method
- It involves the measurement of the LVOT area and LVOT VTI (Pocket guide).
- Calculation👉 Cardiac output and Stroke volume calculator
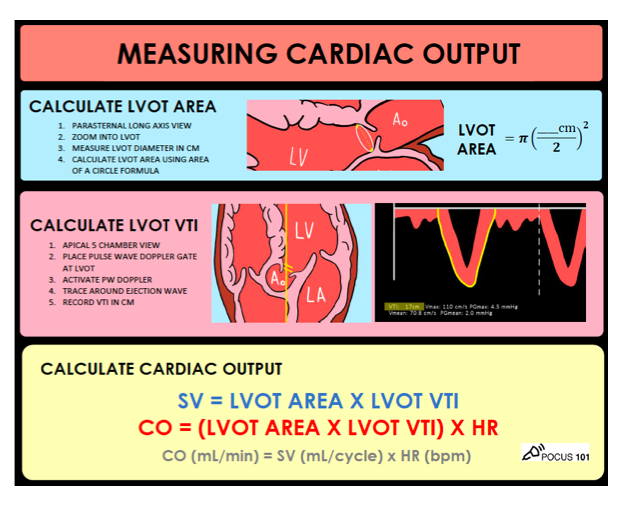
- Advantage: LVOT VTI has some advantages over ejection fraction (EF) in the assessment of LV output.
- It accounts for both the global LV function and LV size; therefore, it gives a direct estimate of cardiac output (“LV forward flow“).
- In the presence of MR, LVEF overestimates the systolic function of LV. Calculating stroke volume will account for true forward flow in this condition.
- It accounts for both the global LV function and LV size; therefore, it gives a direct estimate of cardiac output (“LV forward flow“).
- ⚠️Pitfalls
- Avoid plain foreshortening when measuring LVOT diameter (diameter at aortic annular level).
- Because the cross-sectional area formula involves squaring the annular dimension, minor error results in significant variation of SV.
- Avoid SV underestimation.
- Optimize PWD settings to measure LVOT VTI.
- Put the PWD beam parallel to the LVOT flow.
- Aortic regurgitation: The SV is overestimated since the regurgitant diastolic flow is not considered.
- Not applicable in aortic stenosis or subaortic obstruction.
- Not applicable in the presence of dynamic LVOTO.
- In patients with shock, check for dynamic LVOTO (+/- MV SAM), especially in cases of LV hypertrophy, hyperdynamic LV, and hypovolemia (e.g., vasoplegia).
- Avoid plain foreshortening when measuring LVOT diameter (diameter at aortic annular level).
💡How SV should be interpreted clinically? Systolic markers of LV should be interpreted in the context of other hemodynamic variables. See here.
| 🔴3. LV ejection fraction (LVEF)= (EDV-ESV)/EDV x 100 |
|---|
| ⚠️⚠️Hyperdynamic EF: 70% Normal EF: 55-70%. Mildly reduced: 45-54%. Moderately reduced: 30-44% ⚠️⚠️Severely reduced: <30% |
Defined as the change in LV volume (i.e. SV) divided by the initial volume (i.e. EDV).
Echocardiographic assessment: The commonly used bedside methods for estimation of EF are discussed here. For other methods e.g. fractional area change, see here.
- Eyeballing
- Look at how well the left ventricle walls are moving. Are the LV walls coming close to each other during systole (is chamber size changing >50%)?
- Look at how well the anterior mitral valve leaflet is moving. Is it coming close to the intraventricular septum during diastole?
- E-Point Septal Separation (EPSS)
- Refers to the distance between the anterior leaflet mitral valve and the septum when the mitral valve has reached maximum excursion during early diastolic filling. The larger the EPSS distance the worse the ejection fraction. (see media below).
- LVEF can be calculated as: EF= 75.5 – (EPSS x 2.5) *.
- EPSS value is <7mm corresponding to EF >50%.
- EPSS > 10mm indicates systolic LV dysfunction.
- Caveat: EPSS is confounded in the following conditions:
- Mitral valve calcification, and stenosis (these will keep the mitral valve leaflet down).
- Aortic regurgitation (the regurgitant jet artificially pushes down the mitral leaflet).
- Septal hypertrophy *
- To overcome these caveats, one possible method is to get fractional shortening as described below.
- Fractional shortening (FS)
- It is an M-mode measurement of the percent change in diameter between the Left Ventricle End Diastole Diameter (LVEDD) and Left Ventricle End Systolic Diameter (LVESD). (see media below).
- Obtain PLAX view. Select M-mode and place the cursor in the middle of the LV, being careful not to include the mitral valve or papillary muscle.
- FS= (LVEDD − LVESD/LVEDD) × 100.
- Normal FS is > 30%.
- Moderate dysfunction (10% to 30%)
- Severe LV systolic dysfunction when FS <10%
- FS= (LVEDD − LVESD/LVEDD) × 100.
- Caveat
- Highly preload and afterload-dependent.
- Assess contractility in one plane and at one level, usually the mid-papillary level.
- In the presence of severe regional wall motion abnormality (RWMA) in the apical segment, FS measurement would give wrong measurements with an overestimation of the LV function. Likewise, presence of presence of RWMA at the mid-papillary level will underestimate the global LV function.
- Factors that affect EF and limitations in 2D echocardiography measurement of EF are summarized below.
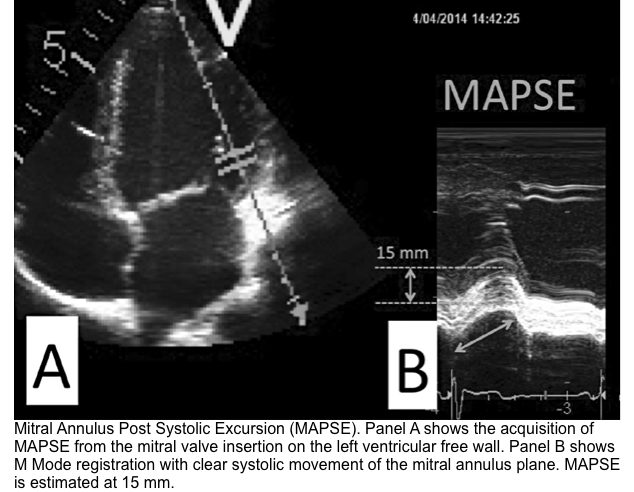
| 🔴4. MAPSE (mitral annular plane systolic excursion) |
|---|
| ✅Normal values are usually > 10 mm with an acceptable range of 12 ± 2 mm *. |
- MAPSE measures the lateral mitral annular movement toward the apex during LV systole and is a surrogate of the left ventricular longitudinal function.
- ⚠️Pitfalls: Monodimensional and regional parameter (only analyzes mitral annular LV portion)
| 🔴5. Wall motion abnormality (WMA) |
- Myocardial function is assessed based on the observed wall thickening (in systole as compared to diastole) and endocardial motion of the myocardial segment. Based on this, wall motion is described as normokinetic, akinetic, dyskinetic, or aneurysmal.
- Wall thickening: It is a better gauge of regional function than endocardial movement since an akinetic segment may be moved because it is attached to another moving part. Normal wall thickening (in systole) is >30%.
- Endocardial motion: Normal endocardial excursion is >5mm
- Distribution of wall motion abnormality
- Global hypokinesia/akinetic
- Regional wall motion abnormality (RWMA): When hypo/akinetic segments are limited to a certain distribution.
- Ischemic RWMA: It is in the territories of coronary arteries distribution and is suggestive of ischemia/infarction.
- Non-ischemic RWMA: This is beyond the territories of coronary arteries and is suggestive of stress cardiomyopathy. More on Takotsubo👉here.
Systemic vascular resistance (SVR)
- Basic physiology
- SVR ≈ LV afterload.
- SVR can provide valuable information for distinguishing the classes of shock from each other.
- Pathological decreased vasomotor tone (vasoplegia) is a common cause of hypotension (e.g. septic shock).
- Once the CO, MAP, and RAP have been determined, SVR can be calculated as [MAP– RAP]/CO x 80. (nl range 800-1200 dynes. sec/cm5).
- Cause of ↓SVR
- Septic shock
- SIRS: Burns, trauma, pancreatitis, postmyocardial infarction, post coronary bypass, post-cardiac arrest, amniotic fluid/fat embolism, idiopathic systemic capillary leak syndrome.
- Neurogenic shock: Traumatic brain injury, spinal cord injury (quadriparesis with bradycardia or paraplegia with tachycardia).
- Anaphylactic shock
- Other: Liver failure, transfusion reactions, vasoplegia (e.g. vasodilatory agents, cardiopulmonary bypass), toxic shock syndrome.
- Cause of ↑SVR
- Early stages of other types of shock (e.g. hypovolemic or cardiogenic shock)
- Endogenous/exogenous catecholamine surge.
- Clinical Pearls
- Relevant signs and symptoms of SVR change include:
- Decreased SVR(vasoplegia): ↓↓DBP, ↑PP, 🥵warm and flushed skin.
- Elevated SVR: Cool, clammy skin, often narrow pulse pressure.
- Vasoplegia will limit the BP increase to fluids even if the volume is responsive.
- Low DBP may indicate vasodilation and the need for vasopressors.
- The diastolic shock index (HR/DBP) > 2.5 was associated with an increased risk of death in patients with septic shock *.
- Relevant signs and symptoms of SVR change include:
Echocardiographic evaluation
| LVIDS (Left ventricle internal diameter at end-systole). Normal range: ✅LVIDS: 2.5-4cm |
Echo
- Measure the LV internal diameter at end-systole (LVIDS). Normal diameter 2.5-4 cm. How to measure? figure 👇.
- LVIDS is reduced in vasoplegia.
- Pitfall: Reduced LVIDS is not specific to vasoplegia and can be seen in ↑an inotropic state.
LV Preload
The physiologic parameters that affect LV preload are explained above. LV preload can be assessed by echocardiography.
| LVIDD (Left ventricle internal diameter at end-diastole). |
|---|
| Normal ranges: ✅LVIDD men 4.2–5.9 cm ✅LVIDD women 3.9–5.3 cm * |
LV end-diastolic volume (LVEDV) is measured by echo (Simpson’s method).
- An alternative method is to measure LV internal diameter at end-diastole (LVIDD). Figure below.
- A low LVIDD could be indicative of hypovolemia (↓LV preload).
- Hypovolemia is best monitored using LVIDD. Do not mistake a low LVIDS with hypovolemia. A low LVIDS could also depict ↓SVR, ↑inotropic state, or ↓ventricular filling *.
- 💡In hypovolemia both LVIDD and LVIDS are decreased, while in the setting of ↓SVR, LVIDD is normal but LVIDS is decreased.
⚠️Pitfalls
- LVIDD is reduced in hypovolemia.
- In patients without diastolic dysfunction (i.e. normal LV wall thickness), a low LVIDD is predictive of fluid tolerance.
- In hypovolemic patients with diastolic dysfunction (i.e. concentric LVH), small cavity size, and elevated filling pressures, the reduced LVIDD predicts a good response to fluids, but a low threshold to overload with a large volume fluid challenge or exaggerated response with an increased in filling pressures with a small volume of fluid challenge *.
- LVIDD is not valid for fluid tolerance in patients with RV dysfunction *.
Left atrial pressure
Basic physiology
- LAP is a dynamic variable. It can be changed with loading conditions that affect the transmitral pressure gradient *.
- LAP tells us about left atrial compliance.
- LAP also provides just a perspective to LVEDP, however, these two should not be used interchangeably (as LAP and LVEDP are not telling us the same things!) *. Patients with similar LVEDP can have markedly different LAP *.
- Generally, LAP and LVEDP should not be used interchangeably.
- Estimating LAP is especially important when pulmonary congestion and/or right heart dysfunction are present.
- Elevated LAP signifies a high pressure in the central circulation system.
- Etiology of ↑LAP
- LV systolic or diastolic heart failure
- Valvular diseases: Regurgitants (MR, AR), Stenotic (MS, AS), dynamic LVOTO.
- Hypertrophic cardiomyopathy
- Hypervolemia
- Large right-to-left shunts
- Tamponade, constrictive pericarditis, and restrictive cardiomyopathies.
- Etiology of ↓LAP
- Hypovolemia
- Large pulmonary embolism
⚠️Pitfalls
- Pulmonary arterial occlusion pressure (PAOP) is a poor measure of LV preload but is a good measure of the back-pressure to pulmonary blood flow and the hydrostatic forces producing pulmonary edema *.
- For example in mitral stenosis, elevated LAP signifies increased back-flow pressure to pulmonary blood flow, however, LV preload is reduced.
- LA pressure is not always related to diastolic function.
- Volume overload: high LAP despite normal LV diastolic function.
- Hypovolemia: low LAP despite diastolic dysfunction due to poor LV compliance.
Echocardiographic indices of LAP
| Left Atrial Pressure (LAP) ≈ PCWP ≈ PAOP. Normal range 6-12 mm Hg (measure by PAC) |
|---|
| ✅E/e’ < 8: Normal LAP 🧐E/e’ 8-15: Gray zone ⚠️E/e’ >15: Elevated RAP. |
| Indirect markers of ↑LAP ⚠️LA Enlargement (LAE). LA diameter >4cm (PLAX) reflects ↑LAP (chronically). ⚠️Bowing of inter-atrial septum to the right atrium: suggests ↑LAP. ⚠️Diffuse bilateral B-lines on lung ultrasound may suggest ↑LAP (especially in the absence of pulmonary disease). |
- Echo: Mitral inflow velocities, and annular velocities.
-
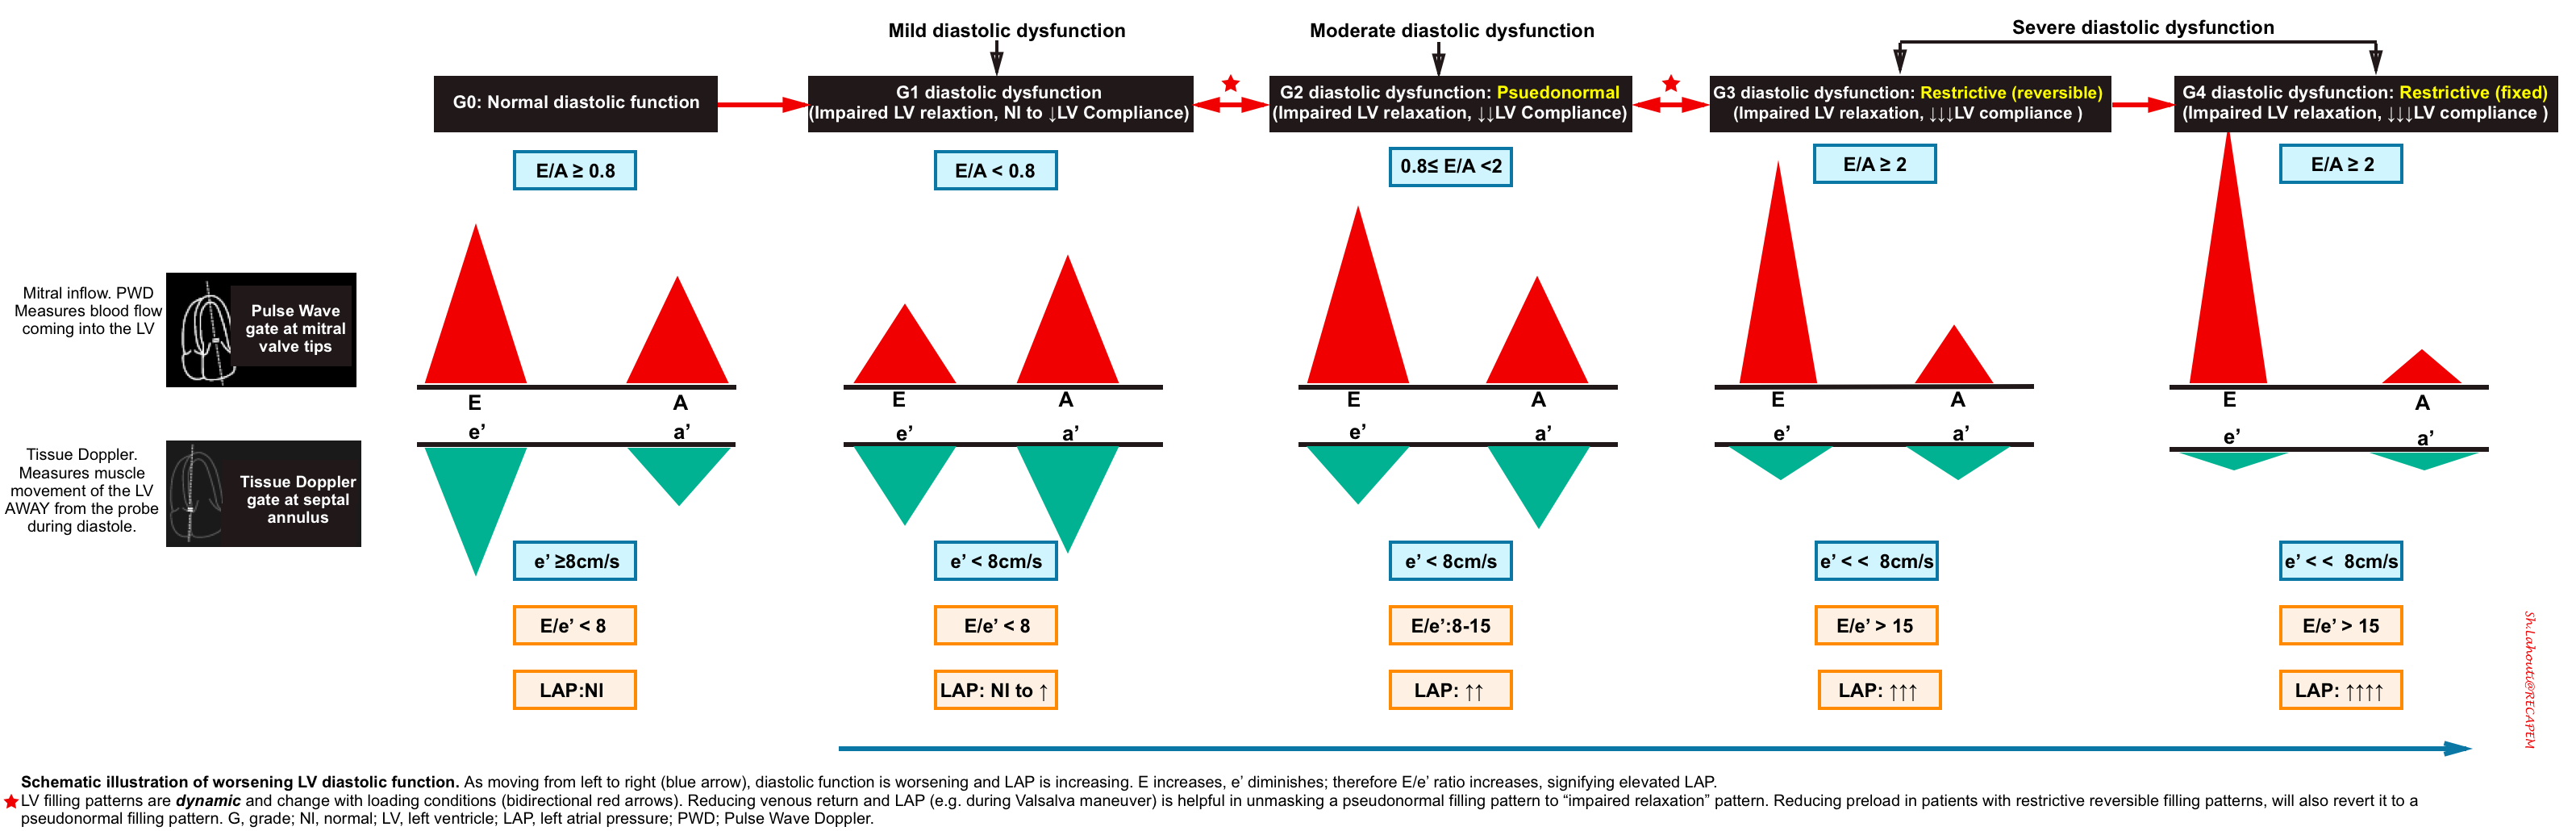
- If LVEF is preserved: Use the E/e’ ratio for estimating LAP
- It has been shown that echocardiographic measurement of E/e’ ratio correlates best with LAP.
- Use Pulse Wave Doppler to measure E wave velocity (media below), and Tissue Doppler to assess e’ velocity (media below).
- The two validated areas where you can place the Tissue Doppler sample gate are at the septal or lateral portions of the mitral annulus. Using the septal annulus is easier to obtain. This will produce two downward deflections; e’ and a’.
- LAP can be estimated echocardiographically by measuring E/e’ ratio (media below).
- Different cutoff values have been used depending on the site of e’ measurement (septal vs. lateral e’).
- E/e’ ratio of >15 suggests ↑LAP (using septal e’).
- The cutoff for lateral E/e’ is > 13 and for the average E/e’ is >14 *.
- E/e’ < 8 is considered normal LAP.
- E/e’ between 8-15 is indeterminate. This range can be used as a spectrum. A value closer to 8 suggests a lower LAP, and a value closer to 15 is suggestive of a higher LAP.
- E/e’ ratio of >15 suggests ↑LAP (using septal e’).
- Keep in mind that E/e’ is not equal to LAP. The Nagueh formula can estimate LAP based on the E/e’ ratio *.
- Nagueh formula: LAP= (1.24 * E/e’) + 1.9
- Simplified to LAP = E/e’ + 4.
- 👉However the E/e’ cutoffs are enough to remember for clinical use to identify elevated LAP.
- Different cutoff values have been used depending on the site of e’ measurement (septal vs. lateral e’).
- If LVEF is reduced (systolic dysfunction): Use the E/A ratio. (IAS bowing to the right and B-lines on lung ultrasound are also helpful).
- E/A > 2= ↑LAP
- E/A < 0.8 and E<50 cm/sec= Normal LAP
- If LVEF is preserved: Use the E/e’ ratio for estimating LAP
-
-
- ⚠️Pitfalls of echo evaluation of mitral annular velocities: often show poor correlation with LV filling pressures in the following conditions *
- Coronary artery disease affecting basal septal or lateral segments.
- Significant mitral annular calcification.
- Surgical rings or prosthetic MV
- Left bundle-branch block
- RV pacing, cardiac resynchronization therapy.
- Pericardial disease.
- ⚠️Pitfalls of echo evaluation of mitral annular velocities: often show poor correlation with LV filling pressures in the following conditions *
- Other echocardiographic indirect evidence of elevated LAP
- Left atrial enlargement (LAE)
- Normal left atrial diameter is < 4.1 cm in men or < 3.9 cm in women (PLAX view).
- LA diameter roughly >4cm (PLAX), or eyeballing LA diameter larger than the diameter of the aortic root is considered abnormal.
- LAE reflects chronically elevated LAP. Therefore, it gives you an estimate of the mean LAP over time (in the absence of atrial fibrillation *).
- Bowing of inter-atrial septum into the right atrium
- Left atrial enlargement (LAE)
-
The video to the left of the screen shows LVH and left atrial enlargement with inter-atrial septum (IAS) bowing to the right, suggestive of elevated LAP. The video to the right of the screen shows pathologic LVH, with secondary MR with impaired coaption of the leaflet and enlarged left atrium suggestive of elevated left atrial pressure.
- 🫁Lung ultrasound
- Elevated LAP causes interstitial or alveolar pulmonary edema. This produces diffuse bilateral B-lines on lung ultrasound.
- ⚠️Caveat: B-Lines lack specificity and can be seen in other conditions such as *
- SIRS (due to various infectious or non-infectious etiologies) will result in a B-profile irrespective of intravascular volume status. This will happen in the context of a capillary leak.
- Non-cardiogenic pulmonary edema (NCPE).
- Pulmonary fibrosis.
- Pneumonia, pneumonitis.
Interpretation of LV functional markers
- All measures for assessing LV systolic pump performance are “load-dependent“.
- The appropriate evaluation of systolic pump function as well as interpretation of related echocardiographic indices involve the following considerations:
- Any single parameter should be interpreted in conjunction with other hemodynamic indices.
- Consider the hemodynamic interaction of preload, afterload, inotropic state, and chamber size with the EF or SV.
- All parameters should be interpreted in the clinical context (gross valvular abnormalities? sepsis? etc.)
- When occult systolic dysfunction is suspected, evaluate other aspects of pump performance such as diastolic function.
| Having said that, systolic performance of the heart should not be interpreted based on a single parameter such as LVEF especially in critically ill patients *. |
- 💡In patients with MR and AR, LVEF overestimates the LV function while the patient could have a picture of heart failure *.
- In MR, LVEF is overestimated because it does not only reflect the blood volume pumped into the aorta but also that is pumped into the low-pressure left atrium. Measurement of effective forward flow (stroke volume) will be helpful.
- In the case of AR, the heart pumps blood out of the LV during systole, and then a part of this pumped volume leaks back through the incompetent aortic valve during diastole. When this happens, the net SV across the aortic valve is reduced. LVEF overestimates the systolic function of LV.
- 👉Moreover, in AR, stroke volume measurement by LVOT VTI overestimates the forward flow too, since the regurgitant diastolic flow is not considered *.
- 💡In a hypertrophic LV with a small internal diameter, LVEF may not reflect LV systolic function adequately.
- 💡A stroke volume (SV) within the normal range cannot exclude systolic dysfunction. The value should be interpreted in a clinical context.
- In severe aortic stenosis with concentric LVH and some LV dilation, SV could be preserved at the expense of left ventricular enlargement; while systolic dysfunction is present.
- The interaction of several hemodynamic parameters with EF and SV are discussed here.
- Preload
- The effect of preload on stroke volume (Frank-Starling law) is described above.
- A patient with pre-existing systolic heart failure (e.g. baseline EF 35%) may decompensate due to fluid overload. The initial EF lower than the patient’s baseline in the decompensated state (e.g. EF 20%) does not necessarily imply worsening true contractile function of the heart. Following decongestive treatment (e.g. diuretic), EF will improve to the baseline.
- The effect of preload on stroke volume (Frank-Starling law) is described above.
- Afterload
- Increased afterload will lower EF while decreasing afterload has the opposite effect.
- For example, a septic patient with a baseline systolic HF (e.g. EF 30%) may show improving systolic function (e.g. EF 45%) due to ↓SVR. Following administration of vasopressor and reversing the vasodilation, EF will be reduced to the baseline.
- Increased afterload will lower EF while decreasing afterload has the opposite effect.
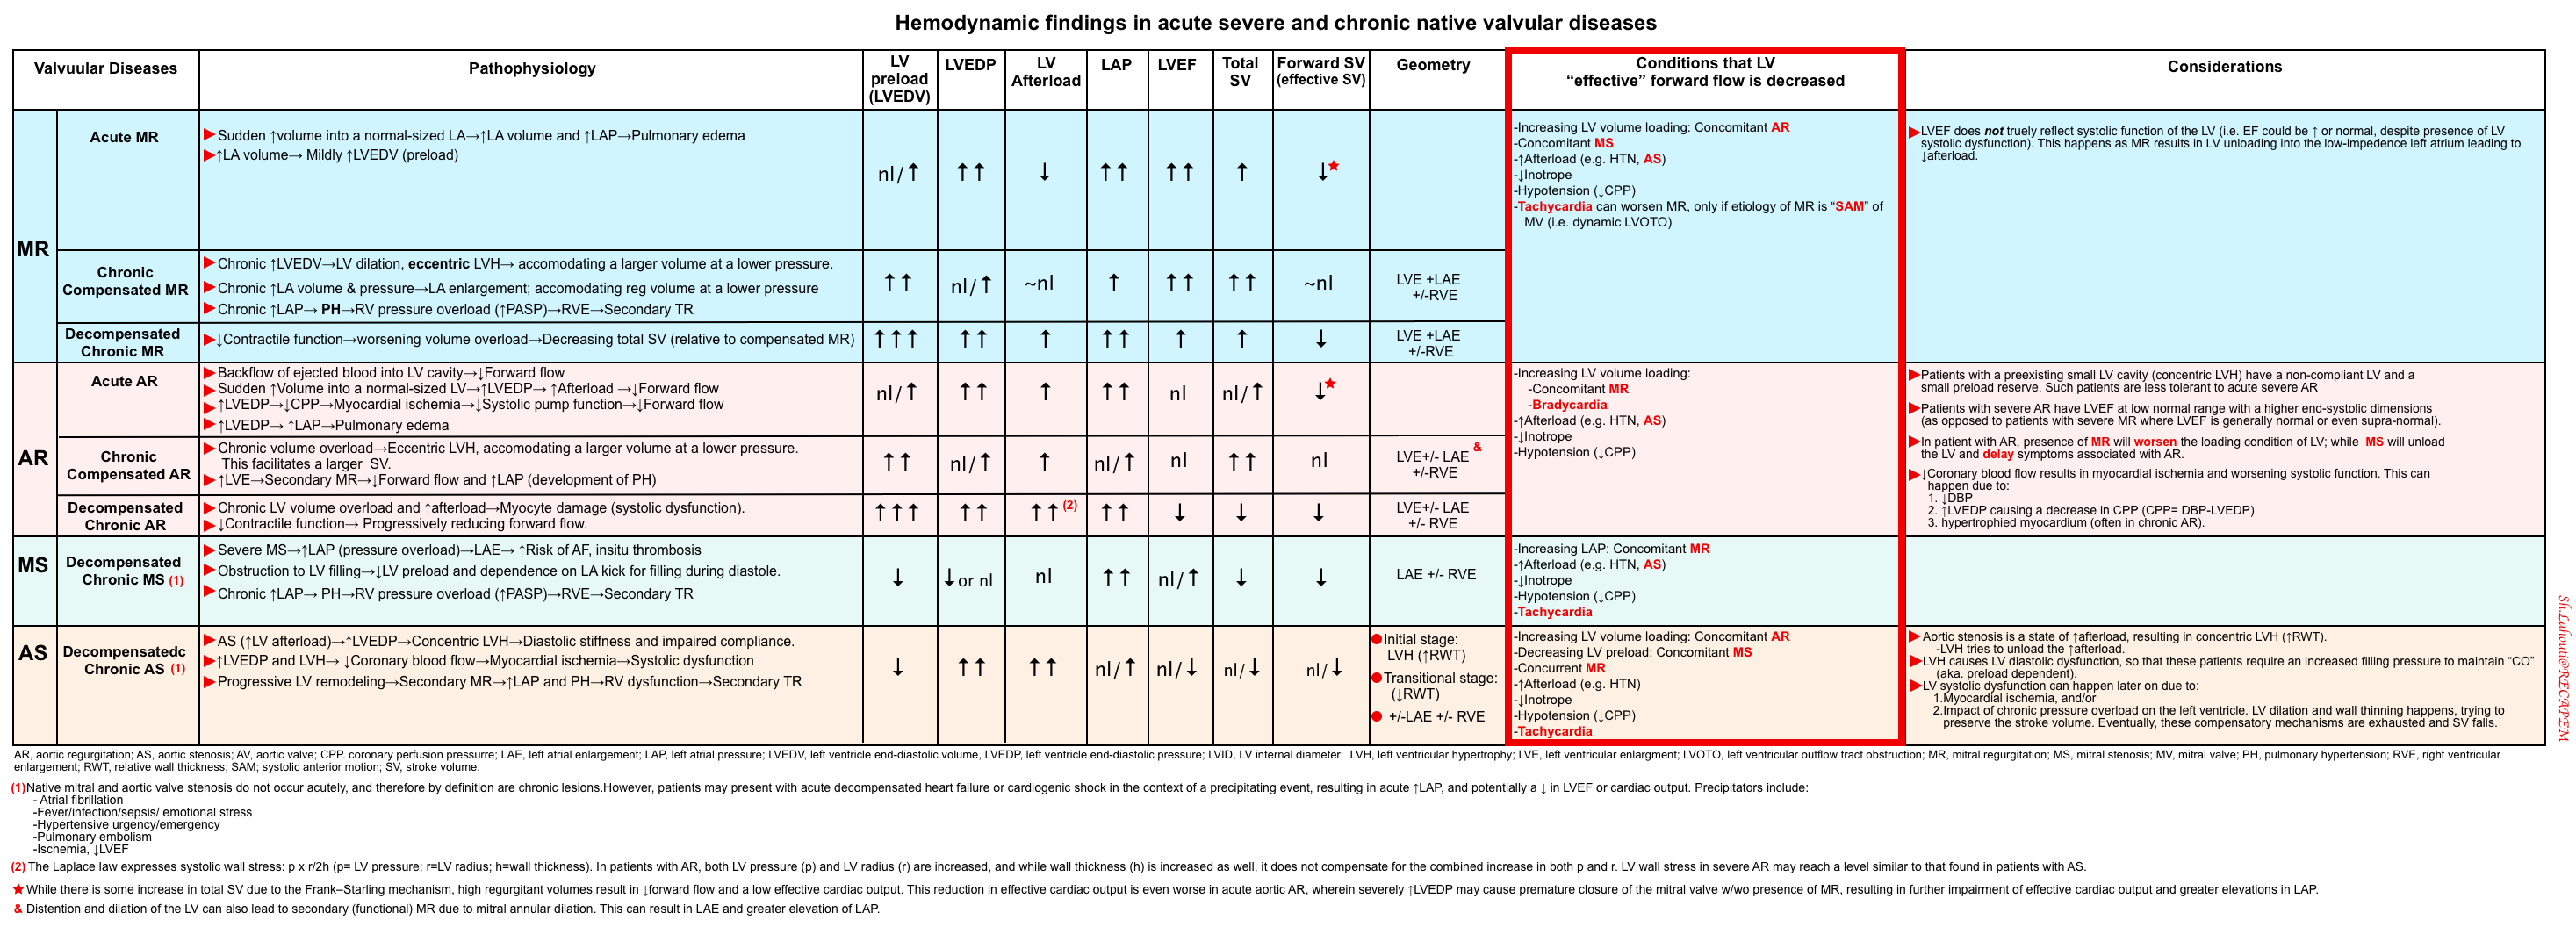
- LV Remodelling: The loading conditions (valvular heart disease) that can alter LV geometry are discussed here (summarized in the table below).
- Gross valvular lesions
- Acute severe valvular lesions affect EF and SV through the acute change in the loading condition of the cardiac chambers. The magnitude of this impact depends on:
- Severity of lesion. By and large, only severe valvular lesions can jeopardize hemodynamic status (with few exceptions!).
- Baseline cardiac function (e.g. acute valvular lesion is better tolerated in patients with normal LV function, compared with those with impaired systolic or diastolic LV function, ischemia) *.
- Chronic valvular lesions affect EF and SV through the altered geometry of cardiac chambers (i.e. remodeling) *. The magnitude of changes in EF and SV depends on the severity and chronicity of the lesion.
- Initially, remodeling is an adaptive response to augment forward stroke volume.
- Remodeling in chronic regurgitant lesions (e.g. MR, AR) occurs by chamber enlargement (i.e. eccentric hypertrophy).
- Remodeling in chronic stenotic lesions (e.g. AS) occurs by ventricular wall thickening (concentric hypertrophy).
- In chronic MS, left atrial enlargement takes place.
- However in advanced stages, chronic pressure or volume overload results in a maladaptive phase of the disease characterized by decreased contractility (i.e. ↓EF and/or SV).
- Initially, remodeling is an adaptive response to augment forward stroke volume.
- Acute severe valvular lesions affect EF and SV through the acute change in the loading condition of the cardiac chambers. The magnitude of this impact depends on:
- Multiple and mixed valvular heart disease (VHD)
- Multiple VHD refers to the combination of stenotic or regurgitant lesions occurring on ≥2 cardiac valves.
- Mixed VHD refers to the combination of stenotic and regurgitant lesions on the same valve *.
- The hemodynamic and clinical consequences of any given valvular lesion may be modulated by the concomitant presence of mixed or multiple VHD. These hemodynamic interactions can promote, exacerbate, or, in contrast, blunt the clinical expression of each singular lesion *.
- Gross valvular lesions
- In the following table, primary valvular lesions and associated factors that may reduce LV effective forward flow (👉red box) are summarized *,*.
Hyperdynamic left ventricle in shock state
- Background
- Hyperdynamic LV refers to near obliteration of the left ventricular cavity during systole.
- ⚠️A hyperdynamic LVEF is not a good sign!
- A retrospective cohort study in patients with septic shock shows that both severe LV systolic dysfunction (LVEF < 25%) and hyperdynamic LVEF (LVEF ≥ 70%) were associated independently with significantly higher in-hospital mortality *.
- In several studies, hyperdynamic LVEF is associated with an increased risk of mortality among critically ill ICU patients *,*,*.
- 💡Clinical hints: A normal or hyperdynamic LVEF in a patient in a shock state, virtually rules out systolic heart failure as the cause of shock *.
- Differential diagnosis
- The possible diagnostic approach to hypotensive patients with hyperdynamic left ventricle is shown below. (Of note, unstable patients may defy any algorithmic approach due to hemodynamic complexity, the purpose of the following approach is to highlight common causes of hyperdynamic left ventricle).
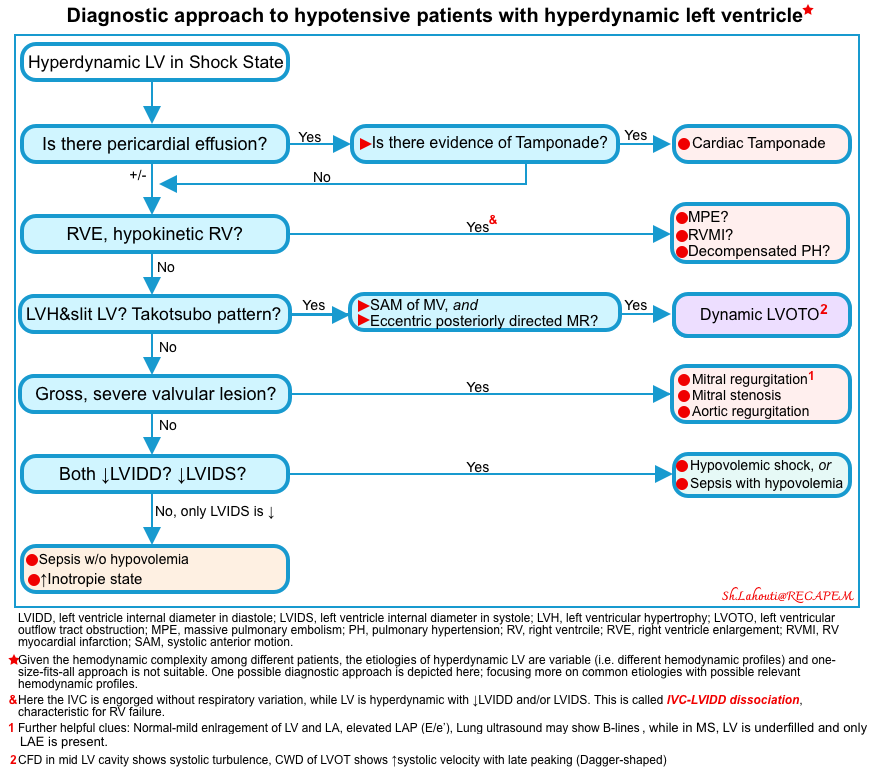
Is there pericardial effusion? Is there evidence of tamponade physiology? Echocardiographic signs of tamponade include:
- Chamber collapse
- RA collapse during atrial diastole (when tricuspid and mitral valve are closed): This is an ‘earliest sign’ of tamponade, though it’s not a highly specific finding. The duration of RA collapse (RA Collapse > 1/3 cardiac cycle) is a more accurate sign for tamponade.
- RV collapse during ventricular diastole is a later finding in tamponade but is the most specific sign for tamponade.
- 💡If you see a chamber collapse on echo, pause there and identify whether it is collapsing during systole or diastole. Systolic collapse per se can happen during a hypovolemic state.
- Plethoric IVC (size > 2.1 cm with collapsibility < 50%) is reasonably sensitive but lacks specificity for tamponade.
- Respiratory transvalvular Doppler variation: ↑Variation in RV inflow velocity to ( >50%) and LV inflow velocity to (>25%).
- Swinging-heart: Heart movement within a large amount of pericardial effusion.
- More on tamponade 👉 here.
Diagnostic challenge
- Low-pressure tamponade (20% of patients with tamponade)
- Patients meet diagnostic criteria for tamponade on echo, except that IVC is not plumped *.
- Pathophysiology: It happens when ‘severe hypovolemia’ is superimposed on tamponade. Volume loss can be caused by severe traumatic hemorrhage in patients with acute tamponade, or by long-term diuretic use, excessive dialysis, and dehydration in patients with subacute tamponade.
- Oftentimes the initial step in management involves volume resuscitation e.g. crystalloid or blood depending on the clinical context. This may have one of two general consequences:
- The patient stabilizes, and no longer has any significant tamponade. Such patients remain at risk for subsequently developing tamponade, but they don’t represent an immediate emergency.
- The central filling pressures increase, but this doesn’t cause clinical improvement. At this point, the patient has transitioned to a typical state of tamponade (aka, “high-pressure tamponade”).
- Tamponade with atypical chamber collapse
- The likelihood of cardiac chamber collapse is influenced by:
- Net balance between the two opposing forces: The intra-pericardial pressure which puts restraint on chamber distensibility during diastole, and the intracardiac end-diastolic pressure within the chambers.
- The wall thickness of cardiac chambers
- Right-sided chamber collapse may be absent in conditions where either RV end-diastolic pressure is very high, or RV wall thickening is present *. Right-sided chamber collapse may be absent in the following conditions:
- The likelihood of cardiac chamber collapse is influenced by:
- Tamponade with atypical regional effusion
- Etiology: after cardiac surgery, pericardiotomy
- Localized effusion, if limited around the left heart, may not show some typical clinical and echocardiographic findings of classic tamponade. The jugular vein distension and right-sided chamber collapse on echo could be absent *.
Is there evidence of RV strain including RVE (RV/LV ratio>1, hypokinetic RV)?
- Presence of RV strain and hyperdynamic LV is suggestive of RV failure secondary to PE, RV myocardial infarction, and decompensated pulmonary hypertension * (video 1 below).
- When the lung is not perfused, the pulmonary venous return to the left atrium is reduced (↓LV preload).
- Other clues:
- IVC-LVIDD dissociation refers to plumped IVC while LVIDD is reduced.
- Both LVIDD and LVIDs are reduced.
- Pulmped IVC without respiratory collapsibility.
- Lung ultrasound: A-profile (unless the patient has pre-existing interstitial lung disease e.g. pulmonary fibrosis).
- IVC-LVIDD dissociation refers to plumped IVC while LVIDD is reduced.
- Echo can provide further diagnostic clues to differentiate causes of RV failure (👉here).
Is there evidence of left ventricular outflow tract obstruction (LVOTO)?
- LVOTO is an important cause of shock since if unrecognized, it will fail to respond to standard hemodynamic therapies (more on this👉 here).
- The first feature to recognize LVOTO is a ventricle susceptible to LVOTO (substrate); for example, one of the following:
- Left ventricular hypertrophy with small chamber size. This happens in patients with hypertensive cardiomyopathy, or hypertrophic obstructive cardiomyopathy (left video below).
- Takotsubo pattern. LVOTO can occur in the classic pattern of Takotsubo cardiomyopathy with apical hypokinesis (apical dilation) and hypercontractility of the base of the heart. Apical hypokinesis causes septal angulation which, combined with basal hyperkinesis, causes LVOTO (right video below).
- Physiologic trigger for dynamic LVOTO: Endogenous high sympathetic tone, exogenous inotropes, tachycardia, ↓preload (hypovolemia), ↓afterload.
- 2D echo shows:
- SAM of MV: During systole, the mitral valve leaflets are tugged towards the septum.
- MR: Eccentric, typically hugging the posterolateral left atrium.
- Color flow Doppler: Mid-LV systolic turbulent flow
- Continuous wave Doppler of LVOT: ↑systolic velocity with late peaking (Dagger shaped). The maximal pressure gradient can be calculated based on the modified Bernoulli equation (Pressure = 4 x velocity2).
- LVOT gradient >50 mm Hg (3.5 m/s) is severely elevated.
Video on the left screen (hypertrophic obstructive cardiomyopathy): left ventricular hypertrophy with systolic anterior motion of mitral leaflet resulting in LVOTO. The video on the right shows anterior-apical hypokinesia and basal hyperkinesis, resulting in apical ballooning and a sigmoid-shaped septum. https://doi.org/10.1016/j.jccase.2021.04.020
Is there gross evidence of a “severe” valvular lesion?
- Mitral regurgitation: MR is marked by a state of decreased afterload (unloaded LV), i.e. the LV outflow is directed preferentially to a pathway with lower resistance (i.e. left atrium). LV contraction is commonly hyperkinetic in acute MR *.
- Common causes of acute MR: Papillary muscle rupture (secondary to AMI), chordal rupture, myocardial ischemia (leading to leaflet tethering), and dynamic LVOTO *.
- Clues: Hyperdynamic LV in the presence of normal-enlarged left chambers (mild LAE and LVE), ↑LAP (↑E/e’), and B-lines on lung ultrasound.
- More on MR👉 here.
- Severe mitral stenosis can cause an underfilled left ventricle with severe enlargement of the left atrium but not the left ventricle.
- Acute aortic regurgitation (AR)
- In Acute AR, the regurgitant volume fills the small LV that has not had time to dilate, resulting in an acute ↑LV diastolic pressure (leading to ↑LAP and pulmonary edema) and a fall in forward cardiac output (resulting in hypotension and cardiogenic shock) *.
- The two most common causes of acute AR of a native aortic valve are endocarditis and aortic dissection.
- Bedside echo: Look for evidence of ⚠️aortic dissection:
The video on the left of the screen shows acute MR, post-ischemic papillary muscle rupture, and hyperdynamic LVEF (PMID: 37530859). The video on the right shows acute AR secondary to aortic dissection.
Is the internal diameter of LV at diastole and systole reduced? 👉Measure LVIDD and LVIDS.
- ↓LVIDD, ↓LVIDS: Underfilled LV in both end-diastole and end-systole *.
- Causes: Hypovolemia should be strongly considered.
- Absolute hypovolemia e.g. hemorrhagic shock
- Relative hypovolemia e.g. sepsis with hypovolemia (secondary to severe vasodilation) *
- Causes: Hypovolemia should be strongly considered.
- ↓LVIDS, LVIDD nl: Hyperdynamic LV (underfilled LV at end-systole) without hypo/hypervolemia
- Pathophysiology: A ↓LVIDS in the presence of euvolemia could depict ↓systemic vascular resistance (SVR), or increased inotropic state *.
- Causes:
Video 1 (left of the screen) the probe marker to the left (left ventricle and right ventricle are labeled in all videos): A hyperdynamic LV with an associated hypodynamic and enlarged RV suggests RV failure (PMID: 33160549). Video in the middle panel (A4C view) The presence of a small, hyperdynamic LV cavity with reduced LVIDD and LVIDDS. is suggestive of hypovolemic shock in a hypotensive patient. Video on the right of the screen (PSAX): A hyperdynamic LV, with a relatively preserved LV end-diastolic diameter, is suggestive of a distributive process. Later on, if vasodilation is not addressed, relative hypovolemia occurs and LVIDD is also reduced. https://doi.org/10.1093/ehjci/jeab149.
Hypodynamic LV in shock state
Referring to reduced LVEF.
- PCWP (LAP) is typically increased in patients with most classic types of cardiogenic shock (cold and wet, warm and wet). Lung ultrasound shows diffuse bilateral B-lines in these patients typical for cardiogenic shock.
Cardiogenic shock: Systolic heart failure with a hypodynamic LV and RV, and plumped IVC along with the wet lung pattern (diffuse bilateral B-lines ) on lung ultrasound. https://doi.org/10.1093/ehjci/jeab149
Etiology of hypodynamic LV in shock state (cardiogenic shock)
- ↓True contractility: Direct insult to myofibrils by:
- Ischemia: Acute myocardial infarction (involving >40% of the LV or with extensive ischemia).
- Cardiomyopathy: Myocarditis, septic cardiomyopathy, postpartum cardiomyopathy, drug-induced (e.g., beta-blockers).
- Structural (maladaptive remodeling): Chronic advanced stage of valvular heart disease.
- LV systolic dysfunction: ↓Cardiac output secondary to severe alteration of parameters that affect cardiac output e.g. heart rate, and loading conditions.
- Heart rate: Brady/tachy-dysrhythmias
- Loading conditions: Acute/severe change in preload and/or afterload. The underlying causes could be:
- Mechanical causes
- Ventricular septal rupture, ruptured ventricular wall aneurysm, decompensated advanced valvular heart diseases, or new valvular lesion in patients with pre-existing systolic dysfunction.
- Physiologic causes (of note, patients with pre-existing cardiac dysfunction cannot tolerate significant changes in loading conditions since their physiologic reserve is limited).
- ↑Afterload, ↑preload
- Iatrogenic vasoconstrictive shock: Excessive use of vasopressors (esp. the combination of norepinephrine and vasopressin) can lead to a vasoconstrictive shock in patients with poor cardiac function (wherein excessive vasoconstriction causes a drop in cardiac output, causing low cardiac output and shock).
- Endogenous catecholamine surge, e.g. SCAPE (sympathetic crashing acute pulmonary edema)
- Catecholamine surge leads to volume redistribution (from the peripheral vascular system to central circulation= ↑preload) and arterial vasoconstriction (↑afterload) which leads to myocardial O2 demand and resistance to forward flow *.
- SCAPE patients may be hypervolemic, euvolemic or hypovolemic. Keep in mind that the problem is the redistribution of fluid into the lungs, rather than hypervolemia. Therefore, the IVC will not necessarily be distended.
- Echo generally reveals some form of heart failure, for example:
- Systolic heart failure, with ↓LVEF (these patients more likely show a hypodynamic LV).
- Diastolic heart failure may be suggested by LVH and an LAE (these patients are more likely to show a hyperdynamic LV).
- Acute volume overload (e.g. diuretic nonadherence, dietary indiscretion), especially in patients with regurgitant valvulopathies e.g. MR.
- Acute hypovolemia (e.g. over-diuresis, reduced oral intake, gastroenteritis), especially in patients with a thick wall LV. Patients with stenotic vulvulopathies e.g. MS, AS; are poor tolerant to hypovolemia.
- ↑Afterload, ↑preload
- Mechanical causes
RV Function
Basic physiology
- The right ventricle (RV) has a thin wall. By and large, RV is a volume pump generator (rather than a pressure pump generator), thus pressures within RV are lower than pressure within the LV.
- RV stroke volume depends on:
- RV preload (CVP≈ RAP)
- RV contractility
- RV afterload (pulmonary vascular resistance)
Right ventricular pressures (measured by pulmonary artery catheterization “PAC”)
- RV systolic pressure: 15-25 mm Hg
- RV end-diastolic pressure: 3-12 mm Hg
Etiology of right heart dysfunction/failure
- Causes of ↑↑RVSP (note that RVSP >60mm Hg are unusual in acute condition and typically suggests chronically elevated pulmonary pressures) *.
- Pulmonary hypertension
- Pulmonic stenosis
- Pulmonary embolism
- Hypoxemia, acidemia.
- Positive pressure ventilation.
- Causes of ↓RVSP (impaired RV contractility) *
- RV ischemia/ infarction
- Cardiomyopathy, e.g. septic cardiomyopathy, myocarditis.
- Arrhythmogenic right ventricular dysplasia (ARVD)
- Tach/bradyarrhythmias
- Causes of ↑RVSP, ↑RVDP (these may also cause a mild elevation in RVSP but generally not as severe as the causes listed above)*
- RV pathologies (RV infarction, cardiomyopathies)
- Atrial septal defect (with left-to-right shunt)
- Massive volume overload
- Pericardial disease, e.g. constrictive pericarditis, tamponade.
- Causes of ↓RVEDP (↓RV preload)
- Hypovolemia
- Capillary leak, sepsis
- Superior vena cava syndrome
- Tricuspid stenosis
Echocardiographic indices of RV function
| 🔵RVIDD (right ventricle internal diameter at end-diastole). Abnormal values: ⚠️Basal diameter >42 mm (A4C view) ⚠️Mid-diameter > 35 mm (A4C view) |
|---|
| 🔵Right ventricular outflow tract (RVOT) proximal diameter (PLAX view). Abnormal value: ⚠️ ROVT diameter > 27 mm |
| 🔵RVIDD/LVIDD ratio ⚠️Ratio > 0.6 is abnl. ⚠️⚠️A ratio > 1 reflects significant RV dysfunction and has prognostic value. |
- RV internal diameter in end-diastolic (RVIDD)
- Two sites are commonly used: basal distance (at the tricuspid annulus) and mid-right-ventricular measurement (in the middle segment of the RV).
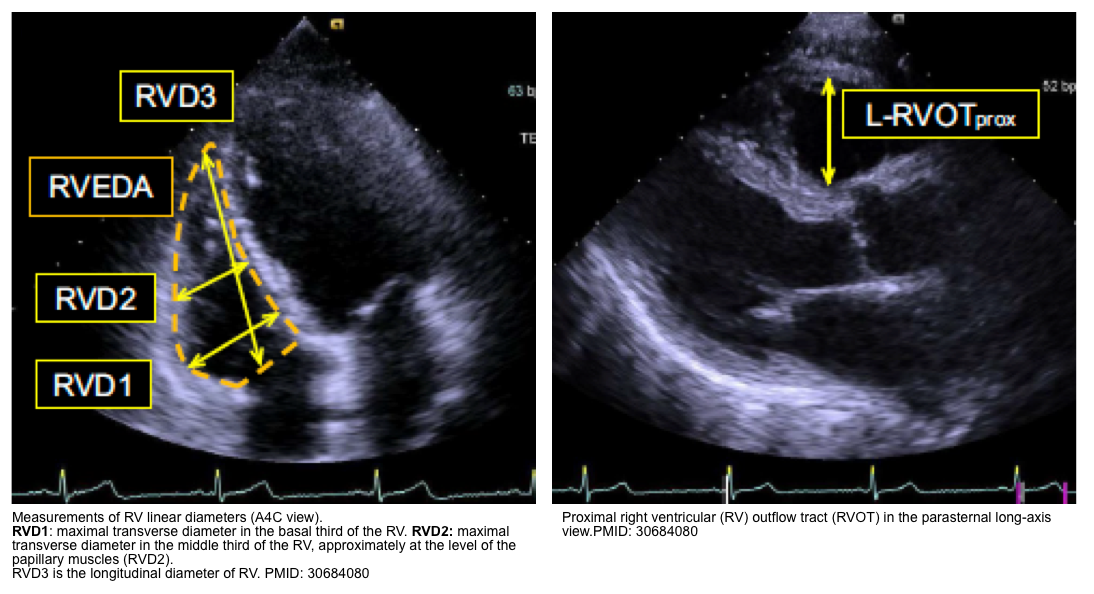
- RVIDD/LVIDD ratio: It should be measured at the widest point of the right ventricle in a standardized 4C plane *. A ratio >0.6 is abnormal *.
| 🔵Interventricular septal (IVS) motion |
- Abnormal IVS motion:
- End-diastolic flattening: Indicate RV volume overload
- End-systolic flattening: Signifies RV pressure overload. This will lead to a change in LV shape in the short axis to a D-shape.
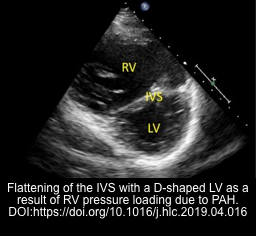
| 🔵RVWT (Right ventricular wall thickness). ⚠️RVWT>5 mm is abnl. |
- RV wall thickness is measured at end-diastole in the subcostal four-chamber view or the parasternal views.
- RVWT >5 mm may suggest “chronic” pulmonary hypertension *.
- However, wall thickening may increase within 48 hours, so this can develop rapidly in the context of acute pulmonary hypertension *.
- RVWT >10 mm suggests that the PA pressure may be approaching systemic pressures *.
Video on the left screen: PLAX view showing proximal ROVT enlargement and RV hypertrophy. Video on the right: PSAX view showing RV enlargement and hypertrophy with D-shaped LV. Pericardial effusion is present in both cases.
| RV systolic function |
|---|
| 🔵TAPSE (tricuspid annular plane systolic excursion). Values: ✅Normal value > 16-20 mm 🟠Mild 11-15mm 🔴Moderate: 6-10mm ⚠️Severe: <5mm |
- TAPSE is a measurement of longitudinal systolic performance of the right ventricle.
- Measurement: 2D A4C view. The M-mode cursor is directed through the lateral annulus of the tricuspid valve, and the distance of annular motion during systole is measured longitudinally.
- Diagnostic value:
- A TAPSE <16 mm is considered to be abnormal with good specificity, but poor sensitivity *.
- In the right ventricle, systolic parameters are mostly afterload-dependent. Therefore, in the setting of pulmonary vascular disease
- A low TAPSE gives insight into RV afterload (PASP).
- A low TAPSE does not indicate poor “true contractility” of the RV. Following treatment of PH, TAPSE will increase to a normal level.
- Prognostic value: TAPSE <16 mm is associated with unfavorable prognosis in patients with acute pulmonary embolism *.
- Monitoring value: For serial monitoring of RV systolic function *.
| RV systolic function |
|---|
| 🔵TV Annulus TD (S’ velocity). Normal value: S’ velocity ≧ 10 cm/s |
- This is similar in many ways to TAPSE (evaluating longitudinal function), however, RV S’ is highly reproducible *.
- Measurement: A4C view, Tissue Doppler. Get the pulsed wave (PW) sample volume at the lateral tricuspid annulus. S’ velocity refers to the systolic excursion of the tricuspid valve annulus.
- Diagnostic value
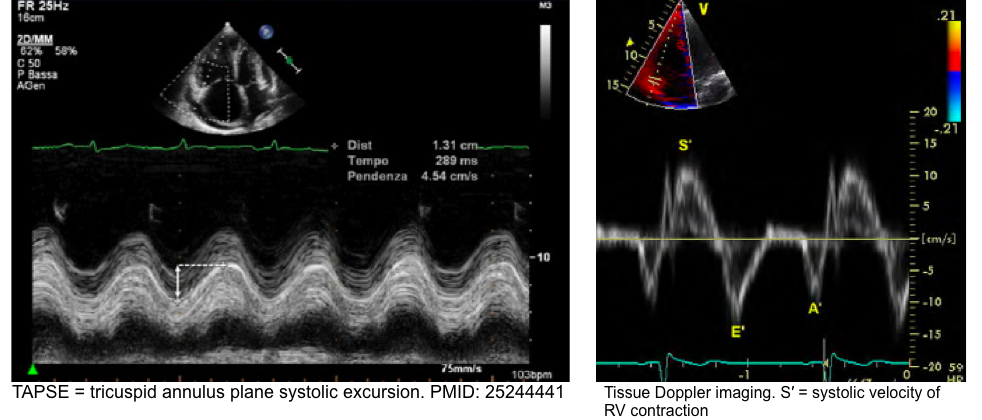
RV Preload
- RV preload depends on:
- Systemic venous return. This in turn depends on intra-thoracic pressure, MSFP (venous compliance, and volume status).
- Atrial kick, ventricular compliance, pericardial compliance.
- Loading conditions for example RV preload is increased in TR.
Hemodynamic index of RV preload
- CVP is the pressure recorded from the right atrium or superior vena cava and is representative of the filling pressure of the right side of the heart.
- CVP is approximately equal to right atrial pressure (RAP).
Diagnostic performance of CVP (≈RAP)
- As explained before, some hemodynamic variables are useful primarily as a threshold. An elevated CVP (e.g. CVP >10 mm Hg) reflects RV pressure overload, although this gives no information on the precise etiology involved *.
- CVP is more diagnostically useful when its value sits in extreme ranges.
- Static hemodynamic parameters (e.g. CVP, LAP) do not predict fluid-responsiveness and should not be used as the primary determinant of fluid administration *.
- However, they can be considered to predict fluid tolerance, if used in an appropriate clinical context.
- CVP may be normal in classic cardiogenic shock (cold and wet).
- The classic clinical pattern of cardiogenic shock is low cardiac output despite elevated PCWP (LAP). CVP may be normal in this context. Therefore a CVP value in the normal range does not exclude the diagnosis of cardiogenic shock (See more on cardiogenic shock here).
- Hypervolemia
- High PEEP setting
- LV failure (HFrEF, HFpEF)
- Diseases of the RV (e.g. RV infarction or cardiomyopathy), restrictive cardiomyopathies.
- Pulmonary hypertension (PH)
- Cardiac tamponade, constrictive pericardial disease
- Pulmonic stenosis
- Left-to-right shunts
- Tricuspid valvular disease
Etiology of ↓RAP
- Hypovolemia
- Distributive shock
- Superior vena cava syndrome
The common etiologies of elevated RAP are summarized below *.
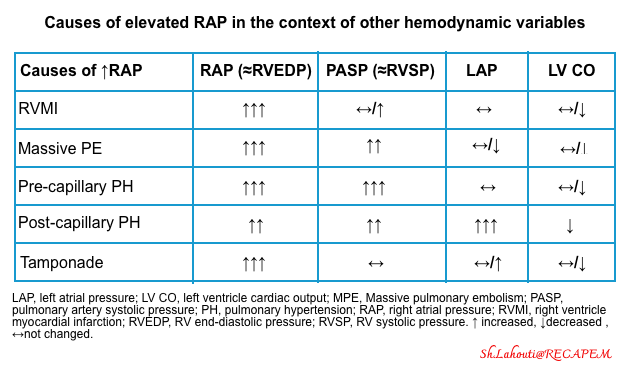
Clinical signs and symptoms of ↑RAP
- The following signs and symptoms can be present, though each has important limitations and may not be proportional to systemic venous pressure *,*.
- Pedal edema
- Delirium from congestive encephalopathy *, *
- Acute oliguric kidney injury with rising serum creatinine from congestive nephropathy *
- Right upper abdominal pain, transaminitis, and elevated total bilirubin from congestive hepatopathy *,*
- Gut edema resulting in increased endotoxemia (leaky bowel syndrome) *, *
- Bowel wall edema may promote bacterial translocation and systemic inflammation, adding a component of vasodilatory shock.
- Ascites
- Pericardial effusion
- Pleural effusion
Right atrial pressure: Ultrasonographic indices
| 🔵RAP (Right Atrial Pressure). Normal range: 2-6 mm Hg (measured by CVC). |
|---|
| 🔵IVC size and collapsibility ✅IVC size < 2.1cm with collapsibility > 50%: RAP 0-5 mm Hg. 🔴IVC size >2.1 cm with collapsibility > 50%: RAP 5-10 mm Hg. ⚠️IVC size > 2.1 cm with collapsibility <50%: RAP 10-20 mm Hg. |
| 🔵VExUS |
Ultrasound of IVC or IJV
- How IVC ultrasound can be helpful?
- Assessment of IVC diameter and collapsibility can be helpful clinically if it is interpreted correctly!
- IVC indices are useful to eliminate either the possibility of “overt relative” intravascular hypervolemia or hypovolemia in a given patient *.
- A small IVC with CI > 50% suggests that overt hypervolemia is unlikely.
- A plethoric (> 20 mm) noncollapsible IVC (with CI <30%) suggests that overt hypovolemia is unlikely.
- How IVC ultrasound can mislead you?
- IVC ultrasound should always be performed as part of a comprehensive hemodynamic evaluation including bedside echocardiographic exam.
- A small IVC with CI > 50% is “not equal” to hypovolemia.
- ↑Respiratory effort and abdominal compartment syndrome can cause highly collapsible IVC irrespective of volume status *.
- An empty IVC and hyperkinetic heart do not equal volume depletion. This combination of echocardiographic findings may result from either vasodilatory shock or hypovolemic shock.
- A plethoric IVC is “not equal” to hypervolemia.
- Upstream obstructive or cardiac pathologies can cause plethoric IVC regardless of volume status. These include *
- Cardiac tamponade
- Chronic severe pulmonary hypertension
- Massive pulmonary embolism
- Severe valvular stenosis
- Right ventricle myocardial infarction
- Severe tricuspid regurgitation
- Constrictive pericarditis and restrictive cardiomyopathy
- Upstream obstructive or cardiac pathologies can cause plethoric IVC regardless of volume status. These include *
- A small IVC with CI > 50% is “not equal” to hypovolemia.
- IVC ultrasound should always be performed as part of a comprehensive hemodynamic evaluation including bedside echocardiographic exam.
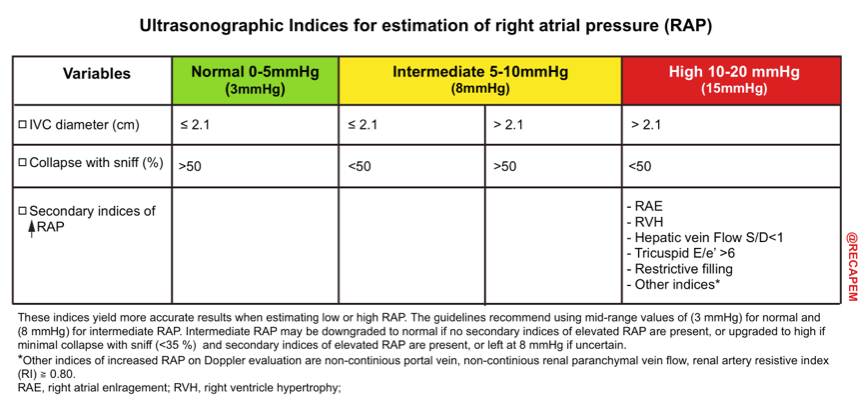
Doppler ultrasound of abdominal veins (VExUS: media below)
- Hepatic vein (HV) Doppler alteration
- As RAP increases, the pressure is transmitted to the hepatic vein, resulting in blunting of the forward systolic flow (S<D).
- The S-wave can be obliterated or become reversed with worsening congestion *.
- Portal vein (PV) Doppler alteration
- The main alteration in the PV waveform is a progressive increase in pulsatility with elevated RAP *.
- This can be quantified by the pulsatility fraction [(Vmax-Vmin/Vmax) × 100]
- Mild ↑RAP: Pulsatility fraction 30-50%
- Severe ↑RAP: Pulsatility fraction ≥ 50%
- Further increases in RAP may lead to flow reversal (below the baseline) during systole.
- Intra-renal vein Doppler alteration
- The normal intra-renal venous Doppler pattern is continuous with respiratory variation.
- Mild ↑RAP: Interrupted S and D phase
- Severe ↑RAP: Interrupted only D phase *.
- ⚠️Pitfalls: Abnormal Doppler pattern is not specific for congestion. It can happen in the following conditions:
- Primary organ disease (hepatic, renal)
- Vessel thrombosis or stenosis
- Raised intra-abdominal pressure
- Portal Vein PF >50% may be present in young age, athletes, low BMI, and hyperdynamic states *.
- To calculate VExUS score👉 VExUS Calculator
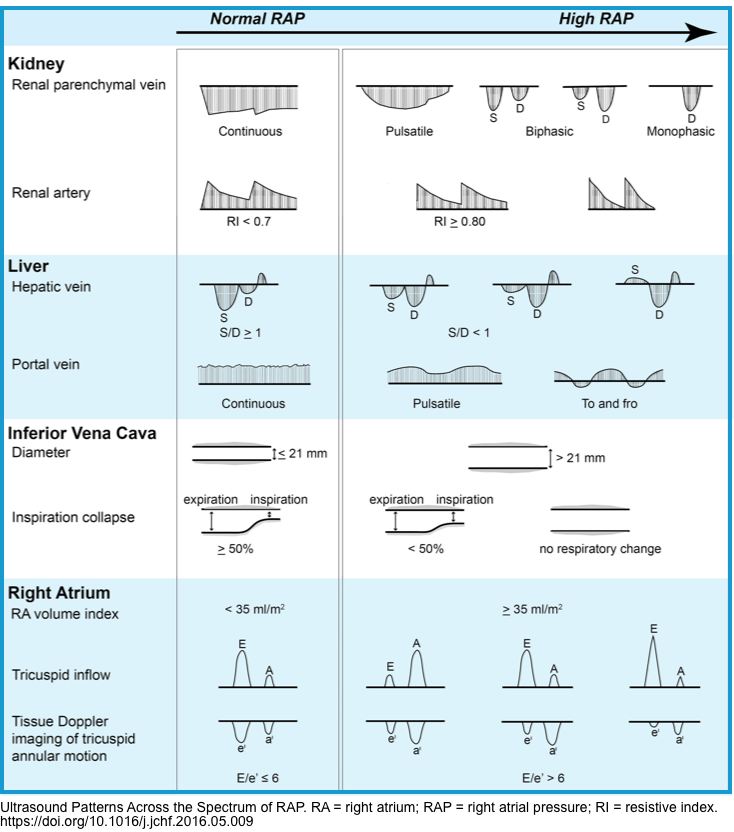
Pulmonary artery pressure
Basic pathophysiology
- RV-Pulmonary artery coupling
- The RV and pulmonary circulation function as a coupled unit. In a healthy physiologic state, pulmonary vessels are coupled to the thin-walled, distensible RV.
- RV works as a volume generator pump, that is to say, RV is designed to generate a large amount of blood flow without producing a high pressure.
- The product of the RV pump is pulmonary artery systolic pressure (PASP).
- Following the development of impedance to forward flow in pulmonary arteries (↑PVR), the thin-walled RV is incapable of perfectly adapting its performance to the new physiologic condition in the pulmonary artery vascular bed.
- This RV-PA uncoupling causes typical changes in RV performance (over time) including RV systolic dysfunction →RV enlargement→Variable degree of systolic and diastolic bowing of interventricular septum (IVS).
Pulmonary artery pressure
- Normal values (measured by pulmonary artery catheterization; “PAC”) include:
- Pulmonary artery systolic pressure (PASP): 15-25 mm Hg
- Pulmonary artery diastolic pressure (PADP): 8-15 mm Hg
- Mean pulmonary artery pressure (MPAP): 10-20 mm Hg
- Pulmonary hypertension is defined as MPAP >25 mm Hg (obtained through PAC)
Causes of ↑RVSP (Note that RVSP >60mm Hg are unusual in acute condition, and when it is seen, it typically suggests chronically elevated pulmonary pressures) *.
- Pulmonary hypertension
- Pulmonic stenosis
- Pulmonary embolism
- Other: hypoxemia, acidemia.
Echocardiographic indices of PAP
| 🔵PASP = RAP + 4 (TR jet velocity in m/s)2 . MPAP = (0.61 x PASP) +2. ⚠️MPAP > 35 mm Hg on echo suggests pulmonary hypertension |
|---|
| 🔵Pulmonary acceleration time (PAT) ⚠️PAT <105 m/sec reflects elevated pulm. vascular resistance. |
| 🔵Pulmonary systolic flow pattern ⚠️Presence of systolic notching rules in pulmonary arterial hypertension. |
- PA systolic pressure (PASP)
- PASP can be estimated based on the maximal tricuspid regurgitant (TR) jet velocity, using continuous wave Doppler (CWD) placed across the tricuspid valve plus right atrial pressure (RAP).
-
- PASP = RAP + 4(TR jet velocity in m/s)2
- Mean PAP = (0.61 x PASP) +2. (Mean PAP > 35 mm Hg on echo is in favor of PH)
-
- Technical pitfalls: Causes of inaccuracies in the estimation of PASP
- TR underestimated in compensated RV (for high ventricular pressure).
- Severe (free flow) TR results in equalization of right atrial and ventricular pressures.
- Pulmonary stenosis
- Severe RV systolic dysfunction
- Misalignment of CW Doppler signal: e.g., eccentric jets.
- Suboptimal CWD envelope
- Diagnostic value:
- In the acute condition of rise in afterload (e.g. acute PE) the thin wall RV is incapable of generating a high systolic pressure, thus PASP is often <60 mm Hg.
- Having said that, RV failure can develop in the absence of severely elevated PASP. The following statements can be made:
- PASP is a poor measure of RV afterload (especially in acute conditions).
- PASP is a poor predictor of RV failure.
- In the presence of RV dysfunction, a normal PAP should not dissuade you from suspicion of PH.
- However, if RV is chronically exposed to ↑afterload, RV wall hypertrophies to accommodate for a high systolic pressure. In such chronic conditions (e.g. PH) PASP is typically >60 mm Hg.
- PASP can be estimated based on the maximal tricuspid regurgitant (TR) jet velocity, using continuous wave Doppler (CWD) placed across the tricuspid valve plus right atrial pressure (RAP).
- Pulmonary acceleration time
- How to get PAT? Right ventricular outflow tract (RVOT), Pulse wave Doppler (PWD) gate just below the pulmonary valve cups.
- Normal PAT >130 m/sec
- Diagnostic value: A short PAT (e.g. <105 m/sec) reflects elevated pulmonary vascular resistance (PVR). A PAT < 60 m/sec may suggest acute PE.
- Monitoring value: In patients with PH, the response to treatment can be monitored as shown below.
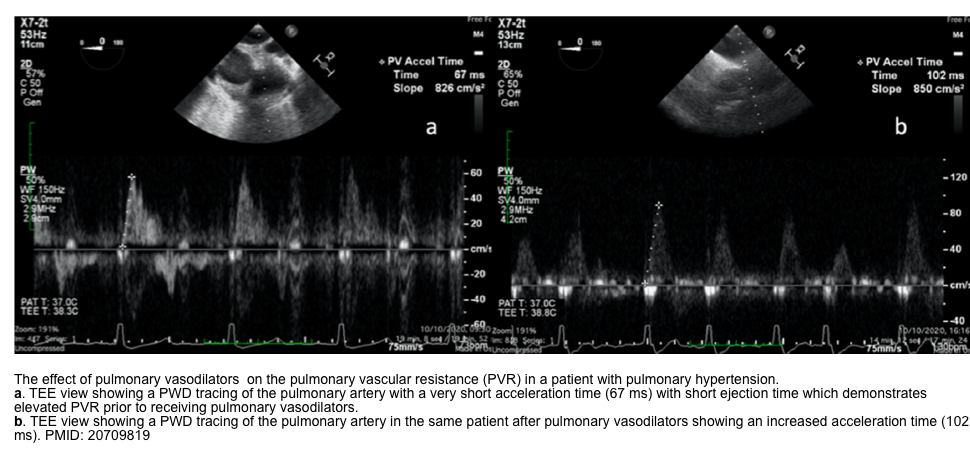
- RVOT systolic notching (pulmonary systolic flow Doppler pattern)
- Technique: Get a right ventricular outflow tract (RVOT) view, and put a pulse wave Doppler gate just below the pulmonary valve cups.
- The normal pulmonary systolic waveform has no notching.
- The presence of pulmonary systolic notching could indicate an elevation in the pulmonary vascular resistance (PVR).
- Diagnostic value:
- Presence of notching rules in pulmonary arterial hypertension.
- The absence of a systolic notch does not rule out pulmonary hypertension. Systolic notching may be absent in isolated post-capillary pulmonary hypertension (PH due to left heart disease) *.
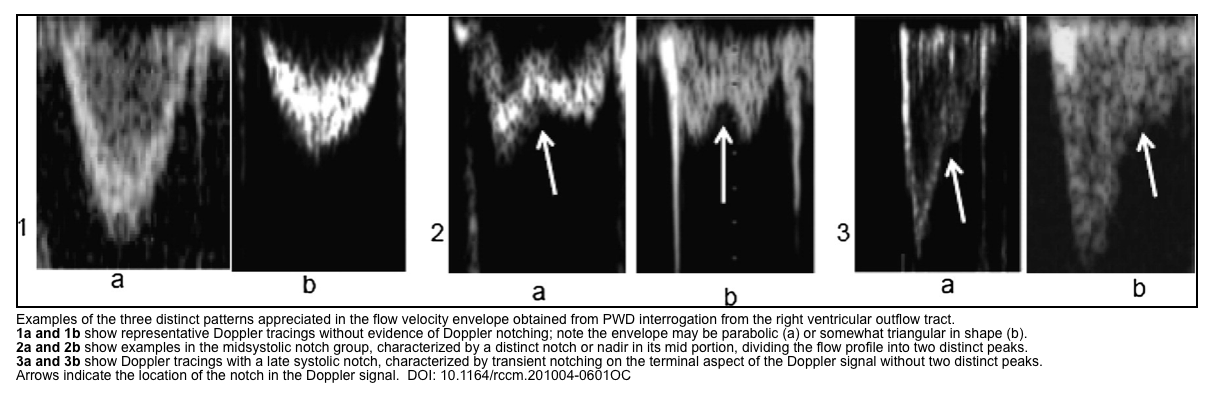
Clinical pearl: The presence of the following signs is more suggestive of chronic (rather than acute) causes of elevated pulmonary vascular resistance:
How to differentiate acute from chronic cases of RV dysfunction? Echocardiographic finding in the specific clinical setting of acute right-heart failure is summarized below.
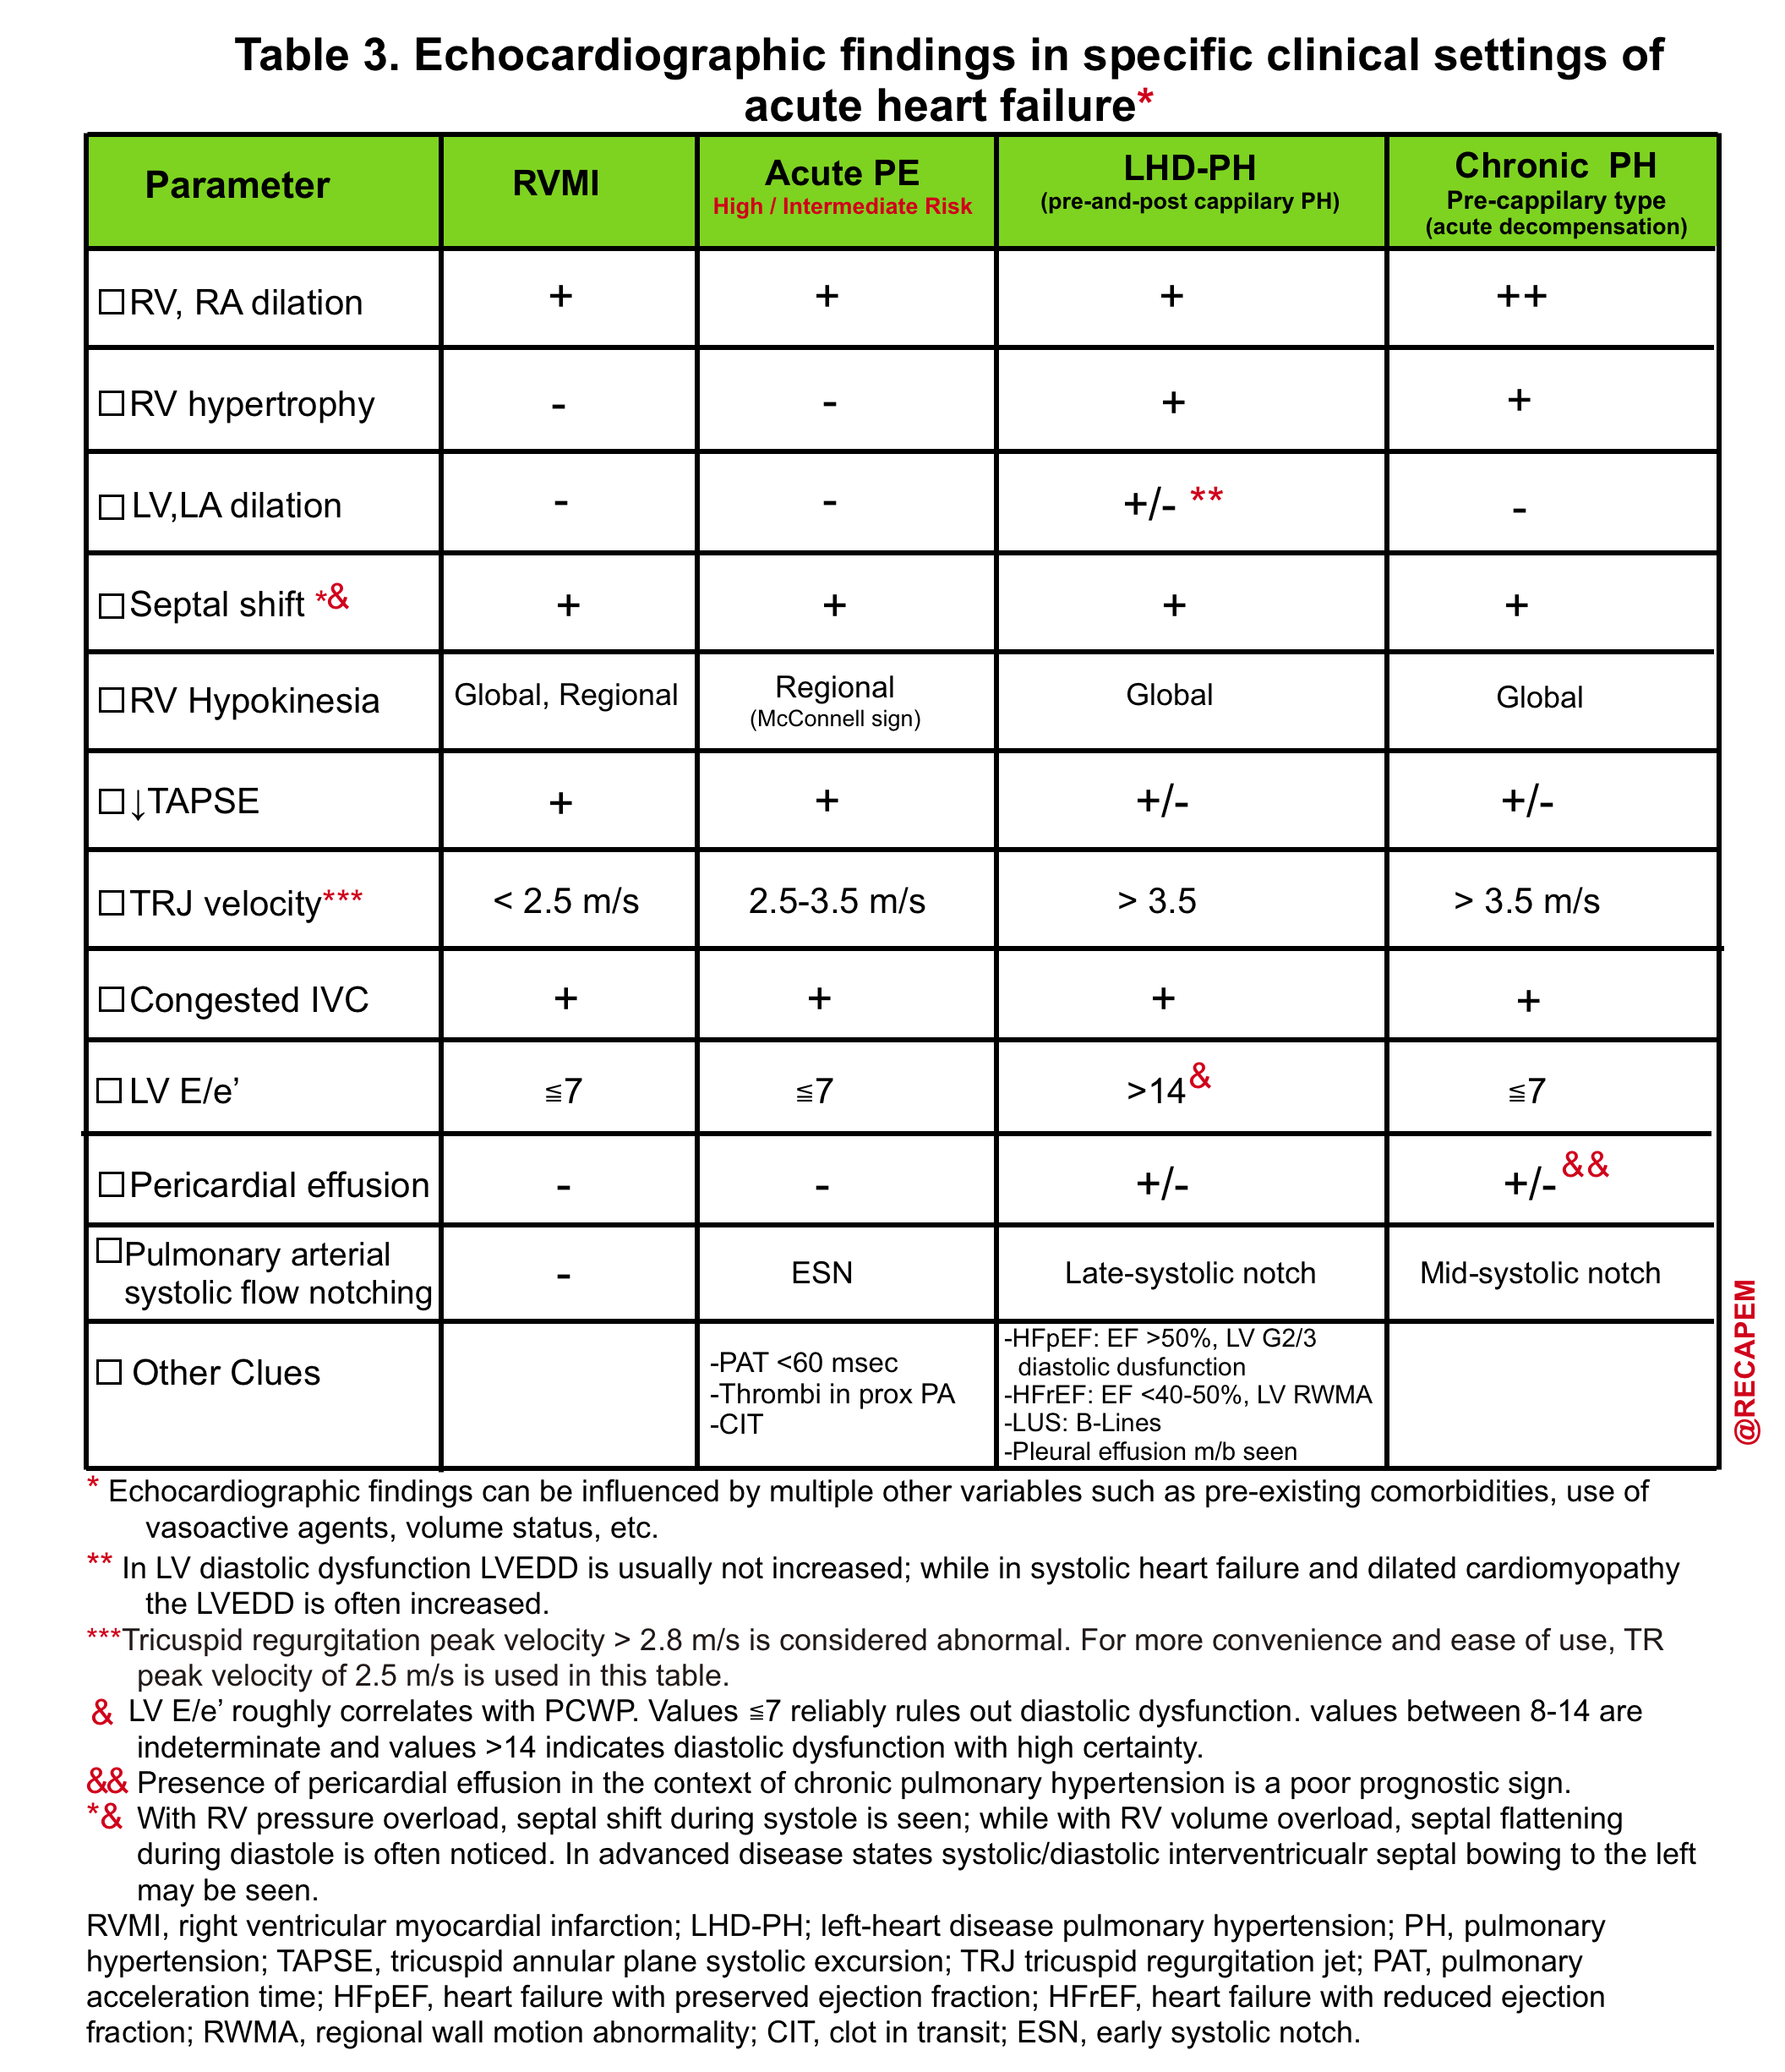
Echocardiographic Monitoring Parameters
Summary table
- The specific echocardiographic monitoring parameters and monitoring values are listed in the following table.
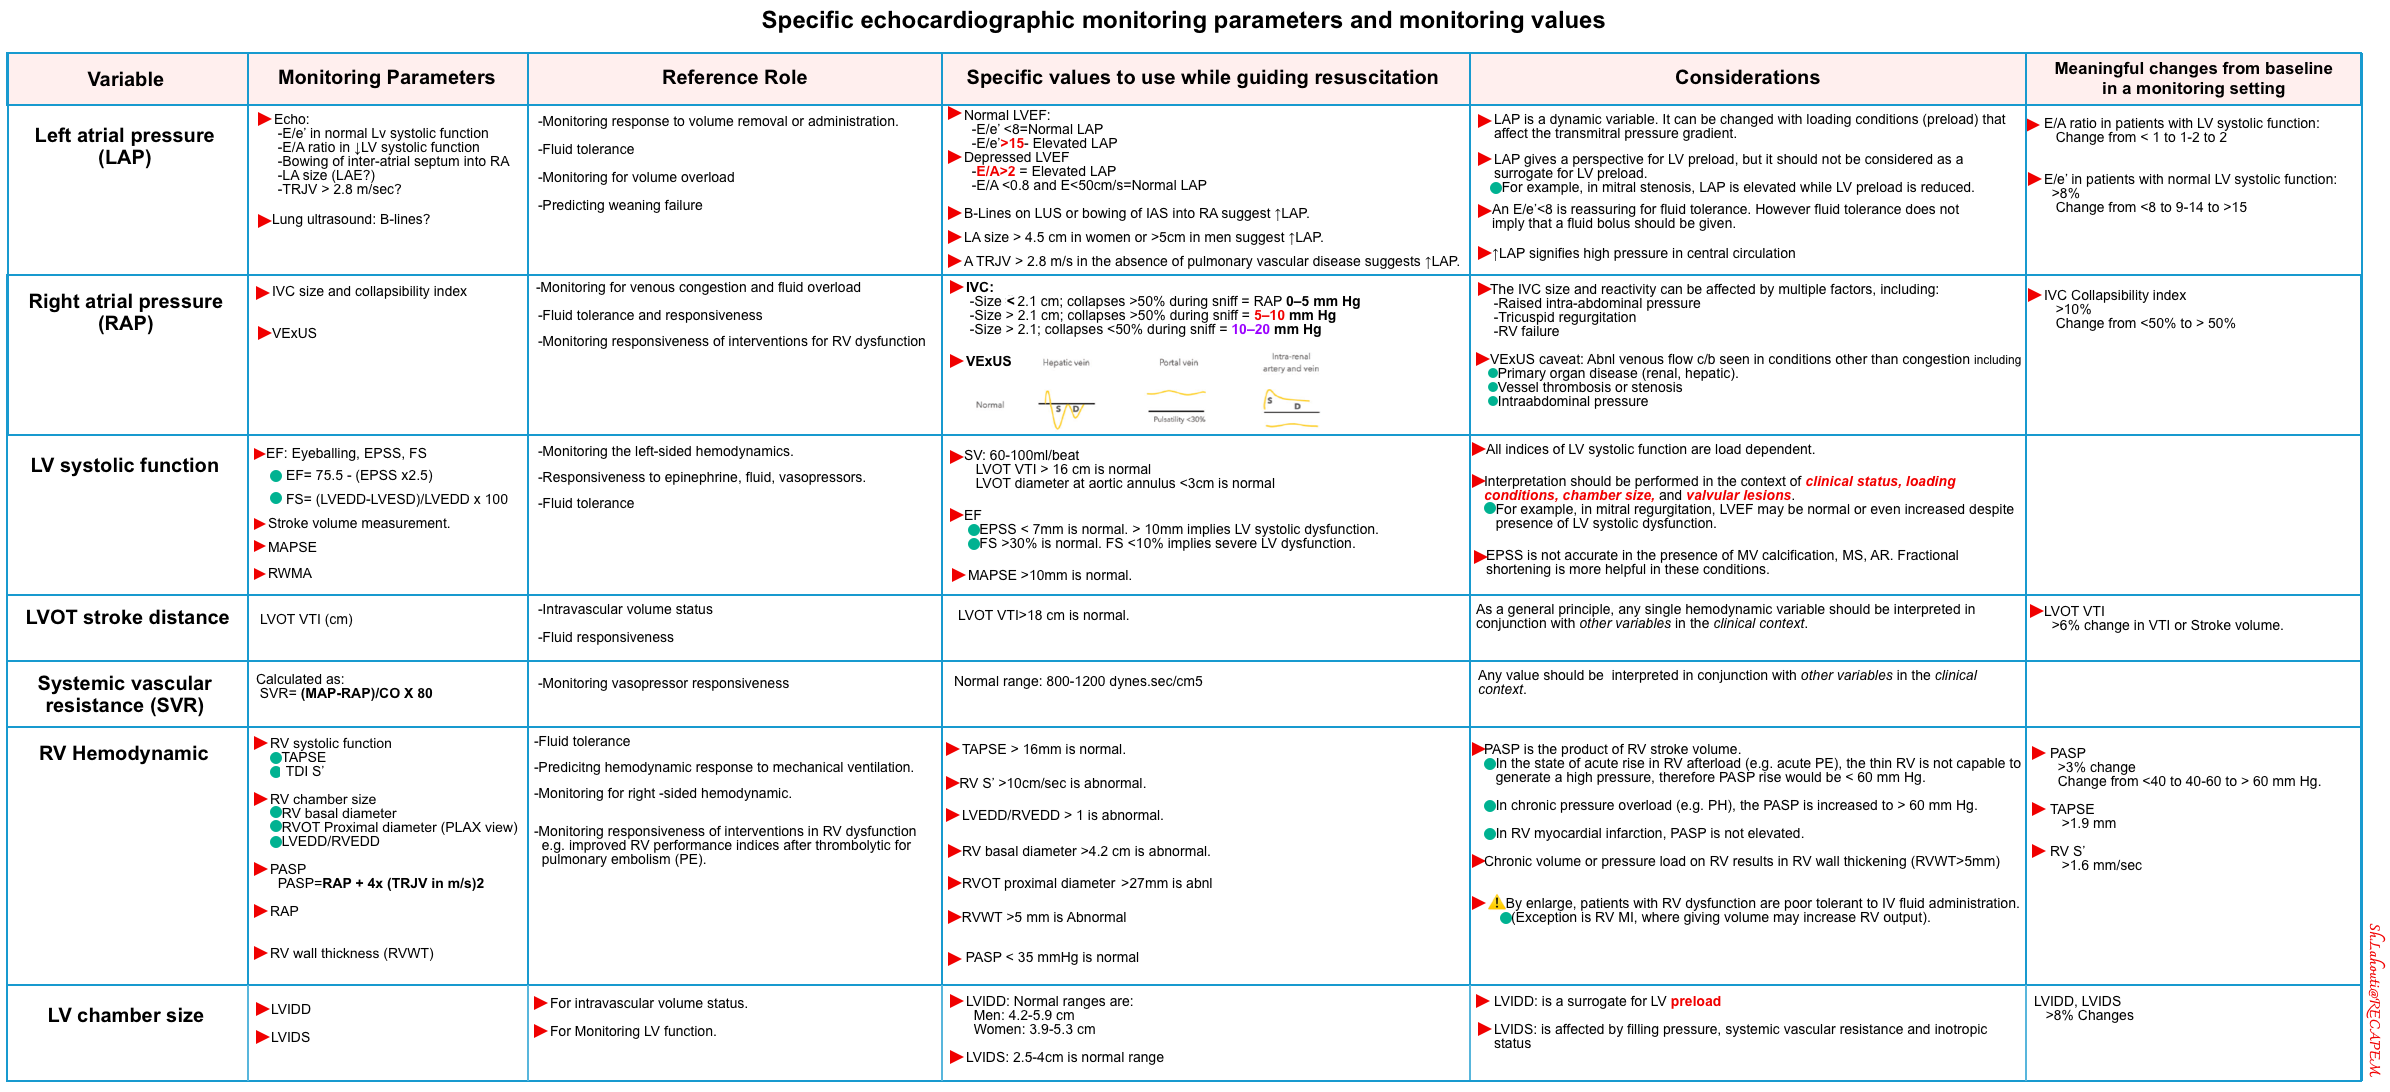
Microcirculatory static variables
| Elevated Lactate (e.g. > 2mM) |
- Background
- Lactate is produced by glycolysis and metabolized by the liver. Increased glycolysis results in increased lactate formation. Elevated lactate level in shock and other physiologic stress has been explained as:
- Endogenous epinephrine surge during physiologic stress contributes to the overproduction of pyruvate derived from stimulated glycolysis (figure below).
- This pyruvate surplus is beyond the mitochondrial capacity for generating ATP (via the TCA cycle). Therefore, excess pyruvate is converted into lactate *.
- Lactate is the source of energy, not a deleterious molecule.
- During shock lactate is consumed by the heart and brain as an energy substrate. It also increases the contractility of the cardiac myofibers. It also serves as a carbon source for the biosynthesis of glucose in the liver and kidney.
- Because of lactate’s association with outcome and with acidosis, it is unfairly regarded as a deleterious molecule, while it is a fundamental metabolic defense mechanism during shock. Rising lactate following initiation of epinephrine is generally a positive prognostic sign *.
- Bottom line
- Lactate is not an indicator of perfusion, systemic oxygenation, organ failure, or anaerobic metabolism.
- Lactate production in shock is largely driven by endogenous epinephrine stimulating aerobic glycolysis via beta-2 adrenergic receptors.
- Lactate is produced by glycolysis and metabolized by the liver. Increased glycolysis results in increased lactate formation. Elevated lactate level in shock and other physiologic stress has been explained as:
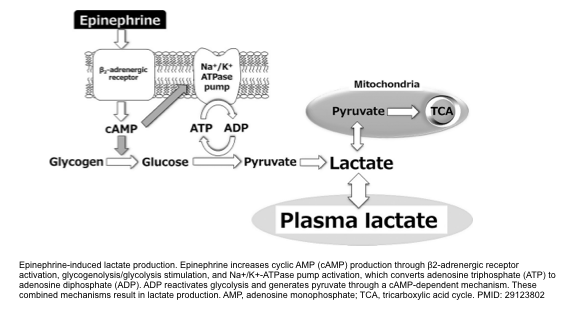
- Sampling and cut-off value:
- It can be measured from arterial, venous, or capillary blood.
- In general, arterial lactate is preferable since venous lactate is generally higher than arterial lactate and the 2.0 mmol/L cut-off is best established for arterial lactate.*
- Diagnostic value
- Elevated lactate is not very sensitive nor specific for the shock state.
- Elevated lactate is very nonspecific and there are many false positives including:
- Liver failure
- Seizures
- Physiologic stress
- Beta-2 receptor stimulation (e.g. epinephrine, albuterol administration) *
- Thiamine deficiency (e.g. due to persistent critical illness, or gastric bypass surgery).
- Lactate elevation is not very sensitive for diagnosis of shock.
- As explained above, increased lactate doesn’t reflect oxygen deficiency, but rather endogenous epinephrine in response to physiologic stress.
- Lactate can be normal in shocked patients who have inadequate sympathetic nervous function.
- Lactate cannot be used to differentiate between patients with and without shock *.
- Prognostic value
- Generally, elevated lactate level is worrisome.
- This should be interpreted in an appropriate clinical context. It can represent shock or some other impending disaster until proven otherwise *.
- Elevated serum lactate is an early indicator of shock and is particularly useful in the identification of occult shock (those who are normotensive or even hypertensive) *.
- Higher lactate levels were associated with increased mortality *.
- Better patient outcome is observed with decreasing lactate levels *.
- Generally, elevated lactate level is worrisome.
- Trending serial lactate levels to monitor a patient’s shock
- There is no clear evidence about what lactate adds to other resuscitation targets (e.g. blood pressure and urine output), and how lactate might guide treatment intensity.
- If lactate is trended during resuscitation, it should be interpreted carefully in the clinical context (lactate is not an indicator of inadequate oxygen delivery, so an elevated lactate should not be blindly used as a trigger to increase oxygen delivery). More on this here.
| Novel microcirculatory markers |
- Measurement of microcirculatory blood flow
- The sublingual mucosa is the preferred means to evaluate the microcirculation in critically ill patients because it shares an embryological origin with the splanchnic circulation and can be easily accessed at the bedside.
- Imaging of the sublingual microvasculature is typically obtained using advanced microscopy techniques, such as sidestream dark field imaging, or by near-infrared spectroscopy (NIRS). Early studies demonstrated alterations in microvascular flow in patients with sepsis and cardiogenic shock *.
- Other new techniques include tissue CO2 (tCO2) tension, tissue O2 (tO2) tension, and tissue O2 saturation (tSO2) measured by near-infrared spectroscopy.
- These are discussed separately.
Principles of resuscitation in shock
The monitoring and management of shock can be separated into “phases” of care, defined by changing monitoring and management priorities (figure below) *.

- Salvage phase
- 🎯Goal
- Correct hypotension as it is a strong predictor of mortality *.
- Restore and maintain MAP>65 mm Hg. The concept of an individualized resuscitative end-point has been explored above.
- Resuscitate proactively rather than resuscitate reactively (i.e. waiting for the patient to deteriorate further and then trying to solve the problem).
- Identify and treat severe cardiac dysfunction leading to a low cardiac output.
- Perform life-saving measures (e.g. revascularization for AMI)
- Correct hypotension as it is a strong predictor of mortality *.
- Hemodynamic monitoring: Echocardiography and bedside ultrasound should be performed *.
- 🎯Goal
- Optimization phase
- 🎯Goal: Improve oxygen delivery (DO2) to the tissues and re-establish organ perfusion.
- Hemodynamic monitoring
- Stabilization phase. The goal is to prevent organ dysfunction (even after hemodynamic stabilization).
- De-escalation phase
- 🎯Goal
- Weaning from vasoactive agents.
- Achieve a negative fluid balance (either through the use of diuretics or ultrafiltration).
- Hemodynamic monitoring: Critical care echo is helpful. (e.g. to wean inotropes when cardiac dysfunction is resolving).
- 🎯Goal
Salvage phase of resuscitation
Principles
- Take advantage of your POCUS skills to promptly identify the hemodynamic status of the patients and associated life-threatening conditions.
- Hemodynamic resuscitation
- Be proactive. Do not wait for blood pressure to drop to start vasoactive agents.
- Do not be obsessive about IV fluid. The fluid effect is not long-lasting.
- Generally, patients with clinically frank volume loss (e.g. gastroenteritis) deserve IV fluid.
- Active bleeding (e.g. massive upper GIB) warrants blood transfusion.
- Start vasoactive medications early and titrate aggressively to achieve appropriate MAP. In extreme situations, give push dose pressors and then start the infusion drip. More on vasoactive agents, below.
- Vasoactive agents should be selected based on individual hemodynamic profiles.
- Sympathetic crashing pulmonary edema (SCAPE) requires vasodilators (e.g. high-dose nitroglycerin) plus BiPAP.
- Do not be obsessive about IV fluid. The fluid effect is not long-lasting.
- Be proactive. Do not wait for blood pressure to drop to start vasoactive agents.
- Definitive treatment: Life-saving measures are definitive treatment for specific conditions. Prepare and consult accordingly. Some of these conditions include:
- Acute myocardial infarction: Revascularization. Consider transfer to PCI-capable center / cardiogenic shock center *,*,*.
- Valvular emergencies: Urgent surgery. Consider transfer to center to cardiogenic shock center/ Heart Team evaluation *.
- Aortic dissection (acute aortic syndromes): Vascular interventions. Consider transferring to a center with cardiothoracic/vascular surgery.
- Septic shock: Antibiotic and source control (e.g. debridement for necrotizing fasciitis).
- Massive pulmonary embolism: Thrombolytics, or embolectomy.
- Valvular emergencies: Urgent surgery. Consider transfer to center to cardiogenic shock center/ Heart Team evaluation *.
- Tamponade: Pericardial drainage. More on this, here.
- Considerations:
- Both catheter pericardiocentesis (under echo guidance) and surgical drainage are effective in removing pericardial fluid.
- There are no absolute contraindications for pericardiocentesis when the patient is in cardiac arrest or when hemodynamic is worsening *.
- If the clinical condition allows, the surgical method is preferred over pericardiocentesis. 👉Relative contraindications for pericardiocentesis:
- Type A aortic dissection.
- Ventricular free wall rupture following AMI
- Severe pulmonary arterial hypertension.
- Iatrogenic hemopericardium.
- Recurrent malignant effusion.
- Suspicion of purulent pericarditis.
- Bleeding diathesis.
- Considerations:
Vasoactive medications
The following table provides a summary of the hemodynamic effects of commonly used vasoactive agents. The preferred agent to use in each specific condition is mentioned above, however, the selection of pressors should be individualized based on patient physiology.
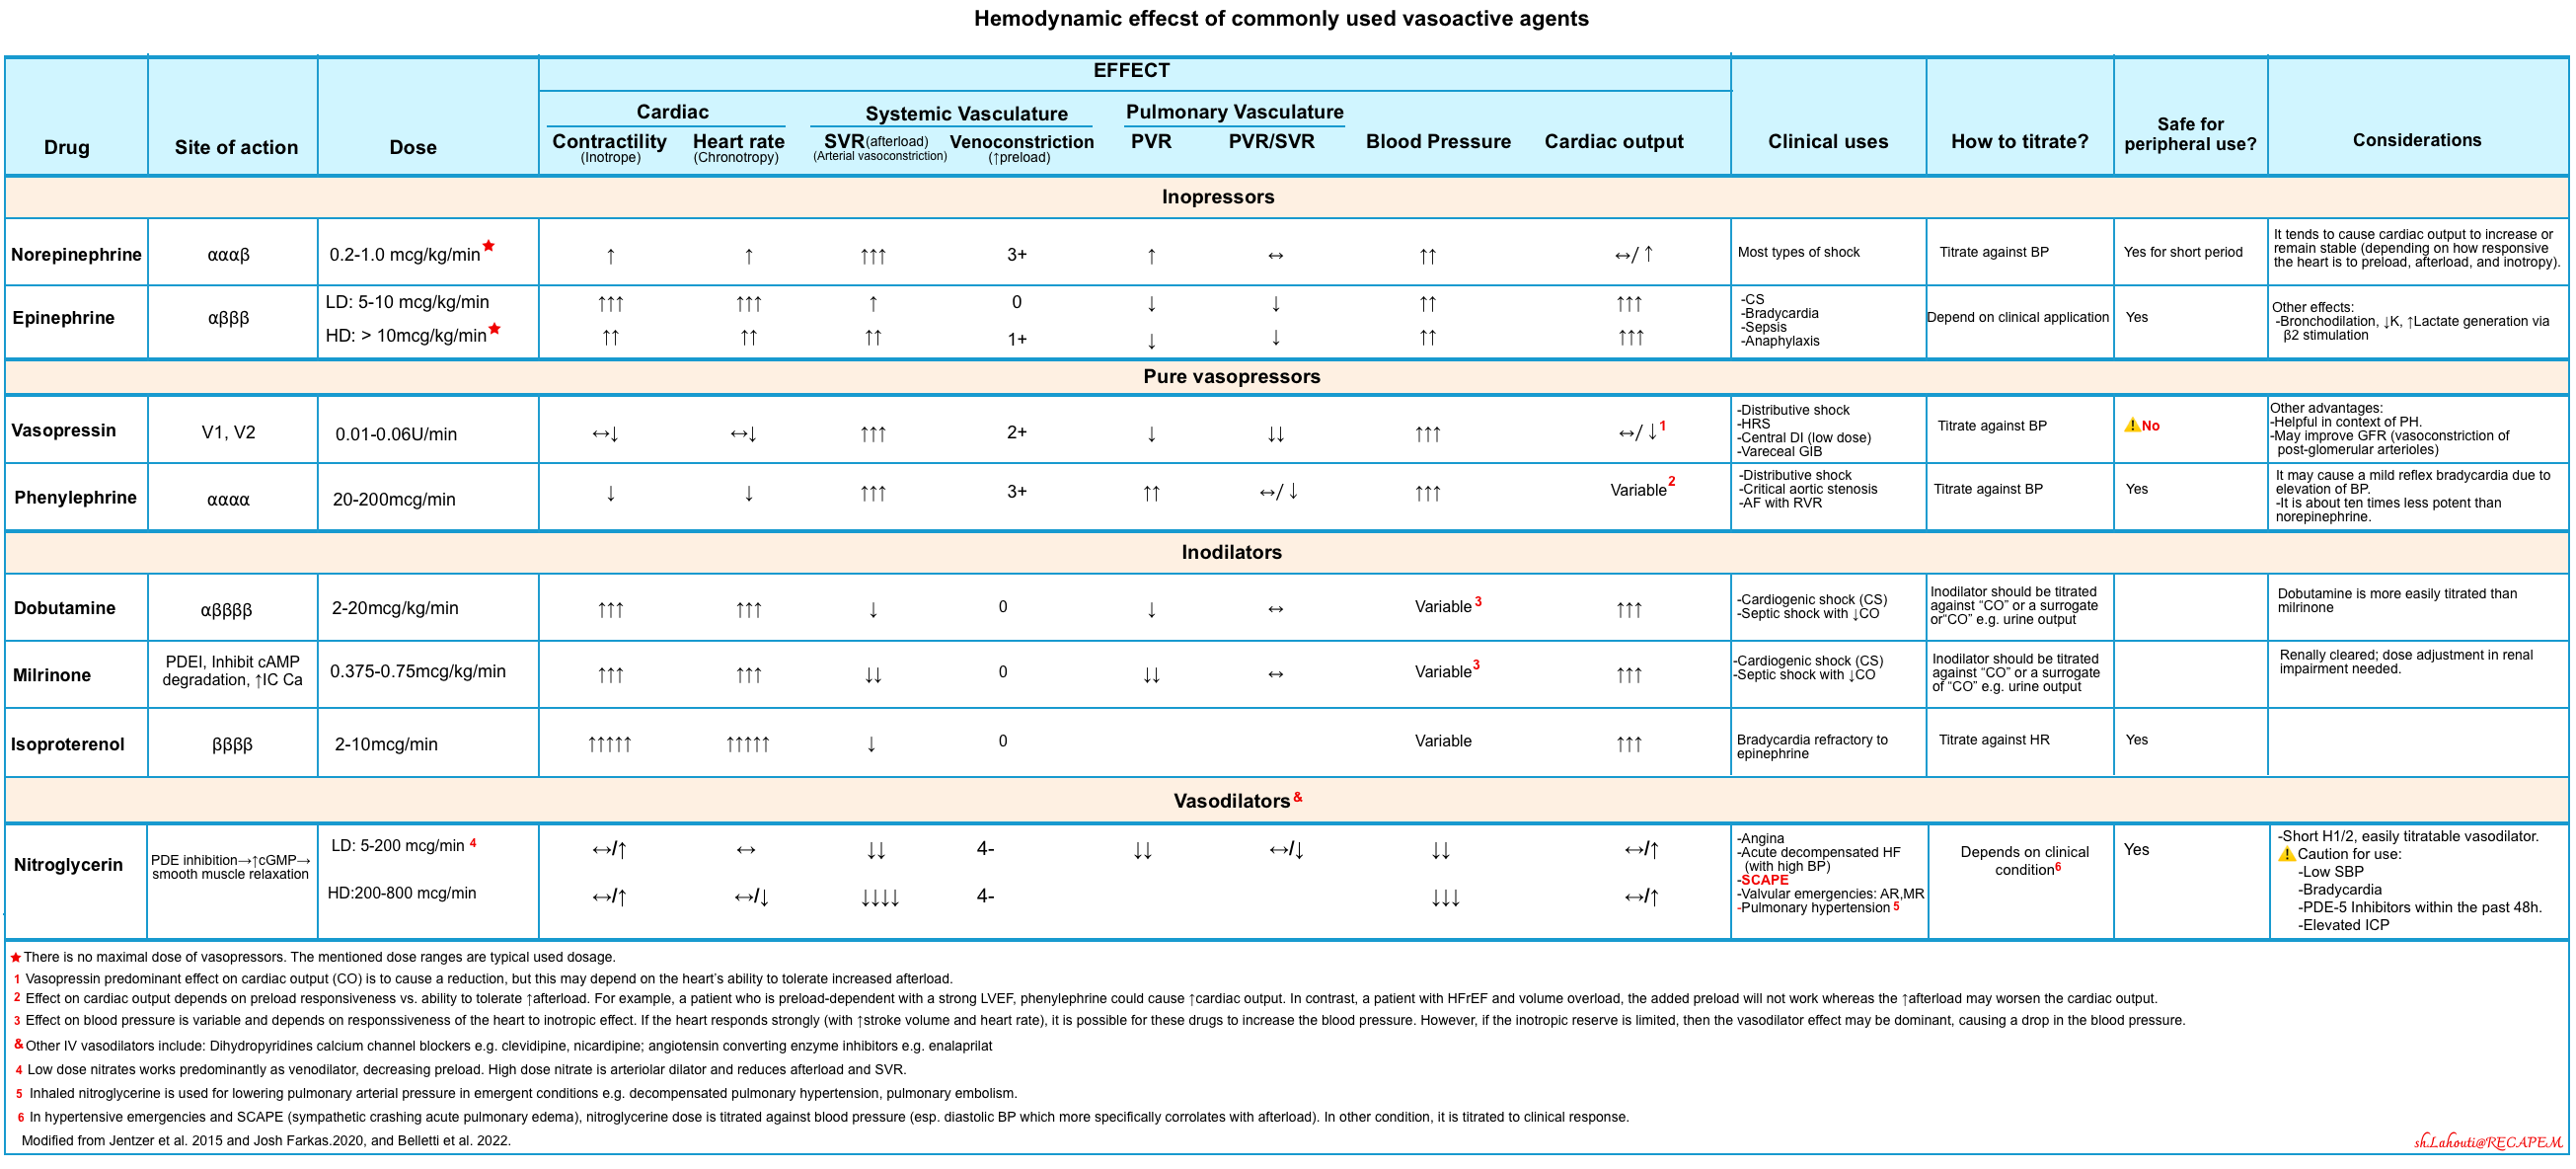
Specific conditions
Principles of hemodynamic resuscitation in isolated RV failure.
- Employ a fluid conservative strategy.
- Perform echo to evaluate the volume status. In questionable situations err on the side of keeping your patient dry.
- Fluid: Generally avoid IV fluid in isolated acute RV failure unless a patient has frank volume loss e.g. overt GI bleeding, or in the setting of RVMI *.
- Diuretic: is beneficial in the presence of clinical volume overload (e.g. pedal edema, pleural effusion) and when the cause of RV failure is left-sided heart failure (biventricular failure).
- Patients with systemic congestion and low MAP may require a combination of simultaneous vasoconstrictors (to maintain an adequate MAP and perfusion pressure, which is equal to MAP-RAP) along with diuresis (to promote decongestion and optimization of right ventricular preload).
- Protect RV coronary perfusion pressure.
- Vasopressor (if hypotensive). RV-friendly agents: Vasopressin, epinephrine *, and norepinephrine.
- The agent of choice would be the one with optimal systemic vasopressor activity while having the least pulmonary vasoconstriction effect (↓PVR/SVR).
- Target MAP. Patients with markedly ↑RAP may benefit from a higher MAP target.
- Inotrope: Once MAP is optimized, the patient should be reassessed for their perfusion. In cases of continued poor perfusion, or if the primary problem is ↓contractility (e.g. RVMI); start an inotrope (e.g. dobutamine, epinephrine).
- Reduce pulmonary vascular resistance (RV afterload).
- Start inhaled pulmonary vasodilators such as epoprostenol, and nitroglycerin.
- ⚠️Note that in the presence of severe LV failure, inhaled pulmonary vasodilators are contraindicated. Since they increase blood flow through the RV, they may increase LV preload. This could precipitate cardiogenic pulmonary edema among patients with left ventricular dysfunction.
- Optimize the lung: Correct hypoxia, hypercarbia, and acidosis (as these have vasoconstriction effects on the pulmonary artery).
- Try a non-invasive oxygenation, e.g. a high-flow nasal cannula.
- Drain moderate-large pleural effusion (in hypoxic patients with respiratory distress.
- Start inhaled pulmonary vasodilators such as epoprostenol, and nitroglycerin.
- Vasopressor (if hypotensive). RV-friendly agents: Vasopressin, epinephrine *, and norepinephrine.
- Correct hemodynamically significant brady/tachyarrhythmias.
- Patients with RV failure are poorly tolerant to dysrhythmias, especially AF with rapid ventricular response.
- All antiarrhythmic medications have a propensity to lower the BP and are not tolerated in the context of RV failure.
- Rate control with calcium channel blockers or β-blockers is not advised, as these medications further impair RV function.
- Digoxin may be useful for rate control.
- Patients with RV failure are poorly tolerant to dysrhythmias, especially AF with rapid ventricular response.
- Avoid intubation, if possible.
- Patients with acute right heart failure are susceptible to hypoxia and systemic hypotension *.
- If intubation is required, minimize the apeniec period and proceed with hemodynamically neutral intubation (cardiostable intubation).
- Mechanical ventilator setting.
- Minimize adverse effects of MV on RV performance: use a low tidal volume (<6ml/kg lean body weight), lowest PEEP, and keep Pplat <30 mm Hg *.
💡Refractory hypoxemia. In massive PE, hypoxemia often responds to conventional oxygen supplementation. Refractory hypoxemia should make you consider the following conditions. Perform echo to sort it out.
- Right-to-left shunting of blood through a patent foramen ovale (PFO) or atrial septal defect *.
- Another coexistent pulmonary process (e.g. pneumonia, atelectasis, pulmonary edema, pneumothorax).
Principles of hemodynamic resuscitation in tamponade
- Volume management
- Employ a fluid conservative strategy (unless there is clinically overt volume loss).
- The old teaching that tamponade is a preload-dependent condition; requiring volume loading is overly simplistic. Ventricular interdependence plays a much more critical role in determining LV cardiac output than does RV preload *. Several studies show that fluid is not always beneficial in tamponade *.
- Judicious IV fluid should be given to volume-depleted patients who are particularly susceptible to tamponade (low-pressure tamponade).
- Avoid diuretics except in certain conditions such as hemodynamically stable patients with PH and tamponade.
- Employ a fluid conservative strategy (unless there is clinically overt volume loss).
- Avoid inotropic medications as possible; since endogenous inotropic stimulation is often maximal in such patients.
- Avoid vasodilators, e.g. nitrates, since they will compromise vasoconstrictor compensatory response.
- Avoid Intubation, if possible, since positive pressure ventilation can further impair cardiac filling.
- If intubation is required, minimize the apeniec period and proceed with hemodynamically neutral intubation (cardiostable intubation).
- Reduce intrapericardial pressure. It is essential to identify and rapidly reverse other contributing factors leading to elevated external pressure compressing cardiac chambers in diastole. Some adjunctive interventions may indirectly reduce pericardial pressure such as:
- Drainage of a large pleural effusion.
- Reduction of intra-abdominal pressure (e.g. therapeutic paracentesis for ascites).
- Avoiding excessively high PEEP (among intubated patients).
🔴Tamponade in pulmonary hypertension
- The development of pericardial effusion in PAH is a compensatory response. Pericardial effusion restrains distension of the high-pressured RV in PH. Therefore IVS and IAS bowing to the left is minimal, thus left-sided filling pressure and cardiac output would be preserved to some degree.
- Management strategy
- By and large, drainage of hemodynamically stable pericardial effusion in PAH is not warranted and is dangerous.
- If the patient hemodynamically is stable; a gentle trial of diuretic may be tried.
- In unstable patients, measures of ↓RV afterload to optimize RV pressure-volume curve should be attempted first.
- If indicated as a last resort, removing a minimal amount of fluid is enough. Gradual drainage is advised.
Principles of hemodynamic resuscitation in biventricular or LV failure
- Optimize the lung.
- BiPAP: If the patient is not in true cardiogenic shock and multiorgan failure (e.g. delirium, renal failure).
- Intubation and positive pressure ventilation: In frank cardiogenic shock (esp. patients with delirium due to brain hypoperfusion).
- Resuscitate before intubation (hemodynamically neutral intubation)
- Drain hemodynamically significant pleural effusion (in patients with respiratory distress and hypoxemia).
- Optimize the MAP.
- Afterload reduction (e.g. nitroglycerin), if BP is high-normal.
- Inopressors (e.g. norepinephrine, epinephrine), if BP is low.
- Optimize volume status.
- A fluid challenge: Is indicated if the following conditions are met:
- No B-lines on lung US. Overall echocardiographic assessment suggests hypovolemia.
- No clinically significant systemic congestion (e.g. pedal edema).
- There is insufficient end-organ perfusion (e.g. acute kidney injury).
- Diuresis should be considered when the following conditions are met:
- Presence of significant pulmonary and/or systemic congestion.
- Overall echocardiographic and clinical assessment suggest total body fluid overload.
- A fluid challenge: Is indicated if the following conditions are met:
- Consider inotropes.
- If the clinical condition is not improving despite the above measures, inotropes should be considered for *:
- Hypoperfusion with low-normal BP.
- Refractory cardiogenic pulmonary edema.
- Agent of choice
- Dobutamine: Preferred agent. Shorter half-life, more easily titratable.
- Milrinone: longer half-life, renally cleared. Rapid titration is not possible.
- Note that both agents may cause hypotension, so they shouldn’t be used in profoundly hypotensive patients. Therefore, it’s generally preferable to start with blood pressure control.
- Digoxin: This can be considered for patients with long-standing AF and HFrEF.
- If the clinical condition is not improving despite the above measures, inotropes should be considered for *:
- Correct brady/tachydysrhythmias, if instability is caused by them.
Principles of hemodynamic resuscitation in valvular emergencies
- Patients with critical valvular disease usually fail to respond to medical therapy alone *.
- The goal of medical therapy and mechanical circulatory support (MCS) is stabilization before the definitive correction of the lesion.
- Generally, patients with regurgitant lesions require aggressive afterload reduction and inotropic support *, while those with stenotic lesions may paradoxically require β-blockade and vasoconstrictors (table below) *.

Principles of hemodynamic resuscitation in acute aortic dissection
- Control HR and BP
- Target HR < 60 bpm and SBP between 100-120 mm Hg.
- β-blockade: Esmolol or labetalol, targeted to HR.
- Vasodilator: If SBP remains above the target after starting the β-blocker, consider adding vasodilators (e.g. clevidipine, nicardipine, or nitroglycerin).
- Target HR < 60 bpm and SBP between 100-120 mm Hg.
- ⚠️Caution
- In the presence of AR, be cautious when starting β-blocker, because it may blunt the compensatory tachycardia, leading to cardiovascular collapse *.
- Targeting a higher HR (e.g. 80 bpm) might be more appropriate.
- Avoid other direct vasodilators like hydralazine as they increase aortic wall shear stress and provide less accurate and reversible control of the BP.
- In the presence of AR, be cautious when starting β-blocker, because it may blunt the compensatory tachycardia, leading to cardiovascular collapse *.
💡Diagnostic consideration: Patients with aortic dissection are often normo-hypertensive *. In hypotensive patients consider:
- AR, tamponade, hemothorax, hemoperitoneum, acute coronary syndrome * (esp. in type A dissection).
- Rupture (esp. in type B dissection).
Optimization phase
Principles
- Take advantage of echocardiographic skills to assess the response to the treatment (figure below). Reassess fluid status and global systolic and diastolic LV and RV function after initiation of “salvage” phase treatments (video below).
- If a patient is not responding well, reassess for the possible causes e.g. equipment failure or a missed underlying cause(s).
- Note that shock is often multifactorial in practice. Look for second causes of shock such as systolic HF, tamponade in dialysis patients, pulmonary embolism, occult bleeding, pneumothorax (esp. pos-resuscitation), a missed source of infection (such as undiagnosed viscus perforation).
- If a patient is not responding well, reassess for the possible causes e.g. equipment failure or a missed underlying cause(s).
- The summary of echo indices in hemodynamic monitoring and associated meaningful changes from the baseline is provided above.
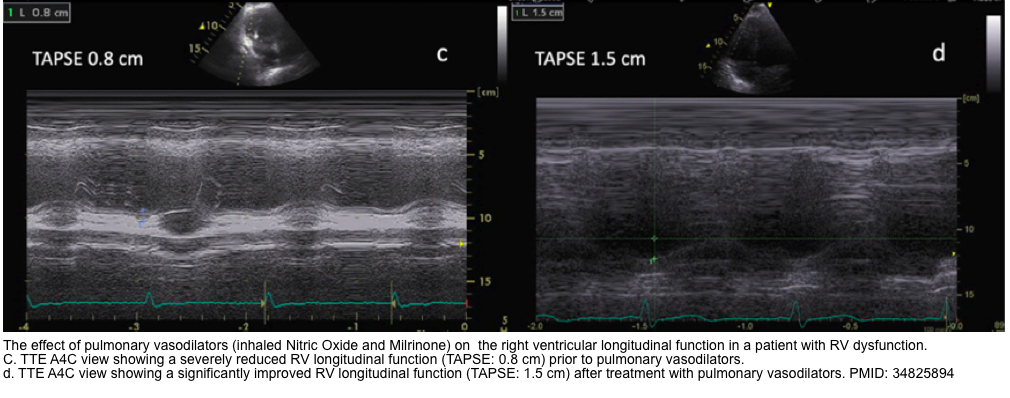
The video on the left of the screen shows hyperdynamic LV in a patient with septic shock. The patient initially was treated with IV fluids and norepinephrine infusion. Video on the right of the screen (in the same patient) was performed to monitor the response to treatment, showing reduced LVEF. The patient had pre-existing systolic dysfunction, which was masked by sepsis-induced vasodilation (↓afterload). Following initial treatment, the occult systolic HF is unmasked after establishing vascular tone.
🔴Some patients require a second vasoactive medication.
- The traditional belief that favors a specific sequence of vasoactive for all patients is not supported by evidence.
- 🧐How to select the second pressor or how to titrate/down-titrate pressors in patients who are on a multi-pressor regimen?
- Generally, consider agents with a different mechanism of action as second-line agents *.
- The goal should always be to use the minimal dose of vasoactive(s) agents necessary to achieve hemodynamic targets.
- Vasoactive agents do not work in a vacuum! The clinical response is an eventual interaction between vasoactive agents and the patient’s adrenergic responses. For example:
- Patients with advanced sepsis show a reduced cardiac sensitivity to β-agonists.
- It has been shown that in advanced HF, there is an upregulation of cardiac β2 receptors (the normal ratio of β1/β2 receptor is 70:30 in the left heart, but this ratio is changed to 60:40 in a failing LV). Moreover, in a failing LV, β2 receptor function is changed from Gs (stimulatory status leading to ↑cAMP) to Gi (inhibitory status leading to ↓cAMP).
- Therefore, for example, giving norepinephrine (which has a strong vasoconstrictive with some inotropic effects) to a patient with reduced cardiac responsiveness (advanced HFrEF) could cause a pure vasoconstriction without any inotropic effect.
- Ideally, it is best to avoid excessive vasoconstriction or excessive inotropy, while targeting resuscitative end-points.
- Aggressively up- and down-titrate vasopressors to get a sense of which agents are most effective.
- If a patient strongly responds to up/down titration of an agent, that drug is more likely to be causing benefit.
- If a patient has no/minimal response to adjusting the dose of an agent, that drug probably isn’t helping much (and should be weaned off).
- Or one may try an inopressor challenge test (epinephrine challenge test).
- Aggressively up- and down-titrate vasopressors to get a sense of which agents are most effective.
- 💡Having said that, the selection of the second vasoactive agent should be individualized, based on a dynamic response. Echocardiography helps us to monitor the response to treatments (video above).
De-escalation phase
The goal of the de-escalation (de-resuscitation) phase includes weaning from vasoactive agents, and achieving a negative fluid balance. Fluid overload is briefly reviewed here.
- In an ICU population, positive fluid balances have been associated with an increased risk of intra-abdominal hypertension, which in turn is strongly associated with the development of other organ dysfunction, particularly the development of AKI *,*. Fluid overload has deleterious consequences on different organs.
- Diagnosis
- Clinical manifestation: pedal edema, pleural/pericardial effusion, pulmonary edema, ascites, bowel wall edema, and congestive organ dysfunction listed above.
- Echocardiographic/ultrasonographic indices:
- ↑LAP:
- E/e’ > 15, E/A >2, Septal e’ < 8 cm/sec, lateral e’ <10 cm/sec, left atrial enlargement.
- ↑RAP:
- Fluid overload and acute pressure overload→RV enlargement and interventricular septal flattening in diastole (leading to a D-shaped LV).
- Note that chronic pressure overload causes flattening in both systole and diastole.
- Functional TR (due to RVE)
- RA enlargement and bowing inter-atrial septum to the left.
- ↓TAPSE
- Plethoric IVC, or a higher grade on VExUS score (VExUS Calculator).
- ⚠️Pitfalls: Neither IVC nor components of VExUS can differentiate between pressure overload (e.g. pulmonary hypertension) and volume overload. Therefore, these findings must be interpreted in the appropriate clinical context *.
- Conditions associated with ↑RAP, other than hypervolemia discussed above.
- Fluid overload and acute pressure overload→RV enlargement and interventricular septal flattening in diastole (leading to a D-shaped LV).
- B-Lines on Lung US.
- It can detect extravascular lung water before the onset of symptoms.
- The number of B-lines correlates with the degree of pulmonary edema and dynamically reduces with decongestive therapy.
- ⚠️Pitfall: B-lines are not specific to pulmonary edema, and can be seen in other conditions like pulmonary fibrosis.
- Pleural effusion.
- Ascites and bowel wall edema on the abdominal US.
- Optic nerve sheath diameter (OND) > 5.2-5.9 has a sensitivity of 90% and specificity of 85% for ↑ICP *.
- ↑LAP:
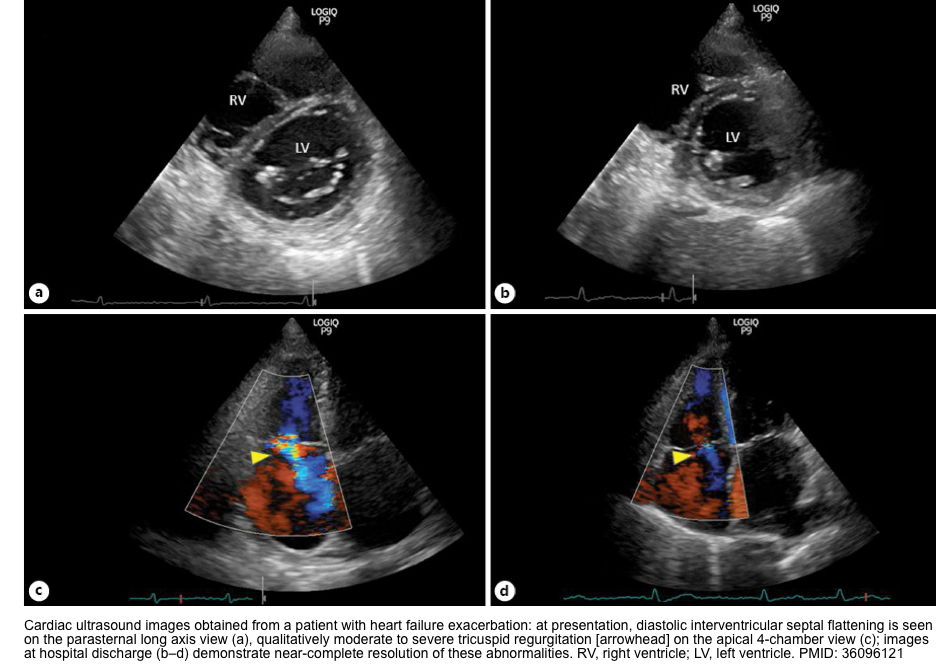
- Although several clinical, biochemical (e.g. BNP), and echocardiographic indices are available for the assessment of fluid overload, each suffers from
inherent limitations as explained in this post. It is important to know these limitations and to adopt a multidimensional approach to diagnose and manage fluid overload. - More on the management of hypervolemia,👉 here.
Appendix
Reference range of variable (measured by PAC)
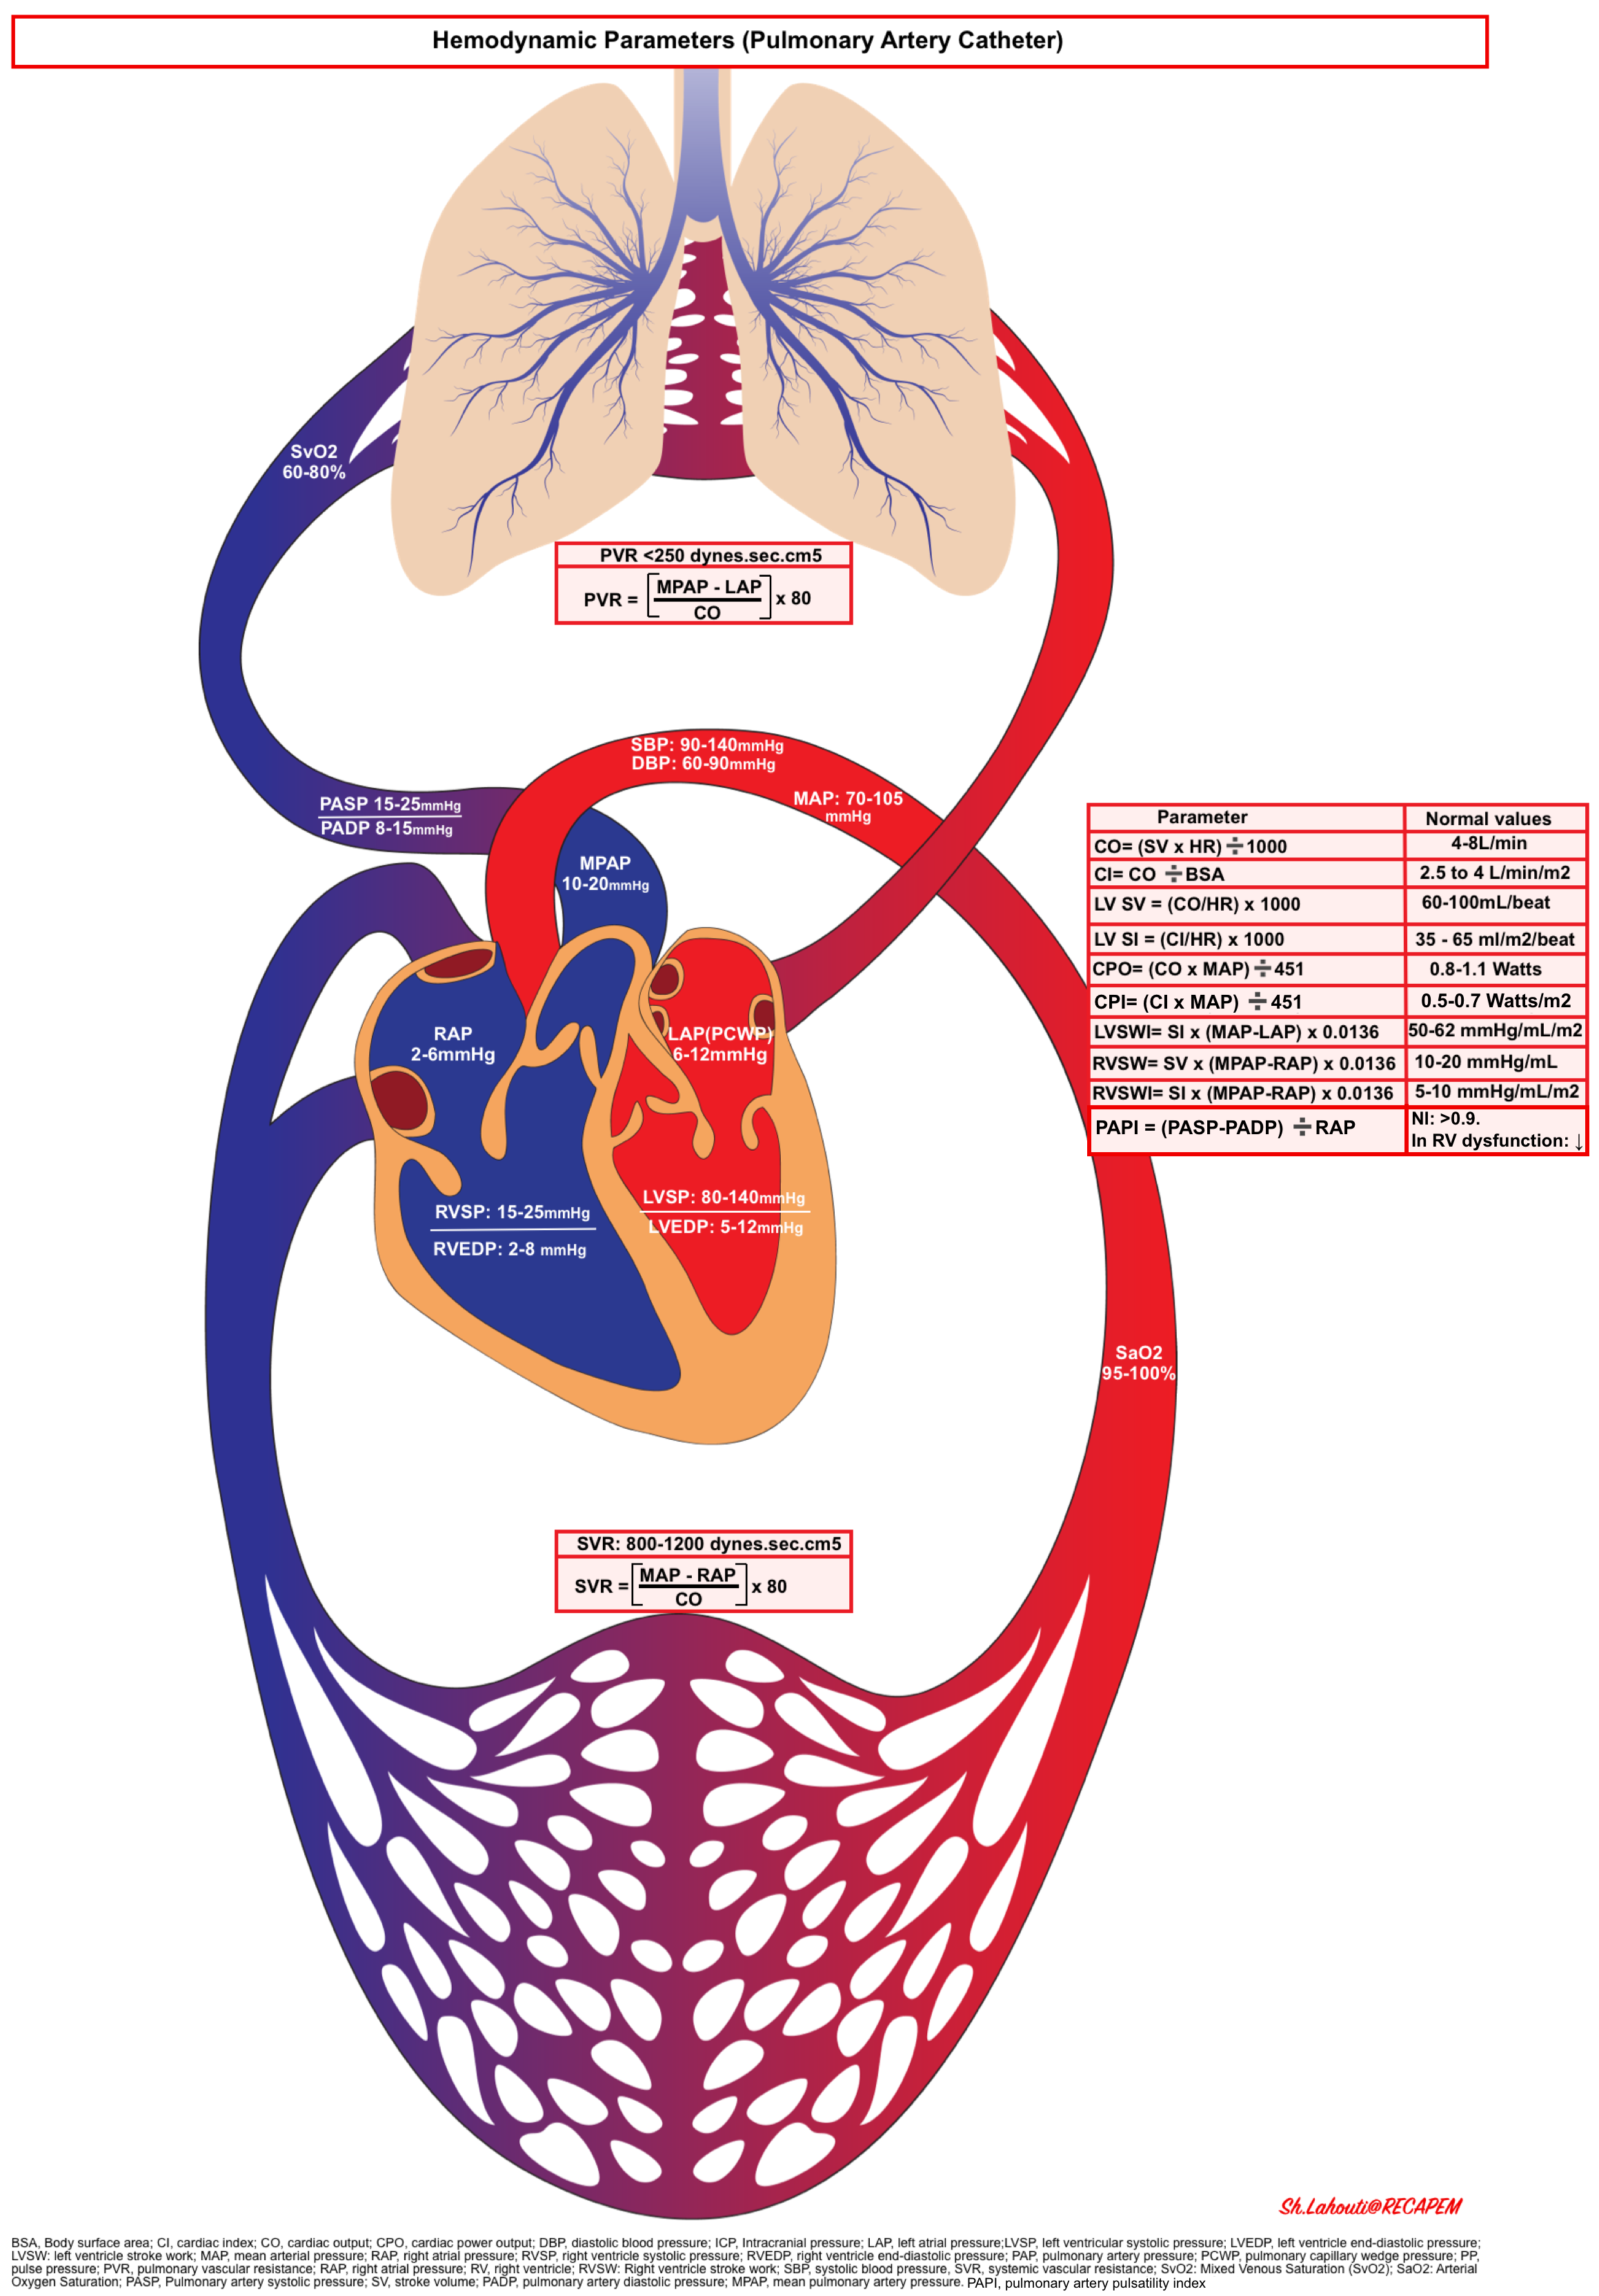
Diagnostic performance of clinical signs for estimating a cardiac index below 2.2 L∙min
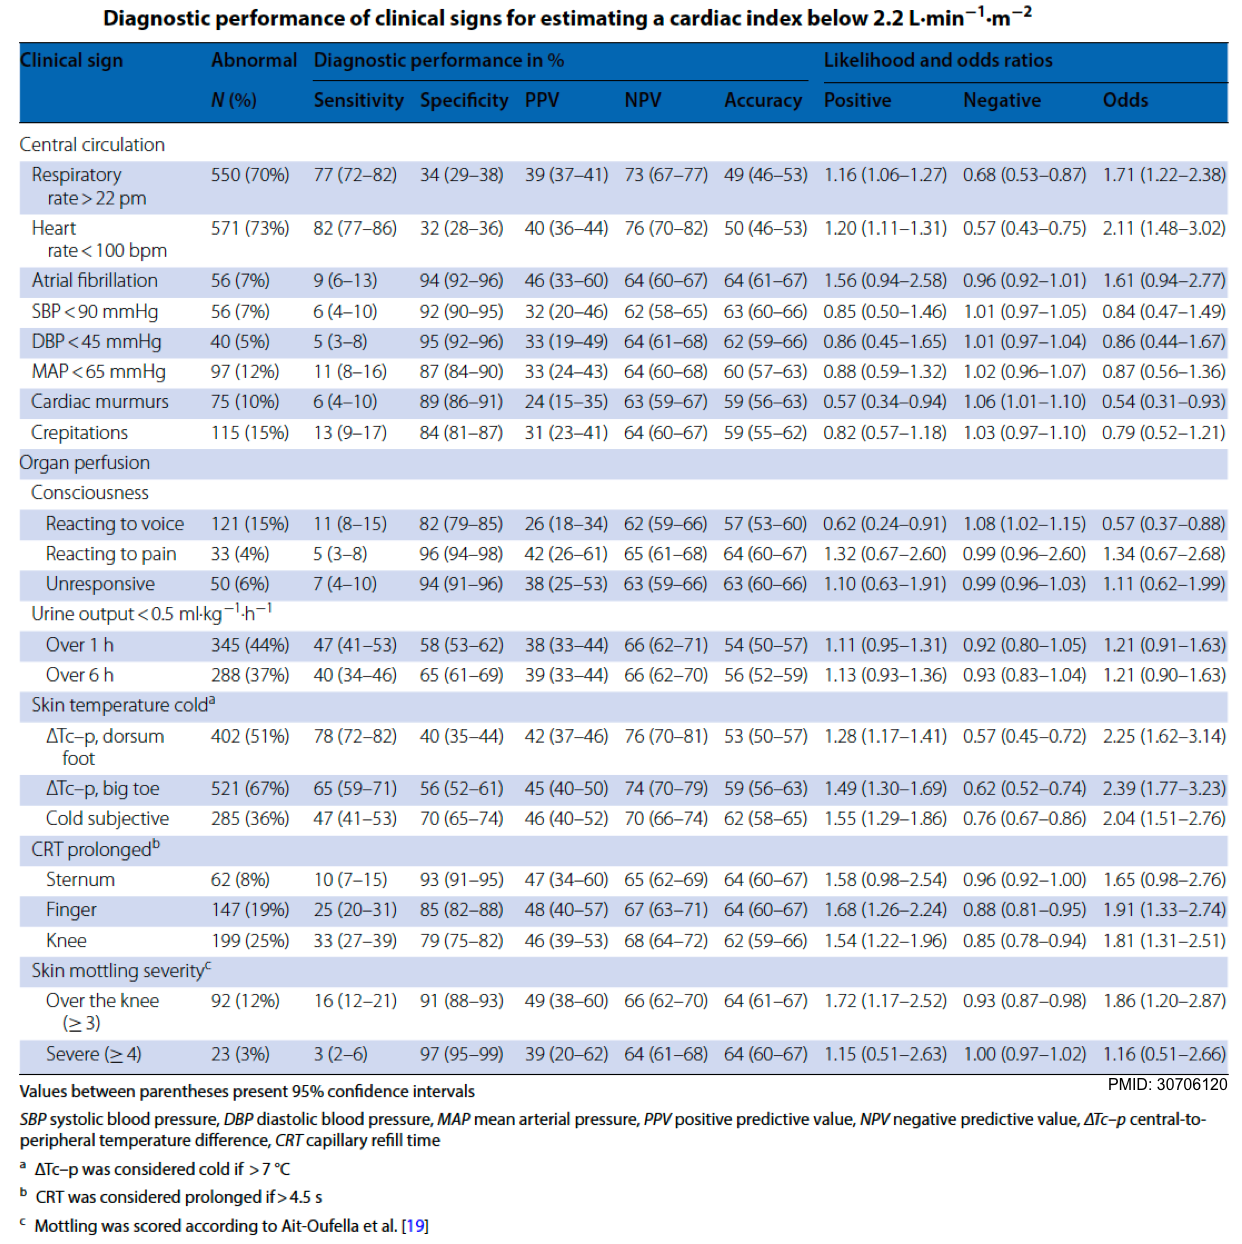
Going further
- Why we fail at hemodynamics: The flaw of averages & the swan’s curse(PulmCrit)
- Central venous oxygen saturation: signal or noise? (PulmCrit)
- Myth-busting the fluid bolus (PulmCrit)
Media
Fractional shortening (FS) for estimation of LV EF
Solid organ Doppler assessment for venous congestion
1.Guven G, Hilty MP, Ince C. Microcirculation: Physiology, Pathophysiology, and Clinical Application. Blood Purif. 2020;49(1-2):143-150. doi: 10.1159/000503775. Epub 2019 Dec 18. PMID: 31851980; PMCID: PMC7114900
2. osenkranz S, Howard LS, Gomberg-Maitland M, Hoeper MM. Systemic Consequences of Pulmonary Hypertension and Right-Sided Heart Failure. Circulation. 2020 Feb 25;141(8):678-693. doi: 10.1161/CIRCULATIONAHA.116.022362. Epub 2020 Feb 24. PMID: 32091921
3. Bellumkonda L, Gul B, Masri SC. Evolving Concepts in Diagnosis and Management of Cardiogenic Shock. Am J Cardiol. 2018 Sep 15;122(6):1104-1110. doi: 10.1016/j.amjcard.2018.05.040. Epub 2018 Jun 22. PMID: 30072134
4. Donati A, Domizi R, Damiani E, Adrario E, Pelaia P, Ince C. From macrohemodynamic to the microcirculation. Crit Care Res Pract. 2013;2013:892710. doi: 10.1155/2013/892710. Epub 2013 Feb 27. PMID: 23509621; PMCID: PMC3600213
5. Squara P, Hollenberg S, Payen D. Reconsidering Vasopressors for Cardiogenic Shock: Everything Should Be Made as Simple as Possible, but Not Simpler. Chest. 2019 Aug;156(2):392-401. doi: 10.1016/j.chest.2019.03.020. Epub 2019 Mar 29. PMID: 30935893
6. Levick JR, Michel CC. Microvascular fluid exchange and the revised Starling principle. Cardiovasc Res. 2010 Jul 15;87(2):198-210. doi: 10.1093/cvr/cvq062. Epub 2010 Mar 3. PMID: 20200043
7. Rosenkranz S, Howard LS, Gomberg-Maitland M, Hoeper MM. Systemic Consequences of Pulmonary Hypertension and Right-Sided Heart Failure. Circulation. 2020 Feb 25;141(8):678-693. doi: 10.1161/CIRCULATIONAHA.116.022362. Epub 2020 Feb 24. PMID: 32091921.
8. Miller A, Peck M, Clark T, Conway H, Olusanya S, Fletcher N, Coleman N, Parulekar P, Aron J, Kirk-Bayley J, Wilkinson JN, Wong A, Stephens J, Rubino A, Attwood B, Walden A, Breen A, Waraich M, Nix C, Hayward S. FUSIC HD. Comprehensive haemodynamic assessment with ultrasound. J Intensive Care Soc. 2022 Aug;23(3):325-333. doi: 10.1177/17511437211010032. Epub 2021 Apr 23. PMID: 36033241; PMCID: PMC9411780
9. Porter TR, Shillcutt SK, Adams MS, Desjardins G, Glas KE, Olson JJ, Troughton RW. Guidelines for the use of echocardiography as a monitor for therapeutic intervention in adults: a report from the American Society of Echocardiography. J Am Soc Echocardiogr. 2015 Jan;28(1):40-56. doi: 10.1016/j.echo.2014.09.009. PMID: 25559474
10. Bartlett RH. Alice in intensiveland. Being an essay on nonsense and common sense in the ICU, after the manner of Lewis Carroll. Chest. 1995 Oct;108(4):1129-39. doi: 10.1378/chest.108.4.1129. PMID: 7555127
11. Corradi F, Via G, Tavazzi G. What’s new in ultrasound-based assessment of organ perfusion in the critically ill: expanding the bedside clinical monitoring window for hypoperfusion in shock. Intensive Care Med. 2020 Apr;46(4):775-779. doi: 10.1007/s00134-019-05791-y. Epub 2019 Oct 25. PMID: 31654077
12. Soliman-Aboumarie H, Breithardt OA, Gargani L, Trambaiolo P, Neskovic AN. How-to: Focus Cardiac Ultrasound in acute settings. Eur Heart J Cardiovasc Imaging. 2022 Jan 24;23(2):150-153. doi: 10.1093/ehjci/jeab149. PMID: 34382077
13. Neskovic AN, Hagendorff A, Lancellotti P, Guarracino F, Varga A, Cosyns B, Flachskampf FA, Popescu BA, Gargani L, Zamorano JL, Badano LP; European Association of Cardiovascular Imaging. Emergency echocardiography: the European Association of Cardiovascular Imaging recommendations. Eur Heart J Cardiovasc Imaging. 2013 Jan;14(1):1-11. doi: 10.1093/ehjci/jes193. PMID: 23239795
14. Öhman J, Harjola VP, Karjalainen P, Lassus J. Focused echocardiography and lung ultrasound protocol for guiding treatment in acute heart failure. ESC Heart Fail. 2018 Feb;5(1):120-128. doi: 10.1002/ehf2.12208. Epub 2017 Sep 28. PMID: 28960894; PMCID: PMC5793966
15. Gargani L, Pang PS, Frassi F, Miglioranza MH, Dini FL, Landi P, Picano E. Persistent pulmonary congestion before discharge predicts rehospitalization in heart failure: a lung ultrasound study. Cardiovasc Ultrasound. 2015 Sep 4;13:40. doi: 10.1186/s12947-015-0033-4. PMID: 26337295; PMCID: PMC4558829
16. Lichtenstein DA. BLUE-protocol and FALLS-protocol: two applications of lung ultrasound in the critically ill. Chest. 2015 Jun;147(6):1659-1670. doi: 10.1378/chest.14-1313. PMID: 26033127
17. Bouhemad B, Mongodi S, Via G, Rouquette I. Ultrasound for “lung monitoring” of ventilated patients. Anesthesiology. 2015 Feb;122(2):437-47. doi: 10.1097/ALN.0000000000000558. PMID: 25501898
18. Cecconi M, De Backer D, Antonelli M, Beale R, Bakker J, Hofer C, Jaeschke R, Mebazaa A, Pinsky MR, Teboul JL, Vincent JL, Rhodes A. Consensus on circulatory shock and hemodynamic monitoring. Task force of the European Society of Intensive Care Medicine. Intensive Care Med. 2014 Dec;40(12):1795-815. doi: 10.1007/s00134-014-3525-z. Epub 2014 Nov 13. PMID: 25392034; PMCID: PMC4239778
19. Bronicki RA. Hemodynamic Monitoring. Pediatr Crit Care Med. 2016 Aug;17(8 Suppl 1):S207-14. doi: 10.1097/PCC.0000000000000779. PMID: 27490601
Wo CC, Shoemaker WC, Appel PL, Bishop MH, Kram HB, Hardin E. Unreliability of blood pressure and heart rate to evaluate cardiac output in emergency resuscitation and critical illness. Crit Care Med. 1993 Feb;21(2):218-23. doi: 10.1097/00003246-199302000-00012. PMID: 8428472
20. Rivers E, Nguyen B, Havstad S, Ressler J, Muzzin A, Knoblich B, Peterson E, Tomlanovich M; Early Goal-Directed Therapy Collaborative Group. Early goal-directed therapy in the treatment of severe sepsis and septic shock. N Engl J Med. 2001 Nov 8;345(19):1368-77. doi: 10.1056/NEJMoa010307. PMID: 11794169.
21. Sakr Y, Dubois MJ, De Backer D, Creteur J, Vincent JL. Persistent microcirculatory alterations are associated with organ failure and death in patients with septic shock. Crit Care Med. 2004 Sep;32(9):1825-31. doi: 10.1097/01.ccm.0000138558.16257.3f. PMID: 15343008
22. Lévy BI. Perfusion tissulaire et microcirculation : un rôle majeur dans l’hypertension artérielle [The importance of microcirculation and tissue perfusion in hypertension]. Curr Med Res Opin. 2005;21 Suppl 5:S1-6. French. doi: 10.1185/030079905X56411. PMID: 16197644
23. Ince C. Hemodynamic coherence and the rationale for monitoring the microcirculation. Crit Care. 2015;19 Suppl 3(Suppl 3):S8. doi: 10.1186/cc14726. Epub 2015 Dec 18. PMID: 26729241; PMCID: PMC4699073
24. Kara A, Akin S, Ince C. Monitoring microcirculation in critical illness. Curr Opin Crit Care. 2016 Oct;22(5):444-52. doi: 10.1097/MCC.0000000000000335. PMID: 27583585
25. Argulian E, Herzog E, Halpern DG, Messerli FH. Paradoxical hypertension with cardiac tamponade. Am J Cardiol. 2012 Oct 1;110(7):1066-9. doi: 10.1016/j.amjcard.2012.05.042. Epub 2012 Jun 19. PMID: 22721572
26. Cecconi M, De Backer D, Antonelli M, Beale R, Bakker J, Hofer C, Jaeschke R, Mebazaa A, Pinsky MR, Teboul JL, Vincent JL, Rhodes A. Consensus on circulatory shock and hemodynamic monitoring. Task force of the European Society of Intensive Care Medicine. Intensive Care Med. 2014 Dec;40(12):1795-815. doi: 10.1007/s00134-014-3525-z. Epub 2014 Nov 13. PMID: 25392034; PMCID: PMC4239778
27. Squara P, Hollenberg S, Payen D. Reconsidering Vasopressors for Cardiogenic Shock: Everything Should Be Made as Simple as Possible, but Not Simpler. Chest. 2019 Aug;156(2):392-401. doi: 10.1016/j.chest.2019.03.020. Epub 2019 Mar 29. PMID: 30935893
28. Cecconi M, Parsons AK, Rhodes A. What is a fluid challenge? Curr Opin Crit Care. 2011 Jun;17(3):290-5. doi: 10.1097/MCC.0b013e32834699cd. PMID: 21508838
29. Gidwani H, Gómez H. The crashing patient: hemodynamic collapse. Curr Opin Crit Care. 2017 Dec;23(6):533-540. doi: 10.1097/MCC.0000000000000451. PMID: 28984705; PMCID: PMC5668154
30. Corradi F, Brusasco C, Garlaschi A, Santori G, Vezzani A, Moscatelli P, Pelosi P. Splenic Doppler resistive index for early detection of occult hemorrhagic shock after polytrauma in adult patients. Shock. 2012 Nov;38(5):466-73. doi: 10.1097/SHK.0b013e31826d1eaf. PMID: 23042191.
31. Noitz M, Szasz J, Dünser MW. Regional perfusion monitoring in shock. Curr Opin Crit Care. 2020 Jun;26(3):281-288. doi: 10.1097/MCC.0000000000000716. PMID: 32348094
32. Hasanin A, Mukhtar A, Nassar H. Perfusion indices revisited. J Intensive Care. 2017 Mar 14;5:24. doi: 10.1186/s40560-017-0220-5. PMID: 28331621; PMCID: PMC5351209.
33. Dilken O, Ergin B, Ince C. Assessment of sublingual microcirculation in critically ill patients: consensus and debate. Ann Transl Med. 2020 Jun;8(12):793. doi: 10.21037/atm.2020.03.222. PMID: 32647718; PMCID: PMC7333125
34. Van Diepen et al. 2017. Contemporary Management of Cardiogenic Shock: A Scientific Statement from the American Heart Association. In Circulation (Vol. 136, Issue 16, pp. e232–e268). Lippincott Williams and Wilkins. https://doi.org/10.1161/CIR.0000000000000525
35.Ait-Oufella H, Lemoinne S, Boelle PY, Galbois A, Baudel JL, Lemant J, Joffre J, Margetis D, Guidet B, Maury E, Offenstadt G. Mottling score predicts survival in septic shock. Intensive Care Med. 2011 May;37(5):801-7. doi: 10.1007/s00134-011-2163-y. Epub 2011 Mar 4. PMID: 21373821
36. Galbois A, Bigé N, Pichereau C, Boëlle PY, Baudel JL, Bourcier S, Maury E, Guidet B, Ait-Oufella H. Exploration of skin perfusion in cirrhotic patients with septic shock. J Hepatol. 2015 Mar;62(3):549-55. doi: 10.1016/j.jhep.2014.10.012. Epub 2014 Oct 19. PMID: 25457199
37. Dumas G, Lavillegrand JR, Joffre J, Bigé N, de-Moura EB, Baudel JL, Chevret S, Guidet B, Maury E, Amorim F, Ait-Oufella H. Mottling score is a strong predictor of 14-day mortality in septic patients whatever vasopressor doses and other tissue perfusion parameters. Crit Care. 2019 Jun 10;23(1):211. doi: 10.1186/s13054-019-2496-4. PMID: 31182133; PMCID: PMC6558704
38. Hiemstra B, Eck RJ, Wiersema R, Kaufmann T, Koster G, Scheeren TWL, Snieder H, Perner A, Pettilä V, Wetterslev J, Keus F, van der Horst ICC; SICS Study Group. Clinical Examination for the Prediction of Mortality in the Critically Ill: The Simple Intensive Care Studies-I. Crit Care Med. 2019 Oct;47(10):1301-1309. doi: 10.1097/CCM.0000000000003897. PMID: 31356472; PMCID: PMC6750157
39.Hernánd et al. 2019. Effect of a Resuscitation Strategy Targeting Peripheral Perfusion Status vs Serum Lactate Levels on 28-Day Mortality among Patients with Septic Shock: The ANDROMEDA-SHOCK Randomized Clinical Trial. JAMA – Journal of the American Medical Association, 321(7), 654–664. https://doi.org/10.1001/jama.2019.0071
40. Hiemstra B, Koster G, Wiersema R, Hummel YM, van der Harst P, Snieder H, Eck RJ, Kaufmann T, Scheeren TWL, Perner A, Wetterslev J, de Smet AMGA, Keus F, van der Horst ICC; SICS Study Group. The diagnostic accuracy of clinical examination for estimating cardiac index in critically ill patients: the Simple Intensive Care Studies-I. Intensive Care Med. 2019 Feb;45(2):190-200. doi: 10.1007/s00134-019-05527-y. Epub 2019 Jan 31. PMID: 30706120.
41. Ait-Oufella H, Bige N, Boelle PY, Pichereau C, Alves M, Bertinchamp R, Baudel JL, Galbois A, Maury E, Guidet B. Capillary refill time exploration during septic shock. Intensive Care Med. 2014 Jul;40(7):958-64. doi: 10.1007/s00134-014-3326-4. Epub 2014 May 9. PMID: 24811942
42. Van Diepen S, Katz JN, Albert NM, Henry TD, Jacobs AK, Kapur NK, Kilic A, Menon V, Ohman EM, Sweitzer NK, Thiele H, Washam JB, Cohen MG; American Heart Association Council on Clinical Cardiology; Council on Cardiovascular and Stroke Nursing; Council on Quality of Care and Outcomes Research; and Mission: Lifeline. Contemporary Management of Cardiogenic Shock: A Scientific Statement From the American Heart Association. Circulation. 2017 Oct 17;136(16):e232-e268. doi: 10.1161/CIR.0000000000000525. Epub 2017 Sep 18. PMID: 28923988
43. Shirakabe A, Matsushita M, Shibata Y, Shighihara S, Nishigoori S, Sawatani T, Kiuchi K, Asai K. Organ dysfunction, injury, and failure in cardiogenic shock. J Intensive Care. 2023 Jun 29;11(1):26. doi: 10.1186/s40560-023-00676-1. PMID: 37386552; PMCID: PMC10308671
44. Dell’Italia LJ. The right ventricle: anatomy, physiology, and clinical importance. Curr Probl Cardiol. 1991 Oct;16(10):653-720. doi: 10.1016/0146-2806(91)90009-y. PMID: 1748012
45. Nguyen T, Do H, Pham T, Vu LT, Zuin M, Rigatelli G. Left ventricular dysfunction causing ischemia in patients with patent coronary arteries. Perfusion. 2018 Mar;33(2):115-122. doi: 10.1177/0267659117727826. Epub 2017 Aug 21. PMID: 28823216
46. Price LC, Wort SJ, Finney SJ, Marino PS, Brett SJ. Pulmonary vascular and right ventricular dysfunction in adult critical care: current and emerging options for management: a systematic literature review. Crit Care. 2010;14(5):R169. doi: 10.1186/cc9264. Epub 2010 Sep 21. PMID: 20858239; PMCID: PMC3219266
47. Ware LB, Matthay MA. Clinical practice. Acute pulmonary edema. N Engl J Med. 2005 Dec 29;353(26):2788-96. doi: 10.1056/NEJMcp052699. PMID: 16382065
48. Huppert LA, Matthay MA, Ware LB. Pathogenesis of Acute Respiratory Distress Syndrome. Semin Respir Crit Care Med. 2019 Feb;40(1):31-39. doi: 10.1055/s-0039-1683996. Epub 2019 May 6. PMID: 31060086; PMCID: PMC7060969
49. Alvarez AM, Mukherjee D. Liver abnormalities in cardiac diseases and heart failure. Int J Angiol. 2011 Sep;20(3):135-42. doi: 10.1055/s-0031-1284434. PMID: 22942628; PMCID: PMC3331650
50. Sundaram V, Fang JC. Gastrointestinal and Liver Issues in Heart Failure. Circulation. 2016 Apr 26;133(17):1696-703. doi: 10.1161/CIRCULATIONAHA.115.020894. PMID: 27143152.
51. Cassidy WM, Reynolds TB. Serum lactic dehydrogenase in the differential diagnosis of acute hepatocellular injury. J Clin Gastroenterol. 1994 Sep;19(2):118-21. doi: 10.1097/00004836-199409000-00008. PMID: 7963356
52. Kohsaka S, Menon V, Lowe AM, Lange M, Dzavik V, Sleeper LA, Hochman JS; SHOCK Investigators. Systemic inflammatory response syndrome after acute myocardial infarction complicated by cardiogenic shock. Arch Intern Med. 2005 Jul 25;165(14):1643-50. doi: 10.1001/archinte.165.14.1643. PMID: 16043684.
53. Ostermann M, Hall A, Crichton S. Low mean perfusion pressure is a risk factor for progression of acute kidney injury in critically ill patients – A retrospective analysis. BMC Nephrol. 2017 May 3;18(1):151. doi: 10.1186/s12882-017-0568-8. PMID: 28468613; PMCID: PMC5415805
54. Sun J, Yuan J, Li B. SBP Is Superior to MAP to Reflect Tissue Perfusion and Hemodynamic Abnormality Perioperatively. Front Physiol. 2021 Sep 14;12:705558. doi: 10.3389/fphys.2021.705558. PMID: 34594235; PMCID: PMC8476970
55. Jozwiak M, Monnet X, Teboul JL. Less or more hemodynamic monitoring in critically ill patients. Curr Opin Crit Care. 2018 Aug;24(4):309-315. doi: 10.1097/MCC.0000000000000516. PMID: 29889132
56. Ospina-Tascón GA, Teboul JL, Hernandez G, Alvarez I, Sánchez-Ortiz AI, Calderón-Tapia LE, Manzano-Nunez R, Quiñones E, Madriñan-Navia HJ, Ruiz JE, Aldana JL, Bakker J. Diastolic shock index and clinical outcomes in patients with septic shock. Ann Intensive Care. 2020 Apr 16;10(1):41. doi: 10.1186/s13613-020-00658-8. PMID: 32296976; PMCID: PMC7160223
57. Legrand M, Zarbock A. Ten tips to optimize vasopressors use in the critically ill patient with hypotension. Intensive Care Med. 2022 Jun;48(6):736-739. doi: 10.1007/s00134-022-06708-y. Epub 2022 May 3. PMID: 35504977
58. Kaufmann T, van der Horst ICC, Scheeren TWL. This is your toolkit in hemodynamic monitoring. Curr Opin Crit Care. 2020 Jun;26(3):303-312. doi: 10.1097/MCC.0000000000000727. PMID: 32332285
59. Kapoor T, Locurto M, Farina GA, Silverman R. Hypotension is uncommon in patients presenting to the emergency department with non-traumatic cardiac tamponade. J Emerg Med. 2012 Feb;42(2):220-6. doi: 10.1016/j.jemermed.2010.05.071. Epub 2010 Aug 30. PMID: 20800410
60. Rajkumar KP, Hicks MH, Marchant B, Khanna AK. Blood Pressure Goals in Critically Ill Patients. Methodist Debakey Cardiovasc J. 2023 Aug 1;19(4):24-37. doi: 10.14797/mdcvj.1260. PMID: 37547901; PMCID: PMC10402811
61. Asfar, P., Meziani, F., Hamel, J.-F., Grelon, F., Megarbane, B., Anguel, N., Mira, J.-P., Dequin, P.-F., Gergaud, S., Weiss, N., Legay, F., le Tulzo, Y., Conrad, M., Robert, R., Gonzalez, F., Guitton, C., Tamion, F., Tonnelier, J.-M., Guezennec, Radermacher, P. (2014). High versus Low Blood-Pressure Target in Patients with Septic Shock. New England Journal of Medicine, 370(17), 1583–1593. https://doi.org/10.1056/nejmoa1312173
62. Mullin CJ, Ventetuolo CE. Critical Care Management of the Patient with Pulmonary Hypertension. Clin Chest Med. 2021 Mar;42(1):155-165. doi: 10.1016/j.ccm.2020.11.009. PMID: 33541609
63. Beesley SJ, Wilson EL, Lanspa MJ, Grissom CK, Shahul S, Talmor D, Brown SM. Relative Bradycardia in Patients With Septic Shock Requiring Vasopressor Therapy. Crit Care Med. 2017 Feb;45(2):225-233. doi: 10.1097/CCM.0000000000002065. PMID: 27618277; PMCID: PMC5512273
64. Jentzer JC, Ternus B, Eleid M, Rihal C. Structural Heart Disease Emergencies. J Intensive Care Med. 2021 Sep;36(9):975-988. doi: 10.1177/0885066620918776. Epub 2020 Apr 21. PMID: 32314662
65. Spaccarotella C, Mongiardo A, Indolfi C. Pathophysiology of aortic stenosis and approach to treatment with percutaneous valve implantation. Circ J. 2011;75(1):11-19. doi: 10.1253/circj.cj-10-1105. PMID: 21178291.
66. De Siet al. 2015. Cardiovascular risk in relation to a newclassification of hypertensive left ventricular geometric abnormalities. Journal of Hypertension, 33(4), 745–754. https://doi.org/10.1097/HJH.0000000000000477.
67. Lang, R. M. et al. 2015. Recommendations for cardiac chamber quantification by echocardiography in adults: An update from the American Society of Echocardiography and the European Association of Cardiovascular Imaging. Journal of the American Society of Echocardiography, 28(1), 1-39.e14. https://doi.org/10.1016/j.echo.2014.10.003
68. Dini FL, Capozza P, Donati F, Simioniuc A, Corciu AI, Fontanive P, Pieroni A, Di Bello V, Marzilli M. Patterns of left ventricular remodeling in chronic heart failure: prevalence and prognostic implications. Am Heart J. 2011 Jun;161(6):1088-95. doi: 10.1016/j.ahj.2011.03.027. Epub 2011 May 11. PMID: 21641355.
69. Chengode S. Left ventricular global systolic function assessment by echocardiography. Ann Card Anaesth. 2016 Oct;19(Supplement):S26-S34. doi: 10.4103/0971-9784.192617. PMID: 27762246; PMCID: PMC5100240
70. Pinsky MR, Payen D. Functional hemodynamic monitoring. Crit Care. 2005;9(6):566-72. doi: 10.1186/cc3927. Epub 2005 Nov 22. PMID: 16356240; PMCID: PMC1414021
71. Mercado P, et al.. Crit Care. 2017 Jun 9;21(1):136. doi: 10.1186/s13054-017-1737-7. PMID: 28595621; PMCID: PMC5465531
72. Tseng J, Nugent K. Utility of the shock index in patients with sepsis. Am J Med Sci. 2015 Jun;349(6):531-5. doi: 10.1097/MAJ.0000000000000444. PMID: 25782337
75. Jozwiak M, Monnet X, Teboul JL. Less or more hemodynamic monitoring in critically ill patients. Curr Opin Crit Care. 2018 Aug;24(4):309-315. doi: 10.1097/MCC.0000000000000516. PMID: 29889132
76. Bronicki RA. Hemodynamic Monitoring. Pediatr Crit Care Med. 2016 Aug;17(8 Suppl 1):S207-14. doi: 10.1097/PCC.0000000000000779. PMID: 27490601
77. Aurigemma GP, Zile MR, Gaasch WH. Contractile behavior of the left ventricle in diastolic heart failure: with emphasis on regional systolic function. Circulation. 2006 Jan 17;113(2):296-304. doi: 10.1161/CIRCULATIONAHA.104.481465. PMID: 16418449
78. Silverstein JR, Laffely NH, Rifkin RD. Quantitative estimation of left ventricular ejection fraction from mitral valve E-point to septal separation and comparison to magnetic resonance imaging. Am J Cardiol. 2006 Jan 1;97(1):137-40. doi: 10.1016/j.amjcard.2005.07.118. Epub 2005 Nov 15. PMID: 16377299
79. Kennedy Hall M, Coffey EC, Herbst M, Liu R, Pare JR, Andrew Taylor R, Thomas S, Moore CL. The “5Es” of emergency physician-performed focused cardiac ultrasound: a protocol for rapid identification of effusion, ejection, equality, exit, and entrance. Acad Emerg Med. 2015 May;22(5):583-93. doi: 10.1111/acem.12652. Epub 2015 Apr 22. PMID: 25903585.
80. Chengode, S. (2016). Left ventricular global systolic function assessment by echocardiography. In Annals of Cardiac Anaesthesia (Vol. 19, Issue 5, pp. S26–S34). Medknow Publications. https://doi.org/10.4103/0971-9784.192617.
81. Ospina-Tascón GA, Teboul JL, Hernandez G, Alvarez I, Sánchez-Ortiz AI, Calderón-Tapia LE, Manzano-Nunez R, Quiñones E, Madriñan-Navia HJ, Ruiz JE, Aldana JL, Bakker J. Diastolic shock index and clinical outcomes in patients with septic shock. Ann Intensive Care. 2020 Apr 16;10(1):41. doi: 10.1186/s13613-020-00658-8. PMID: 32296976; PMCID: PMC7160223
82. Porter TR, Shillcutt SK, Adams MS, Desjardins G, Glas KE, Olson JJ, Troughton RW. Guidelines for the use of echocardiography as a monitor for therapeutic intervention in adults: a report from the American Society of Echocardiography. J Am Soc Echocardiogr. 2015 Jan;28(1):40-56. doi: 10.1016/j.echo.2014.09.009. PMID: 25559474.
83. Soliman-Aboumarie H, Pastore MC, Galiatsou E, Gargani L, Pugliese NR, Mandoli GE, Valente S, Hurtado-Doce A, Lees N, Cameli M. Echocardiography in the intensive care unit: An essential tool for diagnosis, monitoring and guiding clinical decision-making. Physiol Int. 2021 Nov 25. doi: 10.1556/1647.2021.00055. Epub ahead of print. PMID: 34825894
84. Nagueh SF. Left Ventricular Diastolic Function: Understanding Pathophysiology, Diagnosis, and Prognosis With Echocardiography. JACC Cardiovasc Imaging. 2020 Jan;13(1 Pt 2):228-244. doi: 10.1016/j.jcmg.2018.10.038. Epub 2019 Apr 12. PMID: 30982669
85. Bowcock EM, Mclean A. Bedside assessment of left atrial pressure in critical care: a multifaceted gem. Crit Care. 2022 Aug 13;26(1):247. doi: 10.1186/s13054-022-04115-9. PMID: 35964098; PMCID: PMC9375940
86. Reddy YNV, El-Sabbagh A, Nishimura RA. Comparing Pulmonary Arterial Wedge Pressure and Left Ventricular End Diastolic Pressure for Assessment of Left-Sided Filling Pressures. JAMA Cardiol. 2018 Jun 1;3(6):453-454. doi: 10.1001/jamacardio.2018.0318. PMID: 29590308
87. Sanfilippo F, Scolletta S, Morelli A, Vieillard-Baron A. Practical approach to diastolic dysfunction in light of the new guidelines and clinical applications in the operating room and in the intensive care. Ann Intensive Care. 2018 Oct 29;8(1):100. doi: 10.1186/s13613-018-0447-x. Erratum in: Ann Intensive Care. 2018 Nov 6;8(1):106. PMID: 30374644; PMCID: PMC6206316
88. Nagueh SF, Middleton KJ, Kopelen HA, Zoghbi WA, Quiñones MA. Doppler tissue imaging: a noninvasive technique for evaluation of left ventricular relaxation and estimation of filling pressures. J Am Coll Cardiol. 1997 Nov 15;30(6):1527-33. doi: 10.1016/s0735-1097(97)00344-6. PMID: 9362412
89. Nagueh SF. Left Ventricular Diastolic Function: Understanding Pathophysiology, Diagnosis, and Prognosis With Echocardiography. JACC Cardiovasc Imaging. 2020 Jan;13(1 Pt 2):228-244. doi: 10.1016/j.jcmg.2018.10.038. Epub 2019 Apr 12. PMID: 30982669
90. Lichtenstein D, Karakitsos D. Integrating lung ultrasound in the hemodynamic evaluation of acute circulatory failure (the fluid administration limited by lung sonography protocol). J Crit Care. 2012 Oct;27(5):533.e11-9. doi: 10.1016/j.jcrc.2012.03.004. Epub 2012 Apr 18. PMID: 22520492
91. Yousef, H.A., Hamdan, A.E.S., Elminshawy, A. et al. Corrected calculation of the overestimated ejection fraction in valvular heart disease by phase-contrast cardiac magnetic resonance imaging for better prediction of patient morbidity. Egypt J Radiol Nucl Med 51, 11 (2020). https://doi.org/10.1186/s43055-019-0130-8
92. Unger P, Pibarot P, Tribouilloy C, Lancellotti P, Maisano F, Iung B, Piérard L; European Society of Cardiology Council on Valvular Heart Disease. Multiple and Mixed Valvular Heart Diseases. Circ Cardiovasc Imaging. 2018 Aug;11(8):e007862. doi: 10.1161/CIRCIMAGING.118.007862. PMID: 30354497
93. Unger P, Clavel MA, Lindman BR, Mathieu P, Pibarot P. Pathophysiology and management of multivalvular disease. Nat Rev Cardiol. 2016 Jul;13(7):429-40. doi: 10.1038/nrcardio.2016.57. Epub 2016 Apr 28. PMID: 27121305; PMCID: PMC5129845.
94. Chionc et al. 2023. Acute heart failure and valvular heart disease: A scientific statement of the Heart Failure Association, the Association for Acute CardioVascular Care and the European Association of Percutaneous Cardiovascular Interventions of the European Society of Cardiology. European Journal of Heart Failure. https://doi.org/10.1002/ejhf.2918.
95. Vahanian A. et al. ESC/EACTS Scientific Document Group. 2021 ESC/EACTS Guidelines for the management of valvular heart disease. Eur Heart J. 2022 Feb 12;43(7):561-632. doi: 10.1093/eurheartj/ehab395. Erratum in: Eur Heart J. 2022 Feb 18;: PMID: 34453165
96. Dugar S, Sato R, Chawla S, You JY, Wang X, Grimm R, Collier P, Lanspa M, Duggal A. Is Left Ventricular Systolic Dysfunction Associated With Increased Mortality Among Patients With Sepsis and Septic Shock? Chest. 2023 Jun;163(6):1437-1447. doi: 10.1016/j.chest.2023.01.010. Epub 2023 Jan 14. PMID: 36646415
97. Chotalia M, Ali M, Hebballi R, Singh H, Parekh D, Bangash MN, Patel JM. Hyperdynamic Left Ventricular Ejection Fraction in ICU Patients With Sepsis. Crit Care Med. 2022 May 1;50(5):770-779. doi: 10.1097/CCM.0000000000005315. Epub 2021 Oct 4. PMID: 34605779
98. Paonessa JR, Brennan T, Pimentel M, Steinhaus D, Feng M, Celi LA. Hyperdynamic left ventricular ejection fraction in the intensive care unit. Crit Care. 2015 Aug 7;19(1):288. doi: 10.1186/s13054-015-1012-8. PMID: 26250903; PMCID: PMC4528812
99. Ng ACT, Bax JJ. Hyperdynamic left ventricular function and the prognostic implications for heart failure with preserved ejection fraction. Eur Heart J. 2020 Mar 21;41(12):1258-1259. doi: 10.1093/eurheartj/ehz706. PMID: 31651945.
100. Singer DJ, Oropello J. A Hyperdynamic Left Ventricle on Echocardiogram: Not Always Sepsis. Chest. 2020 Nov;158(5):e263-e265. doi: 10.1016/j.chest.2019.11.060. PMID: 33160549
101. Sagristà-Sauleda J, Angel J, Sambola A, Alguersuari J, Permanyer-Miralda G, Soler-Soler J. Low-pressure cardiac tamponade: clinical and hemodynamic profile. Circulation. 2006 Aug 29;114(9):945-52. doi: 10.1161/CIRCULATIONAHA.106.634584. Epub 2006 Aug 21. PMID: 16923755
102. Gollapudi RR, Yeager M, Johnson AD. Left ventricular cardiac tamponade in the setting of cor pulmonale and circumferential pericardial effusion. Case report and review of the literature. Cardiol Rev. 2005 Jul-Aug;13(4):214-7. doi: 10.1097/01.crd.0000151499.06046.48. PMID: 15949058.
103. Sahay S, Tonelli AR. Pericardial effusion in pulmonary arterial hypertension. Pulm Circ. 2013 Sep;3(3):467-77. doi: 10.1086/674302. Epub 2013 Nov 22. PMID: 24618534; PMCID: PMC4070800
104. Adams JR, Tonelli AR, Rokadia HK, Duggal A. Cardiac tamponade in severe pulmonary hypertension. A therapeutic challenge revisited. Ann Am Thorac Soc. 2015 Mar;12(3):455-60. doi: 10.1513/AnnalsATS.201410-453CC. PMID: 25786153; PMCID: PMC5466174
105. Grumann A, Baretto L, Dugard A, Morera P, Cornu E, Amiel JB, Vignon PP. Localized cardiac tamponade after open-heart surgery. Ann Thorac Cardiovasc Surg. 2012;18(6):524-9. doi: 10.5761/atcs.oa.11.01855. Epub 2012 Jun 29. PMID: 22785553
106. Singer DJ, Oropello J. A Hyperdynamic Left Ventricle on Echocardiogram: Not Always Sepsis. Chest. 2020 Nov;158(5):e263-e265. doi: 10.1016/j.chest.2019.11.060. PMID: 33160549
107. Watanabe N. Acute mitral regurgitation. Heart. 2019 May;105(9):671-677. doi: 10.1136/heartjnl-2018-313373. Epub 2019 Mar 1. PMID: 30824479
108. Okafor I, Raghav V, Midha P, Kumar G, Yoganathan A. The hemodynamic effects of acute aortic regurgitation into a stiffened left ventricle resulting from chronic aortic stenosis. Am J Physiol Heart Circ Physiol. 2016 Jun 1;310(11):H1801-7. doi: 10.1152/ajpheart.00161.2016. Epub 2016 Apr 22. PMID: 27106040; PMCID: PMC6189743
109. Goldste et al. Multimodality imaging of diseases of the thoracic aorta in adults: From the American society of echocardiography and the european association of cardiovascular imaging: Endorsed by the society of cardiovascular computed tomography and society for cardiovascular magnetic resonance. Journal of the American Society of Echocardiography, 28(2), 119–182. https://doi.org/10.1016/j.echo.2014.11.015
110. Viau DM, Sala-Mercado JA, Spranger MD, O’Leary DS, Levy PD. The pathophysiology of hypertensive acute heart failure. Heart. 2015 Dec;101(23):1861-7. doi: 10.1136/heartjnl-2015-307461. Epub 2015 Jun 29. PMID: 26123135
111. Kenaan M, Gajera M, Goonewardena SN. Hemodynamic assessment in the contemporary intensive care unit: a review of circulatory monitoring devices. Crit Care Clin. 2014 Jul;30(3):413-45. doi: 10.1016/j.ccc.2014.03.007. PMID: 24996604
112. Orde, S., Slama, M., Hilton, A., Yastrebov, K., & McLean, A. (2017). Pearls and pitfalls in comprehensive critical care echocardiography. In Critical Care (Vol. 21, Issue 1). BioMed Central Ltd. https://doi.org/10.1186/s13054-017-1866-z.
113. Konstantinides et al. 2019 ESC Guidelines for the diagnosis and management of acute pulmonary embolism developed in collaboration with the European respiratory society (ERS). In European Heart Journal (Vol. 41, Issue 4, pp. 543–603). Oxford University Press. https://doi.org/10.1093/eurheartj/ehz405
114. Rudski LG, Lai WW, Afilalo J, Hua L, Handschumacher MD, Chandrasekaran K, Solomon SD, Louie EK, Schiller NB. Guidelines for the echocardiographic assessment of the right heart in adults: a report from the American Society of Echocardiography endorsed by the European Association of Echocardiography, a registered branch of the European Society of Cardiology, and the Canadian Society of Echocardiography. J Am Soc Echocardiogr. 2010 Jul;23(7):685-713; quiz 786-8. doi: 10.1016/j.echo.2010.05.010. PMID: 20620859
115. Hrymak C, Strumpher J, Jacobsohn E. Acute Right Ventricle Failure in the Intensive Care Unit: Assessment and Management. Can J Cardiol. 2017 Jan;33(1):61-71. doi: 10.1016/j.cjca.2016.10.030. Epub 2016 Nov 11. PMID: 28024557
116. Hrymak C, Strumpher J, Jacobsohn E. Acute Right Ventricle Failure in the Intensive Care Unit: Assessment and Management. Can J Cardiol. 2017 Jan;33(1):61-71. doi: 10.1016/j.cjca.2016.10.030. Epub 2016 Nov 11. PMID: 28024557.
117. Jones N, Burns AT, Prior DL. Echocardiographic Assessment of the Right Ventricle-State of the Art. Heart Lung Circ. 2019 Sep;28(9):1339-1350. doi: 10.1016/j.hlc.2019.04.016. Epub 2019 May 13. PMID: 31175016
118. Marik PE. Obituary: pulmonary artery catheter 1970 to 2013. Ann Intensive Care. 2013 Nov 28;3(1):38. doi: 10.1186/2110-5820-3-38. PMID: 24286266; PMCID: PMC4175482
119. Bowcock EM, Mclean A. Bedside assessment of left atrial pressure in critical care: a multifaceted gem. Crit Care. 2022 Aug 13;26(1):247. doi: 10.1186/s13054-022-04115-9. PMID: 35964098; PMCID: PMC9375940.
120. Benkreira A, Beaubien-Souligny W, Mailhot T, Bouabdallaoui N, Robillard P, Desjardins G, Lamarche Y, Cossette S, Denault A. Portal Hypertension Is Associated With Congestive Encephalopathy and Delirium After Cardiac Surgery. Can J Cardiol. 2019 Sep;35(9):1134-1141. doi: 10.1016/j.cjca.2019.04.006. Epub 2019 Apr 16. PMID: 31395469.
121. Styczynski G, Milewska A, Marczewska M, Sobieraj P, Sobczynska M, Dabrowski M, Kuch-Wocial A, Szmigielski C. Echocardiographic Correlates of Abnormal Liver Tests in Patients with Exacerbation of Chronic Heart Failure. J Am Soc Echocardiogr. 2016 Feb;29(2):132-9. doi: 10.1016/j.echo.2015.09.012. Epub 2015 Nov 6. PMID: 26549056.
122. Kaptein MJ, Kaptein EM. Inferior Vena Cava Collapsibility Index: Clinical Validation and Application for Assessment of Relative Intravascular Volume. Adv Chronic Kidney Dis. 2021 May;28(3):218-226. doi: 10.1053/j.ackd.2021.02.003. PMID: 34906306.
123. McNaughton DA, Abu-Yousef MM. Doppler US of the liver made simple. Radiographics. 2011 Jan-Feb;31(1):161-88. doi: 10.1148/rg.311105093. Erratum in: Radiographics. 2011 May-Jun;31(3):904. PMID: 21257940
124. Kenaan M, Gajera M, Goonewardena SN. Hemodynamic assessment in the contemporary intensive care unit: a review of circulatory monitoring devices. Crit Care Clin. 2014 Jul;30(3):413-45. doi: 10.1016/j.ccc.2014.03.007. PMID: 24996604.
125. Arkles JS, Opotowsky AR, Ojeda J, Rogers F, Liu T, Prassana V, Marzec L, Palevsky HI, Ferrari VA, Forfia PR. Shape of the right ventricular Doppler envelope predicts hemodynamics and right heart function in pulmonary hypertension. Am J Respir Crit Care Med. 2011 Jan 15;183(2):268-76. doi: 10.1164/rccm.201004-0601OC. Epub 2010 Aug 13. PMID: 20709819
126. Galiè, N., Humbert, M., Vachiery, J. L., Gibbs, S., Lang, I., Torbicki, A., Simonneau, G., Peacock, A., Vonk Noordegraaf, A., Beghetti, M., Ghofrani, A., Gomez Sanchez, M. A., Hansmann, G., Klepetko, W., Lancellotti, P., Matucci, M., McDonagh, T., Pierard, L. A., Trindade, P Sirenko, Y. (2016). 2015 ESC/ERS Guidelines for the diagnosis and treatment of pulmonary hypertension. European Heart Journal, 37(1), 67–119. https://doi.org/10.1093/eurheartj/ehv317.
127. Hockstein MA, Haycock K, Wiepking M, Lentz S, Dugar S, Siuba M. Transthoracic Right Heart Echocardiography for the Intensivist. J Intensive Care Med. 2021 Sep;36(9):1098-1109. doi: 10.1177/08850666211003475. Epub 2021 Apr 15. PMID: 33853435.
128. Kushimoto S, Akaishi S, Sato T, Nomura R, Fujita M, Kudo D, Kawazoe Y, Yoshida Y, Miyagawa N. Lactate, a useful marker for disease mortality and severity but an unreliable marker of tissue hypoxia/hypoperfusion in critically ill patients. Acute Med Surg. 2016 May 16;3(4):293-297. doi: 10.1002/ams2.207. PMID: 29123802; PMCID: PMC5667335
129. Wutrich Y, Barraud D, Conrad M, Cravoisy-Popovic A, Nace L, Bollaert PE, Levy B, Gibot S. Early increase in arterial lactate concentration under epinephrine infusion is associated with a better prognosis during shock. Shock. 2010 Jul;34(1):4-9. doi: 10.1097/SHK.0b013e3181ce2d23. PMID: 20016405
130. Kraut JA, Madias NE. Lactic acidosis. N Engl J Med. 2014 Dec 11;371(24):2309-19. doi: 10.1056/NEJMra1309483. PMID: 25494270
131. Filho RR, de Freitas Chaves RC, Assunção MSC, Neto AS, De Freitas FM, Romagnoli ML, Silva E, Lattanzio B, Dubin A, Corrêa TD. Assessment of the peripheral microcirculation in patients with and without shock: a pilot study on different methods. J Clin Monit Comput. 2020 Dec;34(6):1167-1176. doi: 10.1007/s10877-019-00423-8. Epub 2019 Nov 21. PMID: 31754965; PMCID: PMC7548274.
132. Rhodes, A. et al. Surviving Sepsis Campaign: International Guidelines for Management of Sepsis and Septic Shock: 2016. In Critical Care Medicine (Vol. 45, Issue 3, pp. 486–552). Lippincott Williams and Wilkins. https://doi.org/10.1097/CCM.0000000000002255
133. Das BP, Sharma M, Bansal S, Philip M, Umamaheswara Rao GS. Prognostic Value of Tissue Oxygen Monitoring and Regional Cerebral Oxygen Saturation Monitoring and Their Correlation in Neurological Patients with Sepsis: A Preliminary, Prospective, Observational Study. J Neurosurg Anesthesiol. 2020 Jan;32(1):77-81. doi: 10.1097/ANA.0000000000000563. PMID: 30475291
134. Vincent JL, Quintairos E Silva A, Couto L Jr, Taccone FS. The value of blood lactate kinetics in critically ill patients: a systematic review. Crit Care. 2016 Aug 13;20(1):257. doi: 10.1186/s13054-016-1403-5. PMID: 27520452; PMCID: PMC4983759
135. De Backer D, Orbegozo Cortes D, Donadello K, Vincent JL. Pathophysiology of microcirculatory dysfunction and the pathogenesis of septic shock. Virulence. 2014 Jan 1;5(1):73-9. doi: 10.4161/viru.26482. Epub 2013 Sep 25. PMID: 24067428; PMCID: PMC3916386
136. Varpula M, Tallgren M, Saukkonen K, Voipio-Pulkki LM, Pettilä V. Hemodynamic variables related to outcome in septic shock. Intensive Care Med. 2005 Aug;31(8):1066-71. doi: 10.1007/s00134-005-2688-z. Epub 2005 Jun 23. PMID: 15973520
137. Geri G, Vignon P, Aubry A, Fedou AL, Charron C, Silva S, Repessé X, Vieillard-Baron A. Cardiovascular clusters in septic shock combining clinical and echocardiographic parameters: a post hoc analysis. Intensive Care Med. 2019 May;45(5):657-667. doi: 10.1007/s00134-019-05596-z. Epub 2019 Mar 19. PMID: 30888443
138. Monnet X, Shi R, Teboul JL. Prediction of fluid responsiveness. What’s new? Ann Intensive Care. 2022 May 28;12(1):46. doi: 10.1186/s13613-022-01022-8. PMID: 35633423; PMCID: PMC9148319
139. Chioncel, O., Parissis, J., Mebazaa, A., Thiele, H., Desch, S., Bauersachs, J., Harjola, V. P., Antohi, E. L., Arrigo, M., Gal, T. B., Celutkiene, J., Collins, S. P., DeBacker, D., Iliescu, V. A., Jankowska, E., Jaarsma, T., Keramida, K., Lainscak, M., Lund, L. H. Seferovic, P. (2020). Epidemiology, pathophysiology and contemporary management of cardiogenic shock – a position statement from the Heart Failure Association of the European Society of Cardiology. European Journal of Heart Failure, 22(8), 1315–1341. https://doi.org/10.1002/ejhf.1922
140. Vahanian A, Beyersdorf F, Praz F, Milojevic M, Baldus S, Bauersachs J, Capodanno D, Conradi L, De Bonis M, De Paulis R, Delgado V, Freemantle N, Gilard M, Haugaa KH, Jeppsson A, Jüni P, Pierard L, Prendergast BD, Sádaba JR, Tribouilloy C, Wojakowski W; ESC/EACTS Scientific Document Group. 2021 ESC/EACTS Guidelines for the management of valvular heart disease. Eur Heart J. 2022 Feb 12;43(7):561-632. doi: 10.1093/eurheartj/ehab395. Erratum in: Eur Heart J. 2022 Feb 18;: PMID: 34453165
141. Tehrani, B. N., Truesdell, A. G., Psotka, M. A., Rosner, C., Singh, R., Sinha, S. S., Damluji, A. A., & Batchelor, W. B. (2020). A Standardized and Comprehensive Approach to the Management of Cardiogenic Shock. In JACC: Heart Failure (Vol. 8, Issue 11, pp. 879–891). Elsevier Inc. https://doi.org/10.1016/j.jchf.2020.09.005
142. Cruz I, Stuart B, Caldeira D, Morgado G, Gomes AC, Almeida AR, Loureiro MJ, João I, Cotrim C, Pereira H. Controlled pericardiocentesis in patients with cardiac tamponade complicating aortic dissection: experience of a centre without cardiothoracic surgery. Eur Heart J Acute Cardiovasc Care. 2015 Apr;4(2):124-8. doi: 10.1177/2048872614549737. Epub 2014 Sep 2. PMID: 25182464
143. Harjola VP. et al. Contemporary management of acute right ventricular failure: a statement from the Heart Failure Association and the Working Group on Pulmonary Circulation and Right Ventricular Function of the European Society of Cardiology. Eur J Heart Fail. 2016 Mar;18(3):226-41. doi: 10.1002/ejhf.478. PMID: 26995592
144. Boulain T, Lanotte R, Legras A, Perrotin D. Efficacy of epinephrine therapy in shock complicating pulmonary embolism. Chest. 1993 Jul;104(1):300-2. doi: 10.1378/chest.104.1.300. PMID: 8325096
145. Lahm T, McCaslin CA, Wozniak TC, Ghumman W, Fadl YY, Obeidat OS, Schwab K, Meldrum DR. Medical and surgical treatment of acute right ventricular failure. J Am Coll Cardiol. 2010 Oct 26;56(18):1435-46. doi: 10.1016/j.jacc.2010.05.046. PMID: 20951319
146. Konstantinides S, Geibel A, Kasper W, Olschewski M, Blümel L, Just H. Patent foramen ovale is an important predictor of adverse outcome in patients with major pulmonary embolism. Circulation. 1998 May 19;97(19):1946-51. doi: 10.1161/01.cir.97.19.1946. PMID: 9609088
147. Konstam MA, Kiernan MS, Bernstein D, Bozkurt B, Jacob M, Kapur NK, Kociol RD, Lewis EF, Mehra MR, Pagani FD, Raval AN, Ward C; American Heart Association Council on Clinical Cardiology; Council on Cardiovascular Disease in the Young; and Council on Cardiovascular Surgery and Anesthesia. Evaluation and Management of Right-Sided Heart Failure: A Scientific Statement From the American Heart Association. Circulation. 2018 May 15;137(20):e578-e622. doi: 10.1161/CIR.0000000000000560. Epub 2018 Apr 12. PMID: 29650544.
148. Sagristà-Sauleda J, Angel J, Sambola A, Permanyer-Miralda G. Hemodynamic effects of volume expansion in patients with cardiac tamponade. Circulation. 2008 Mar 25;117(12):1545-9. doi: 10.1161/CIRCULATIONAHA.107.737841. Epub 2008 Mar 10. PMID: 18332261
149. Crespo-Leiro. et al. 2018. Advanced heart failure: a position statement of the Heart Failure Association of the European Society of Cardiology. European Journal of Heart Failure, 20(11), 1505–1535. https://doi.org/10.1002/ejhf.1236
150. Akodad M, Schurtz G, Adda J, Leclercq F, Roubille F. Management of valvulopathies with acute severe heart failure and cardiogenic shock. Arch Cardiovasc Dis. 2019 Dec;112(12):773-780. doi: 10.1016/j.acvd.2019.06.009. Epub 2019 Sep 3. PMID: 31492536
151. Hiratzk et al. 2010 ACCF/AHA/AATS/ACR/ASA/SCA/SCAI/SIR/STS/SVM guidelines for the diagnosis and management of patients with thoracic aortic disease: Executive summary: A report of the american college of cardiology foundation/american heart association task force on practice guidelines, american association for thoracic surgery, american college of radiology, american stroke association. In Circulation (Vol. 121, Issue 13). Lippincott Williams and Wilkins. https://doi.org/10.1161/CIR.0b013e3181d4739e
152. Pape LA. et al. . Presentation, Diagnosis, and Outcomes of Acute Aortic Dissection: 17-Year Trends From the International Registry of Acute Aortic Dissection. J Am Coll Cardiol. 2015 Jul 28;66(4):350-8. doi: 10.1016/j.jacc.2015.05.029. PMID: 26205591.
153. Baran DA, Grines CL, Bailey S, Burkhoff D, Hall SA, Henry TD, Hollenberg SM, Kapur NK, O’Neill W, Ornato JP, Stelling K, Thiele H, van Diepen S, Naidu SS. SCAI clinical expert consensus statement on the classification of cardiogenic shock: This document was endorsed by the American College of Cardiology (ACC), the American Heart Association (AHA), the Society of Critical Care Medicine (SCCM), and the Society of Thoracic Surgeons (STS) in April 2019. Catheter Cardiovasc Interv. 2019 Jul 1;94(1):29-37. doi: 10.1002/ccd.28329. Epub 2019 May 19. PMID: 31104355
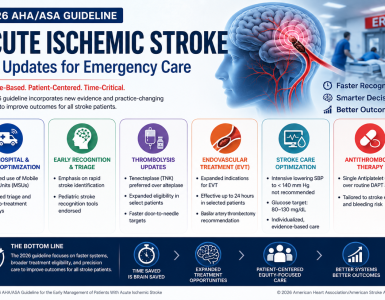

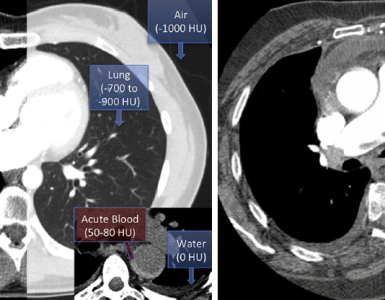
Add comment