

21 June 2026 by Shahriar Lahouti.
CONTENTS
- Preface
- ⚡️Rapid Review: How to Approach Hemodynamic Assessment
- Clinical Problem
- Pardigm Shifts
- The Dynamic Tool – The Forrester-Kenny Diagram
- New Clinical Workflow
- Conclusion: The Art of Resuscitation
- Reading More
- References
Preface
Over the past decade, we have made tremendous strides in understanding and managing shock. The core principles I have outlined on RECAPEM—recognizing shock as tissue hypoperfusion rather than mere hypotension, leveraging POCUS for rapid phenotyping, and individualizing vasoactive therapy—remain the bedrock of modern resuscitation.
Yet, as we all know, the sickest patients often defy simple categorization. The septic patient who remains hypotensive after 2 liters of fluid and norepinephrine. The patient with a normal blood pressure but a lactate of 4 and cold, mottled legs. The patient with “cardiogenic shock” who worsens with inotropes. These patients force us to ask: “Now what?”
Recent advances in our conceptual understanding of circulatory physiology offer a way out of this dilemma. We do not replace our existing approach. Rather, we provide a unifying “operating system” that sits beneath it, allowing us to understand why a patient is failing and where the weak link lies.
This article introduces that framework. It is not for the straightforward patient who responds to a fluid bolus. It is for the complex, deteriorating patient; the one who needs us to think beyond the four categories and operate at a more granular, physiological level.
⚡️RAPID REVIEW
- Secure ABCs
- MAP target & source control
- Remember: not all MAPs are created equal
- Phenotype: Warm/Cold × Wet/Dry
- 4 interfaces (POCUS, CRT, JVP, VExUS)
- (I‑RUSH coming soon)
- Target the weakest link
- Fluids (if preload-responsive)
- Afterload/Preload manipulation
- Inotropy (for uncoupling)
- The most important step
- Re-plot on Forrester-Kenny grid
- Re-check CRT & lactate
- Aim for Quadrant 1
The Clinical Problem
You know these patients well. They are the reason we continue to refine our approach.
-
The Occult Shock Patient: A 55-year-old with a history of hypertension and heart failure presents with abdominal pain and vomiting. BP is 145/90, HR 110. He looks unwell. Lactate is 3.2. He is not hypotensive. Is he in shock? How do you decide?
-
The Septic Shock Patient: A 65-year-old with pneumonia and septic shock. You gave 2L of balanced crystalloid and started norepinephrine. The MAP is now 68, but the lactate is still 4, the patient is oliguric, and the CRT is 5 seconds. The four-category framework tells you this is “distributive” shock. But why isn’t the patient improving?
-
The Mixed Shock Patient: A 70-year-old with known severe aortic stenosis and recent chemotherapy presents with fever and hypotension. The echo shows a hyperdynamic LV. Is this septic shock? Or cardiogenic shock unmasked by sepsis? Or both?
The traditional framework; forcing the patient into one of four categories (hypovolemic, distributive, cardiogenic, obstructive) often breaks down here. It presumes a single, clean pathophysiologic driver, however, in reality, shock is rarely that simple.
📍The core problem: We are treating the category rather than the physiology. We need a framework that helps us identify the weakest link in the circulatory chain and allows us to intervene at the level of that specific failure.
Paradigm Shift
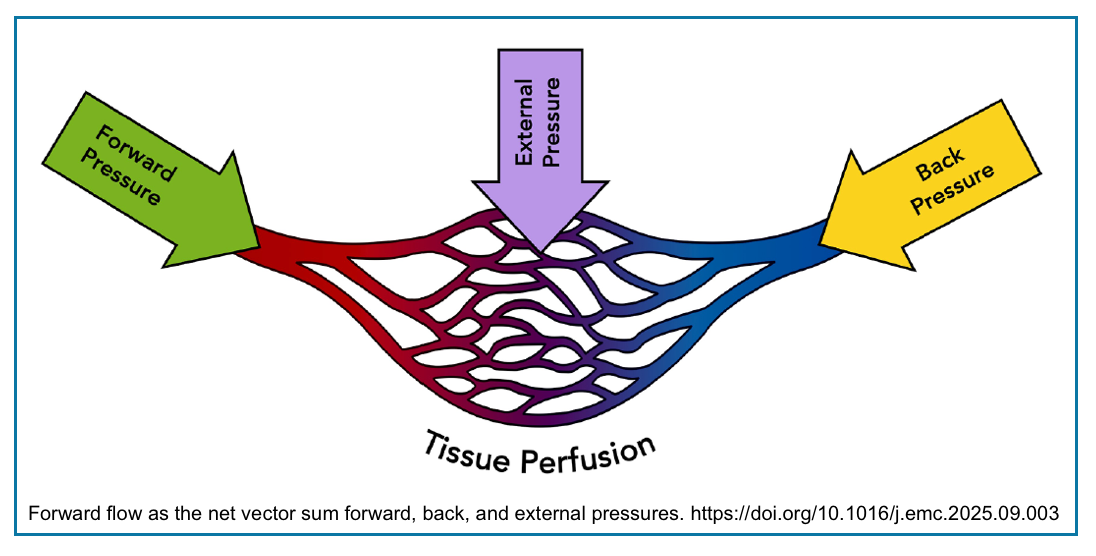
The Pressure Vector Model
To move forward, we must first refine our understanding of what drives tissue perfusion. As I have emphasized throughout RECAPEM, shock is not equal to hypotension. The new framework takes this a step further by explaining why a normal blood pressure can be misleading.
A. Flow vs. Pressure
🧩The Physiology of Flow and Pressure
- A fundamental principle of circulatory physiology is that volume does not contribute to flow unless it is under tension (stressed) .
- The total intravascular volume is partitioned into stressed volume (under tension, generating pressure and driving venous return) and unstressed volume (filling the vasculature without generating pressure).
- Forward flow requires conversion of stressed volume into pressure (via vascular tone and cardiac contraction), which must then overcome back pressure and external pressure. The net result is: Forward Flow = Forward Pressure – (Back Pressure + External Pressure).
- 🩸Tissue perfusion is determined by the vector sum of these competing pressures—not by any single variable in isolation.
- 💨 Flow is what ultimately matters for tissue perfusion.
- Pressure is the driving force that generates flow, but pressure alone does not guarantee adequate flow.
- As the “Not All MAPs” table illustrates (below), a normal MAP can be misleading if it is maintained by excessive vasoconstriction rather than adequate cardiac output.
🔺The Three Pressure Vectors: Push, Choke, and Squeeze
- The fundamental equation of circulation is:
-
Forward Flow (Q) = Net Sum of Forward Pressures – (Back Pressures + External Pressures)
-
- Forward Pressures (The “Push”): These are the forces that drive blood forward. They include:
- Mean Arterial Pressure (MAP) – the classic “perfusion pressure.”
- Cardiac Output (CO) – the volume of blood pumped.
- Stressed Volume – the portion of intravascular volume that is under tension and actively contributing to venous flow.
- Back Pressures (The “Choke”): These are the forces that oppose forward flow. They include:
- Central Venous Pressure (CVP) – the pressure at the end of the venous circuit.
- Systemic Vascular Resistance (SVR) – the resistance the LV must overcome.
- Pulmonary Vascular Resistance (PVR) – the resistance that RV must overcome.
- LV End-Diastolic Pressure (LVEDP) – the back pressure to LV filling.
- External Pressures (The “Squeeze”): These are forces external to the vessels that compress them. They include:
- Intrathoracic pressure (e.g., tension pneumothorax, PEEP)
- Pericardial pressure (e.g., cardiac tamponade)
- Intra-abdominal pressure (e.g., abdominal compartment syndrome)
- Extravascular tissue pressure (e.g., severe edema)
B. Clinical Pearl: “Not All MAPs Are Created Equal”
- This is the single most important concept to internalize. Consider two patients, both with a MAP of 65:
🧐Why does this matter?
- In Patient B, increasing vasopressors will worsen the problem by further increasing afterload and potentially dropping cardiac output.
- The correct therapy is to improve forward flow—with inotropes, or by reducing the back pressure (e.g., lowering CVP or LVEDP).
💡Takeaway: “This is why we must treat the physiology, not just the number.” A MAP of 65 is not a single number. It is a mathematical product (MAP = CO x SVR). Before you treat the number, you must understand what is generating it.
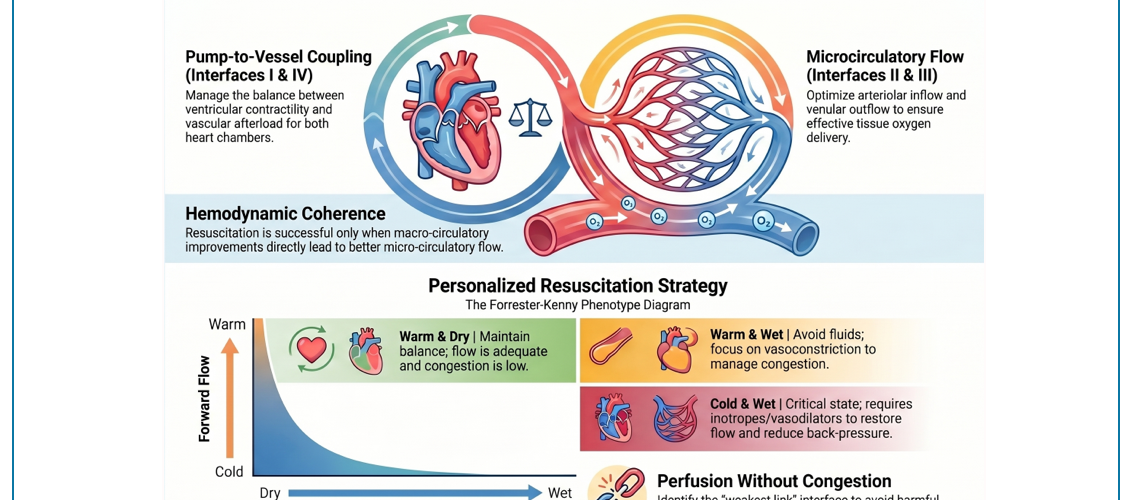
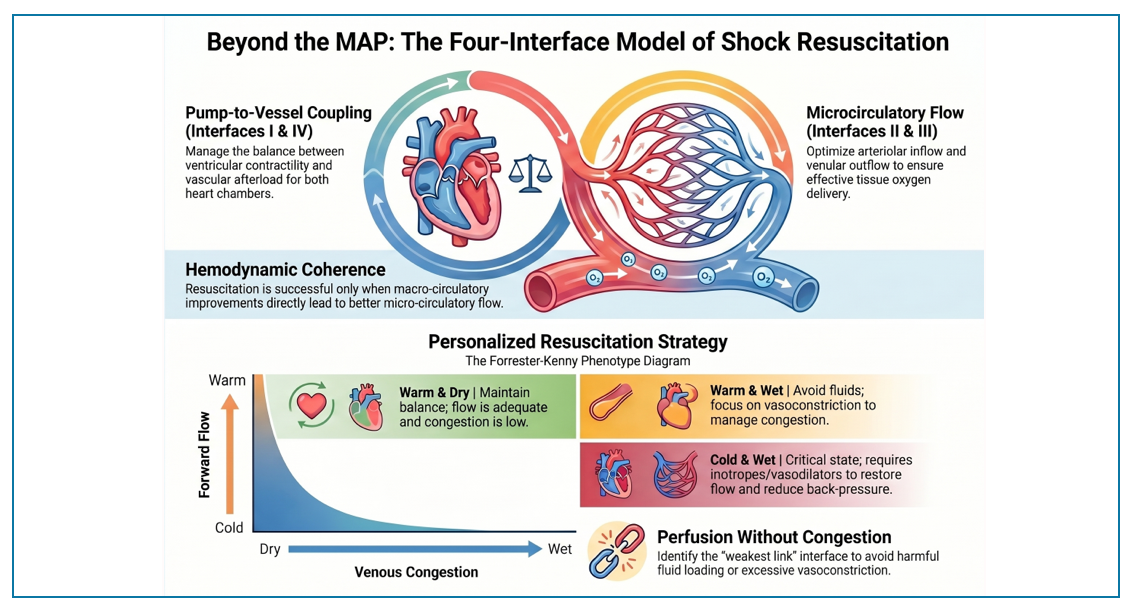
The Four-Interface Model (The “Weakest Link”)
◾️Background: A Brief Note on Macro‑ and Microcirculation
- The circulatory system operates at two interconnected levels. The macrocirculation (heart, great vessels, and conduit arteries) generates pressure and flow to deliver blood to organs. The microcirculation (arterioles, capillaries, and venules) is where oxygen and nutrients are exchanged with tissues.
- Hemodynamic coherence is the coupling between macro- and microcirculation—when macro improvements translate to micro improvements.
- Two key principles are essential to understand before we dive into the four‑interface model:
- In the macrocirculation, flow is not equal to pressure (explained above).
- The microcirculation can dissociate from the macrocirculation. More on this, here.
- Improvements in MAP or cardiac output do not always translate to improvements in tissue perfusion. This is the concept of hemodynamic incoherence.
- When coherence is lost, you can have a “normal” blood pressure but persistent tissue hypoxia—clinically reflected by a prolonged CRT or elevated lactate.
- The four‑interface framework described below provides a serial map of this macro‑to‑micro transition, helping you identify where the chain is breaking—whether it is a failure of forward flow (macrocirculation), a loss of coherence (microcirculation), or both.
The four-category framework (distributive, hypovolemic, cardiogenic, obstructive) is a useful heuristic, but it is a diagnostic label, not a physiological plan.
🚨The Four-Interface Framework
- This replaces the old framework with a serial interface model (Figure Below).
- Shock occurs when there is “uncoupling” at any of four critical pressure interfaces in the circulatory chain.
- Your job as the clinician is to find the weakest link(s) and intervene at that level.
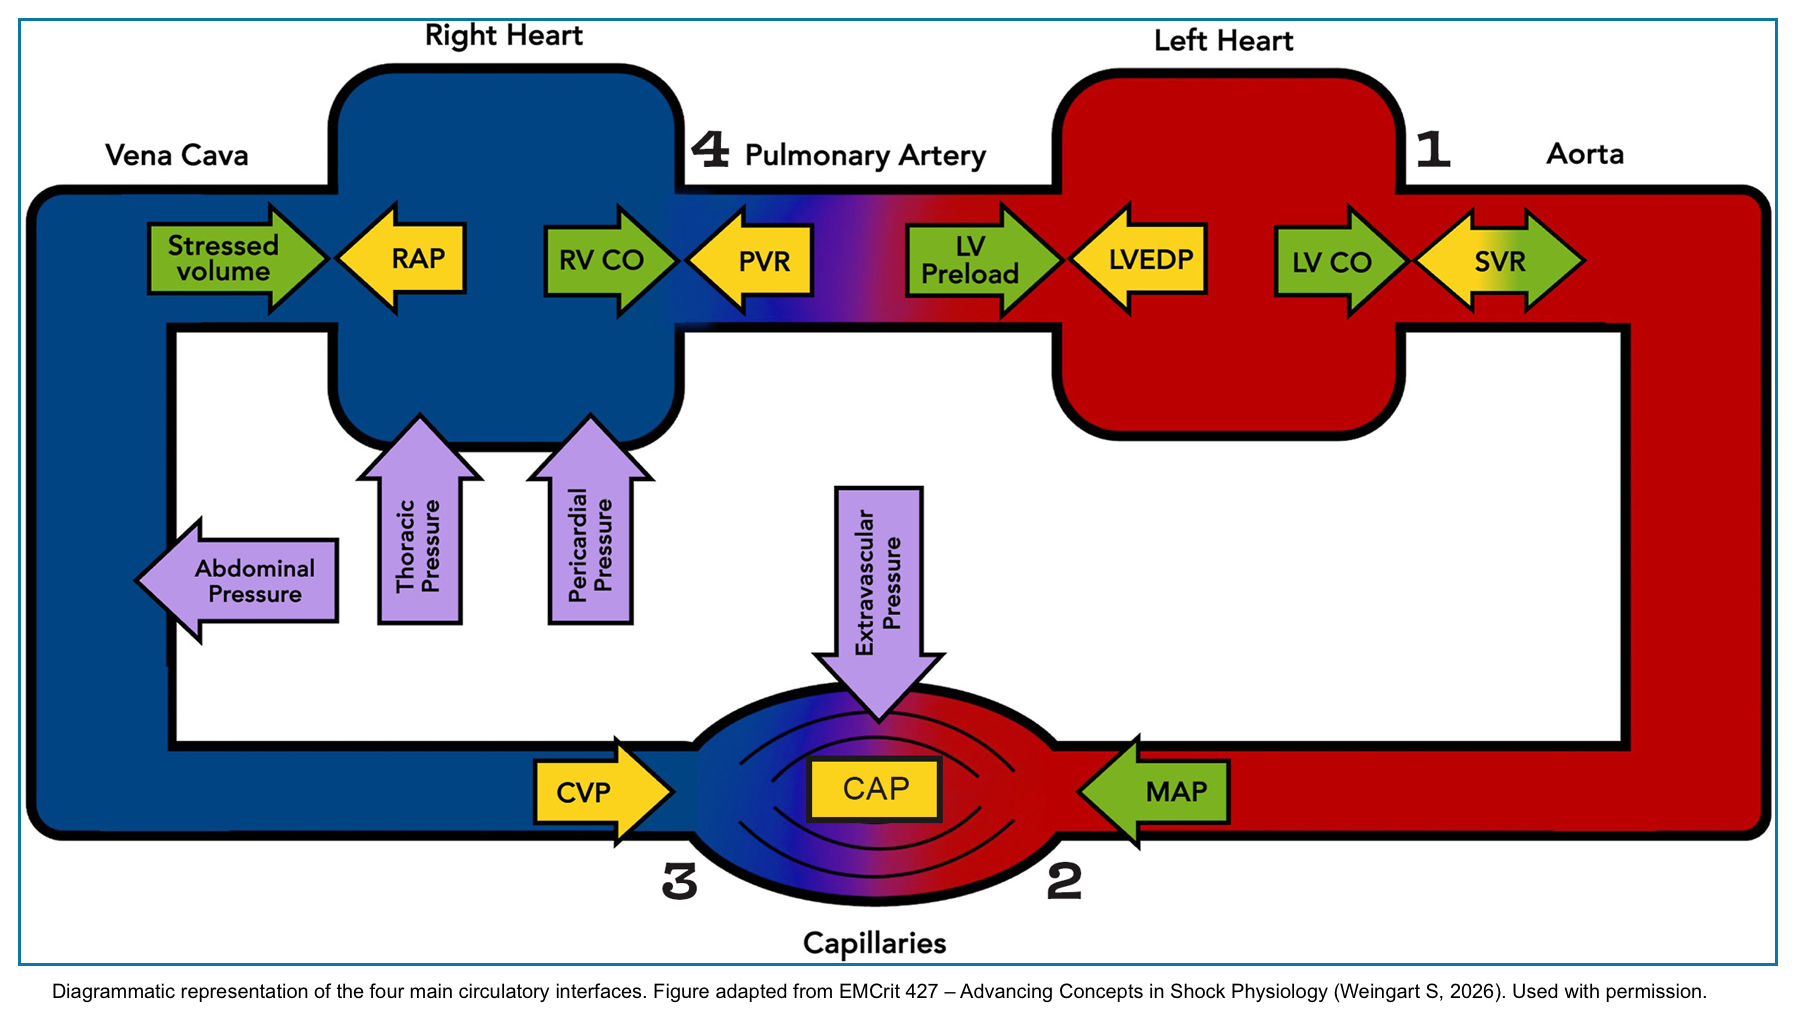
✴️The Four Circulatory Interfaces. The above diagram illustrates the serial chain of hemodynamic function. Blood flows from the left ventricle (LV) through four critical interfaces, each representing a potential point of failure. An additional sub-interface (Ia) addresses diastolic function:
- Interface I (LV → Arteries): Is the pump pushing blood forward? (Forward flow, afterload)
- Interface Ia (LV Preload → LVEDP): Is the LV stiff? Will volume help or hurt? (Diastolic function)
- Interface II (Arterioles → Capillaries): Is flow reaching the tissues? (Hemodynamic coherence)
- Interface III (Capillaries → Venules): Is the drain backed up? (Venous congestion)
- Interface IV (RV → Pulmonary Artery): Is the RV failing due to afterload? (Right heart function)
💡Finding the “weakest link” in this chain, whether at one interface or across multiple, is the key to personalized resuscitation. The table below provides a detailed breakdown of each interface, including the key variables (forward, back, and external pressures), bedside assessment tools (from your RECAPEM toolkit), and the corresponding management principles.
⎮A Critical Distinction: Coupling, Uncoupling, and Failure
◾️Before we dive into the details of each interface, we must clarify a fundamental distinction that is often misunderstood.
- Coupling refers to the ratio of elastances (compliance) between two structures. For the LV-arterial interface, coupling is expressed as Ea/Ees (arterial elastance divided by ventricular elastance). Normal coupling maximizes efficiency.
- Uncoupling occurs when this ratio becomes abnormal (e.g., Ea/Ees > 1.0). This means the pump cannot overcome the load—the relationship between contractility and afterload is broken.
- Failure is a broader term. It includes conditions where there is no uncoupling (the ratio is normal), but the system still fails. The classic example is hypovolemia: Ea/Ees may be normal, but the LV still fails because preload is inadequate.
—A Simple Analogy: The Bike 🚵🏿♀️
- Imagine riding a bike up a hill.
- Coupling is when your legs (the pump) and the gear ratio (the load) are perfectly matched. You pedal efficiently, and the bike moves forward smoothly.
- Uncoupling is when the gear ratio is wrong—say, you’re in a high gear on a steep hill. Your legs cannot overcome the load. You strain, but the bike barely moves.
- Failure is broader. It includes situations where the gear ratio is fine, but something else is wrong—like a flat tire (low preload) or a broken chain (loss of coherence). The bike doesn’t move, but the pump and the load are actually well-matched.
The clinical takeaway: Before you “fix” the bike, you must first diagnose why it isn’t moving. Is it a gearing problem (uncoupling), a flat tire (failure without uncoupling), or something else?
The example above illustrates the distinction between uncoupling and failure without uncoupling at a single interface (Interface I: LV → Arteries). However, as we have seen, shock can arise from dysfunction at any of the four interfaces—or from interactions between them.
Table 1 provides a comprehensive breakdown of all four interfaces (plus the diastolic sub-interface Ia). For each interface, it lists the core question, key variables (forward, back, and external pressures), bedside assessment tools, and the corresponding management principles—with explicit labels for whether the state represents uncoupling or failure without uncoupling.
Use this table as your bedside checklist to systematically assess every complex shock patient.
📊 Table 1. The Four Circulatory Interfaces — The “Weakest Link” Framework ▼ click to expand/collapse
| Interface | Core Question | Key Variables | Bedside Tools (from RECAPEM) | Clinical Management Principles |
|---|---|---|---|---|
| I. LV → Arteries |
⚙️ Is the pump pushing blood forward?
(Assess coupling & failure)
|
⬆ Forward: LV CO, SV ⬇ Back: SVR |
POCUS LVEF, LVOT VTI Vitals Pulse Pressure, Shock Index Physical Skin warmth (vs. cold) |
• Low SV + Low SVR (Warm) → Fluids (if preload responsive) (Failure without uncoupling) • Low SV + High SVR (Cold) → Avoid vasopressors → Inotropes (Uncoupling: Ea/Ees > 1.0) |
| Ia. LV Preload → LVEDP |
🫀 Is the LV stiff? Will volume help or hurt?
(Assess diastolic function)
|
⬆ Forward: LV Preload ⬇ Back: LVEDP |
POCUS LV size, E/e’ ratio, B-lines Physical JVP, crackles |
• Poor compliance (steep curve): Small volume shifts cause big pressure changes. (Failure of diastolic function) • Very sensitive to fluids AND diuresis. • May need higher RAP to overcome elevated LVEDP. |
| II. Arterioles → Capillaries |
🩸 Is flow reaching the tissues? (Coherence)
(Assess microcirculatory failure)
|
⬆ Forward: MAP ⬇ Back: Pcc (Critical Closing Pressure) |
Physical CRT, Mottling Labs Lactate Monitor Perfusion Index (PI)† |
• CRT improves with intervention → Coherence intact (No failure) • CRT does NOT improve → Microcirculatory failure → Consider vasodilators, inotropes, or source control (Failure of coherence; consider incoherence) |
| III. Capillaries → Venules |
🚰 Is the drain backed up? (Choking tissues)
(Assess venous congestion)
|
⬆ Forward: MSFP ⬇ Back: CVP / RAP ⬌ External: PEEP, tamponade, IAP |
Physical JVP POCUS IVC, VExUS, Femoral Vein Doppler Labs Congestive hepatopathy, nephropathy |
• CVP is tissue afterload, NOT preload. (Failure of venous drainage) • CVP > 10–12 chokes organ perfusion. • Goal: Lower CVP (diuresis, RV support, afterload reduction). |
| IV. RV → Pulmonary Artery |
💔 Is the RV failing due to afterload?
(Assess RV-PA coupling)
|
⬆ Forward: RV CO ⬇ Back: PVR |
POCUS TAPSE/PASP ratio (<0.31 = uncoupling), RV size/function, RVOT Doppler Physical Elevated JVP, edema |
• RV is exquisitely afterload-sensitive. • Volume only helps if PVR is normal (e.g., RV infarct). (Failure without uncoupling; coupling intact) • High PVR (PE, PH): Volume hurts. Need PVR reduction. (Uncoupling: Ees/Ea ratio abnormal) |
† Perfusion Index (PI): Derived from the pulse oximeter waveform, PI is the ratio of the pulsatile (arterial) to non-pulsatile (venous/tissue) signal. It reflects peripheral microcirculatory perfusion. Key thresholds: PI < 1.4 indicates poor peripheral perfusion; PI < 0.6 after resuscitation predicts 30-day mortality; ΔPI > 33% after fluid challenge or ΔPI > 9% after passive leg raising predicts fluid responsiveness. PI is a continuous, non-invasive monitor parameter — not a POCUS measurement. (Sun X, et al. Eur J Med Res. 2024;29:457; Crager S. Emerg Med Clin N Am. 2026;44:315-331.)
⎮Bedside Distinction: Uncoupling vs. Failure without Uncoupling
◾️Now that we understand the concepts, how do we distinguish uncoupling from failure at the bedside? The answer lies in integrating POCUS with clinical markers.
⚙️ The Takeaway: Uncoupling → Inotropes / Afterload Reduction. Failure without Uncoupling → Fluids / Vasopressors / Diuresis.
⚙️Interface Interactions: How the Interfaces Connect
◾️The four interfaces do not function in isolation. They are connected in series—failure at one interface propagates forward or backward along the circulatory chain. Understanding these interactions is essential for managing complex, deteriorating patients.
🔑Key Interactions:
-
Interface II (Arterioles → Capillaries) reflects the adequacy of Interface I (LV → Arteries) and Interface IV (RV → PA).
-
If CRT is prolonged or lactate is elevated, it suggests the pump (I) or the right heart (IV) is not delivering adequate flow. Poor tissue perfusion is a red flag for pump failure.
-
-
Interface III (Capillaries → Venules) helps distinguish acute vs. chronic RV failure (Interface IV).
-
In acute RV failure (e.g., PE), the RV cannot compensate, and CVP rises sharply. In chronic RV failure (e.g., pulmonary hypertension), the RV may tolerate high pressures, and CVP may be elevated but stable. The trajectory of CVP and VExUS tells you whether the RV is compensating or failing.
-
-
Interface II and III are the inflow and outflow of the microcirculation.
-
Interface II delivers blood to the tissues; Interface III drains it away. If either is compromised, microcirculatory flow fails—regardless of macrocirculatory parameters.
-
-
Interface IV (RV → PA) affects Interface I (LV → Arteries) in two ways:
-
RV failure decreases LV preload (less blood delivered to the LV).
-
RV dilation shifts the interventricular septum, compressing the LV and reducing LV compliance. RV failure directly impairs LV function.
-
-
Interface I (LV → Arteries) failure causes backward pressure that worsens Interface IV (RV → PA).
LV failure → elevated left atrial and pulmonary pressures → increased RV afterload → RV failure. A failing LV will eventually “muck up” the RV.
💡The clinical pearl: Do not treat interfaces in isolation. A finding at one interface often points to dysfunction at another. Use these interactions to anticipate propagation of failure—and to guide sequential, physiologically coherent therapy.
💡Key Insights From Four-Interface Model
◾️The four-interface framework provides several practical insights that directly inform clinical decision-making.
- CVP is NOT preload. It is the tissue afterload.
- This is the most paradigm-shifting concept in the entire framework.
- As the authors of Interface III state: “The presence of a significantly elevated CVP (likely values over 10–12) may uncouple interface III and potentially contribute to tissue hypoperfusion irrespective of the cause.” For example, a patient with a MAP of 70 and CVP of 15 has a perfusion pressure of 55—significantly lower than the MAP suggests.
- When you see a high CVP, you should think: This is a pressure that is actively choking off organ perfusion. Your goal should be to lower it—not to interpret it as a sign of “full tank” that justifies more fluids.
- This is the most paradigm-shifting concept in the entire framework.
- The RV is the weak link.
- Unlike the LV, which can tolerate increases in afterload, the RV is exquisitely sensitive. In patients with elevated PVR (PE, pulmonary hypertension), volume resuscitation is harmful. It dilates the RV, shifts the interventricular septum, decreases LV preload, and drops cardiac output. In these patients, the therapy is to reduce PVR (with pulmonary vasodilators) or offload volume—not to give more fluids.
- LVEDP matters in every fluid decision.
- Patients with a stiff, non-compliant LV (diastolic dysfunction, LVH, AS) are on a knife’s edge. A small fluid bolus can cause a massive rise in LVEDP, precipitating pulmonary edema.
- Conversely, a small diuresis can drop LVEDP too far, causing a precipitous drop in BP. These patients require meticulous, slow titration of therapy—not large boluses or aggressive diuresis.
- Hemodynamic coherence is the goal.
- Interface II reminds us that improvements in macrocirculation (MAP, CO) do not always translate to improvements in microcirculation (tissue perfusion).
- CRT is your best bedside tool to assess coherence. If CRT improves with your intervention, you are on the right track. If it does not, you need to reconsider your strategy—you may be treating the numbers, not the tissues.
The Dynamic Tool – The Forrester-Kenny Diagram
We now have a systematic way to assess the four interfaces. But how do we synthesize this information into a rapid, actionable plan at the bedside?
◾️The Forrester-Kenny Diagram (adapted from Kenny et al.) provides an elegant solution. It is a 2×2 grid that integrates the two most clinically relevant variables:
- X-Axis: Forward Flow (Cardiac Output) – Assessed clinically as “Warm” (normal/high CO) vs. “Cold” (low CO). You can assess this using skin temperature, CRT, pulse pressure, and LVOT VTI on POCUS.
- Y-Axis: Venous Congestion – Assessed clinically as “Wet” (congested) vs. “Dry” (not congested). You can assess this using JVP, IVC size, VExUS score, and pulmonary B-lines on lung US.
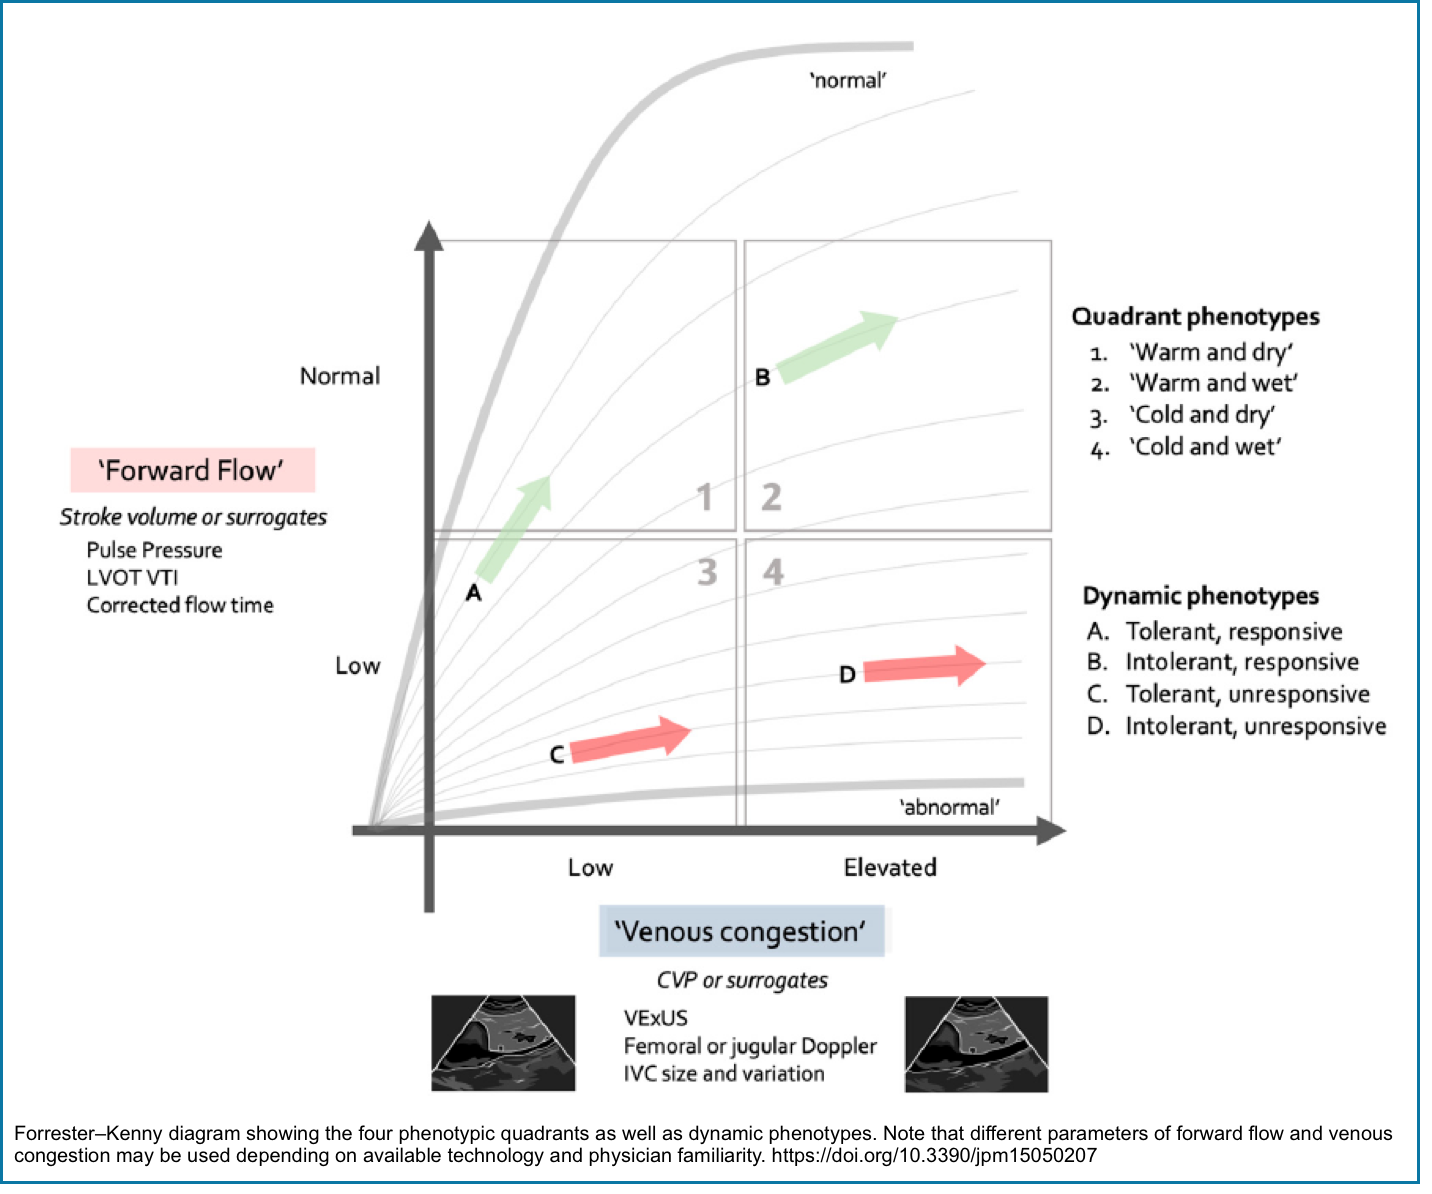
The Forrester-Kenny Diagram. This dynamic phenotyping tool integrates forward flow (Warm vs. Cold) and venous congestion (Wet vs. Dry) to guide initial therapy. The four quadrants represent distinct hemodynamic states, each with a specific action plan.
- The table below provides a detailed breakdown of each quadrant, including clinical examples, actionable interventions, and the underlying physiology—specifically, whether the state represents uncoupling (e.g., cold & wet with high SVR) or failure without uncoupling (e.g., cold & dry with low preload).
📊Use this as your rapid bedside guide to phenotype and treat every shock patient.
QUADRANT 1 (Warm & Dry)
How to Use This at the Bedside
- At first contact, place the patient in one of the four quadrants. This dictates your first major therapeutic decision.
- After each intervention (fluids, vasopressors, inotropes), reassess and re-plot the patient. Your goal is to move them toward Quadrant 1 (Warm & Dry) .
- If the patient is not moving toward Quadrant 1, use the Four-Interface Model to systematically search for the weakest link(s).
New Clinical Workflow
We now have all the pieces. Here is how to integrate them into a seamless clinical workflow for the complex shock patient.
🆘Step 1: Immediate Stabilization
- Secure the airway and breathing.
- Establish large-bore IV/IO access.
- Treat immediately life-threatening causes (tension pneumothorax, tamponade, anaphylaxis).
- Do not delay vasopressors for fluid resuscitation in patients with overt hypotension.
- As I have emphasized on RECAPEM, the leaking capillary system in sepsis cannot hold fluid. Start vasopressors early, peripherally if needed.
- Source control is paramount. No hemodynamic therapy will work without it.
📊Step 2: Phenotype with the Forrester-Kenny Diagram
- In the first 5-10 minutes, determine if the patient is Warm or Cold (skin, CRT, pulse pressure).
- Determine if the patient is Wet or Dry (JVP, IVC, B-lines).
- Plot the patient on the grid. This gives you your initial therapeutic strategy.
✴️Step 3: Assess the Four Interfaces
- Now, go systematically through the Four-Interface Master Table.
- Interface I (LV → Arteries): Is the pump working? Get an LVOT VTI and assess LVEF on POCUS.
- Interface Ia (LV Preload → LVEDP): Is the LV stiff? Look at LV size, E/e’ ratio, and B-lines.
- Interface II (Arterioles → Capillaries): Is the microcirculation being perfused? Check CRT and lactate.
- Interface III (Capillaries → Venules): Is the drain backed up? Assess IVC, VExUS, and JVP.
- Interface IV (RV → PA): Is the RV failing? Check TAPSE/PASP ratio and RV size/function.
🎯Step 4: Intervene Based on Physiology
- Identify the weakest link(s):
- Is it a failure of forward flow (Interface I)?
- A failure of coherence (Interface II)?
- A failure of drainage (Interface III)?
- Or a failure of the RV (Interface IV)?
- Choose your therapy based on the weakest link, NOT just the category of shock.
- Warm & Wet (Quadrant 2): Stop fluids. Add vasopressors.
- Cold & Dry (Quadrant 3): Give fluids/inotropes.
- Cold & Wet (Quadrant 4): Avoid vasopressors. Start inotropes. Consider diuresis.
- High LVEDP (Interface Ia): Titrate fluids/diuretics carefully. Small changes matter.
- High CVP (Interface III): Target therapies to lower CVP (diuresis, RV support).
- High PVR (Interface IV): Avoid volume. Consider pulmonary vasodilators.
♻️Step 5: Reassess (The Most Important Step)
- Re-evaluate after every intervention (this is the most important step). This emphasizes the dynamic nature of resuscitation.
- Re-plot the patient on the Forrester-Kenny diagram.
- Re-check the CRT and lactate.
- Is the patient moving toward Quadrant 1?
- If not, go back to Step 3 and reassess the interfaces. You may have missed a second (or third) weak link.
The new framework does not replace the old. It expands upon it, providing a more granular, physiology-based approach for the complex, deteriorating patient.
✅ Upgrade your mental model. Don’t discard it.
⚙️ The key insight: Uncoupling ≠ failure without uncoupling. Distinguishing these mechanisms guides therapy.
Conclusion – The Art of Resuscitation
The framework presented here is not a replacement for your existing knowledge. It is an upgrade. It acknowledges the complexity of the patients we treat and provides a systematic, physiology-based path through the “now what?” moments.
🔑The key takeaways are:
-
Shock is a failure of forward flow, not just hypotension. A normal blood pressure can be misleading.
-
Tissue perfusion is the net result of forward, back, and external pressures. “Not all MAPs are created equal.”
-
There are four critical pressure interfaces in the circulatory chain. Your job is to find the weakest link(s)—and understand how they interact—and intervene at that level.
-
CVP is tissue afterload, not preload. CVP is a measure of tissue afterload—the pressure organs must drain against.”
-
A high CVP chokes organ perfusion. Lowering it is a therapeutic goal.
-
-
The RV is exquisitely afterload-sensitive. Volume only helps if PVR is normal (e.g., RV infarction). High PVR (PE, PH): volume hurts.
-
The Forrester-Kenny Diagram is a rapid bedside tool to phenotype the patient, guide initial therapy, and track progress.
-
Hemodynamic coherence is the ultimate goal. If CRT improves with your intervention, you are on the right track. If not, reassess.
💡The key distinction: Remember the difference between uncoupling (abnormal Ea/Ees ratio) and failure without uncoupling (e.g., hypovolemia). Treat the mechanism, not just the label.
📍This is the art of resuscitation. It requires a deep understanding of physiology, a systematic approach to assessment, and the humility to reassess and adapt.
Reading More
- Hemodynamic Insight #1: What Are We Really Measuring?
- Advancing Concepts in Shock Physiology (EMCrit)
- Panel: 4 Quadrant Hemodynamic Ultrasound Integration, IVC Ultrasound and Much More! (EMCrit)
- The Realm of Tissue Perfusion: Systemic Hypoperfusion and Congestion.
- Echocardiography In The Contemporary Hemodynamic Monitoring
- Hypervolemia- ABC of Deresuscitation- VExUS Score
- Undifferentiated Shock: Approach to Diagnosis and Stabilization in ED.
References
1. PMID: 40423078. Rola P, Kattan E, Siuba MT, Haycock K, Crager S, Spiegel R, Hockstein M, Bhardwaj V, Miller A, Kenny JE, Ospina-Tascón GA, Hernandez G. Point of View: A Holistic Four-Interface Conceptual Model for Personalizing Shock Resuscitation. J Pers Med. 2025 May 20;15(5):207. doi: 10.3390/jpm15050207.
2. Sara Crager: Reframing Shock: Bridging the Gap Between Theory and Practice, Emergency Medicine Clinics of North America, Volume 44, Issue 2,
2026, Pages 315-331, ISSN 0733-8627, ISBN 9780443428494, https://doi.org/10.1016/j.emc.2025.09.003. (https://www.sciencedirect.com/science/article/pii/S0733862725000847).
3. PMID: 26729241. Ince C. Hemodynamic coherence and the rationale for monitoring the microcirculation. Crit Care. 2015;19 Suppl 3(Suppl 3):S8. doi: 10.1186/cc14726. Epub 2015 Dec 18.
4. PMID: 39261939. Sun X, He H, Xu M, Long Y. Peripheral perfusion index of pulse oximetry in adult patients: a narrative review. Eur J Med Res. 2024 Sep 11;29(1):457. doi: 10.1186/s40001-024-02048-3.
5. PMID: 37193993. Duranteau J, De Backer D, Donadello K, Shapiro NI, Hutchings SD, Rovas A, Legrand M, Harrois A, Ince C. The future of intensive care: the study of the microcirculation will help to guide our therapies. Crit Care. 2023 May 16;27(1):190. doi: 10.1186/s13054-023-04474-x.
6. Scott Weingart, MD FCCM. EMCrit 427 – Advancing Concepts in Shock Physiology. EMCrit Blog. Published on June 13, 2026. Accessed on June 20th 2026. Available at [https://emcrit.org/emcrit/shock-physiology/ ].

Add comment