

13 September, 2020 by Shahriar Lahouti. Peer reviewed by Mojtaba Chardoli. Last update 14 February, 2023.

CONTENTS
- Preface
- Anatomy
- Imaging
- 2D ultrasound
- Doppler Ultrasound
- Basic cardiovascular physiology
- Multi-organ POCUS: IVC evaluation
- Case scenario
- Hemodynamic monitoring and fluid responsiveness
- Case scenario
- RECAP
- Going further
- References
Preface
Different multiorgan point of care ultrasonography (POCUS) algorithms are frequently used as diagnostic tools in patients with life threatening conditions as well as for hemodynamics monitoring in critical patients. Ultrasound of the inferior vena cava (IVC) is frequently included in these protocols and can provide useful diagnostic and therapeutic guidance. It is commonly used to estimate right atrial pressure and volume status, though debate still continues about diagnostic accuracy of IVC indices. In this post, IVC indices are discussed regarding basic cardiovascular physiology and a reasonable approach to volume status evaluation is further explored.
- More on volume assessment👉 Hypervolemia- ABC of Deresuscitation
Anatomy
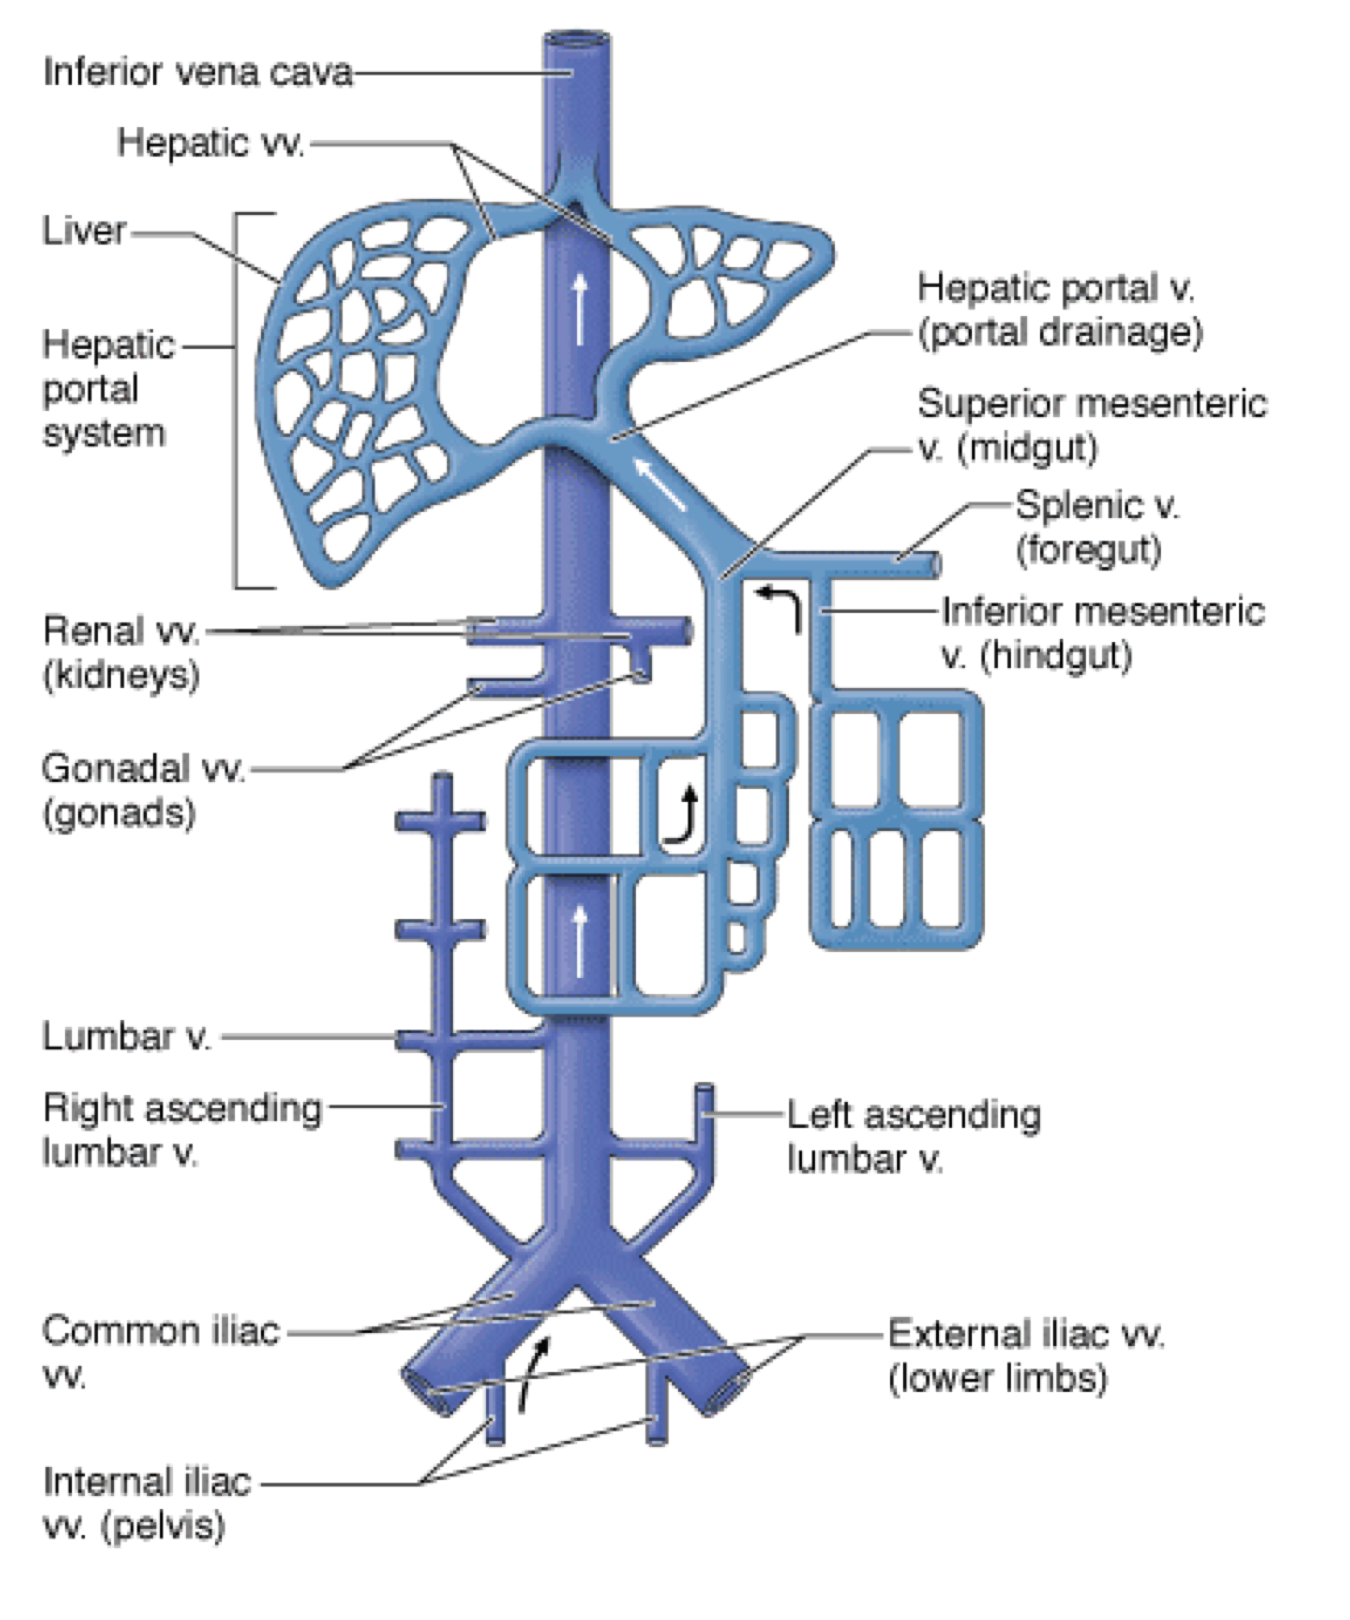
The IVC is the main conduit of venous return to the right atrium from the lower extremities and abdominal viscera. It is a thin-walled retroperitoneal structure arising from confluence of the common iliac veins at the level of the 5th lumbar vertebra and runs cranially to the right of the midline(lies just to the right of the vertebral column). It passes through the diaphragm at the level of the 8th thoracic vertebra and enters the right atrium.1
Imaging
The IVC can be examined with ultrasound and many other abdominal CT protocols. In this post, the ultrasonographic IVC indices and their correlation with the right atrial pressure is discussed. Hopefully everyone is familiar with ultrasonographic techniques for IVC examination. More on this, here.
There are two principal clinical indications in which bedside ultrasound evaluation of IVC indices in adjunct to other ultrasonographic evaluation is beneficial:
- Assessment of the undifferentiated hypotensive patient
- Assessment of acute dyspnea
- The IVC is a highly compliant vessel, and consequently its size and dynamics vary with changes in circulating blood volume,right heart pressure, intrathoracic pressure, and abdominal pressure.
- The 2D/M-mode US indices for IVC evaluation are:
- Static IVC diameter at end-expiration
- Dynamic change in diameter {collapsibility index in spontaneously breathing patients, and distensibility index in non-spontaneously breathing patients}
Which one more closely correlates to the right atrial pressure (RAP)?
- Several studies have evaluated the correlation between RAP and different IVC parameters.2 However, fewer studies have evaluated the validity of the suggested IVC parameters for the accuracy of the estimation of RAP. Most, but not all, studies have demonstrated good correlations between the IVC collapsibility index and RAP.
- Despite the presence of correlation between IVC diameter and RAP, experts suggest that this correlation is not reliable for estimation of RAP.
- It is hypothesized that an increase of RAP beyond a certain level may cause only minimal increases in IVC diameter and the degree of IVC collapsibility with inspiration. Thus, IVC dimensions and collapsibility can be used to detect elevated CVP, but they have limited utility in identifying the magnitude of CVP elevation.
- RAP is most commonly estimated based on the diameter and degree of collapse of the IVC during quiet inspiration and during rapid inspiration (sniff). Generally forceful inspiration should be discouraged, as this can cause translation of the IVC out of the imaging plane. RAP is typically estimated as shown in the following table.
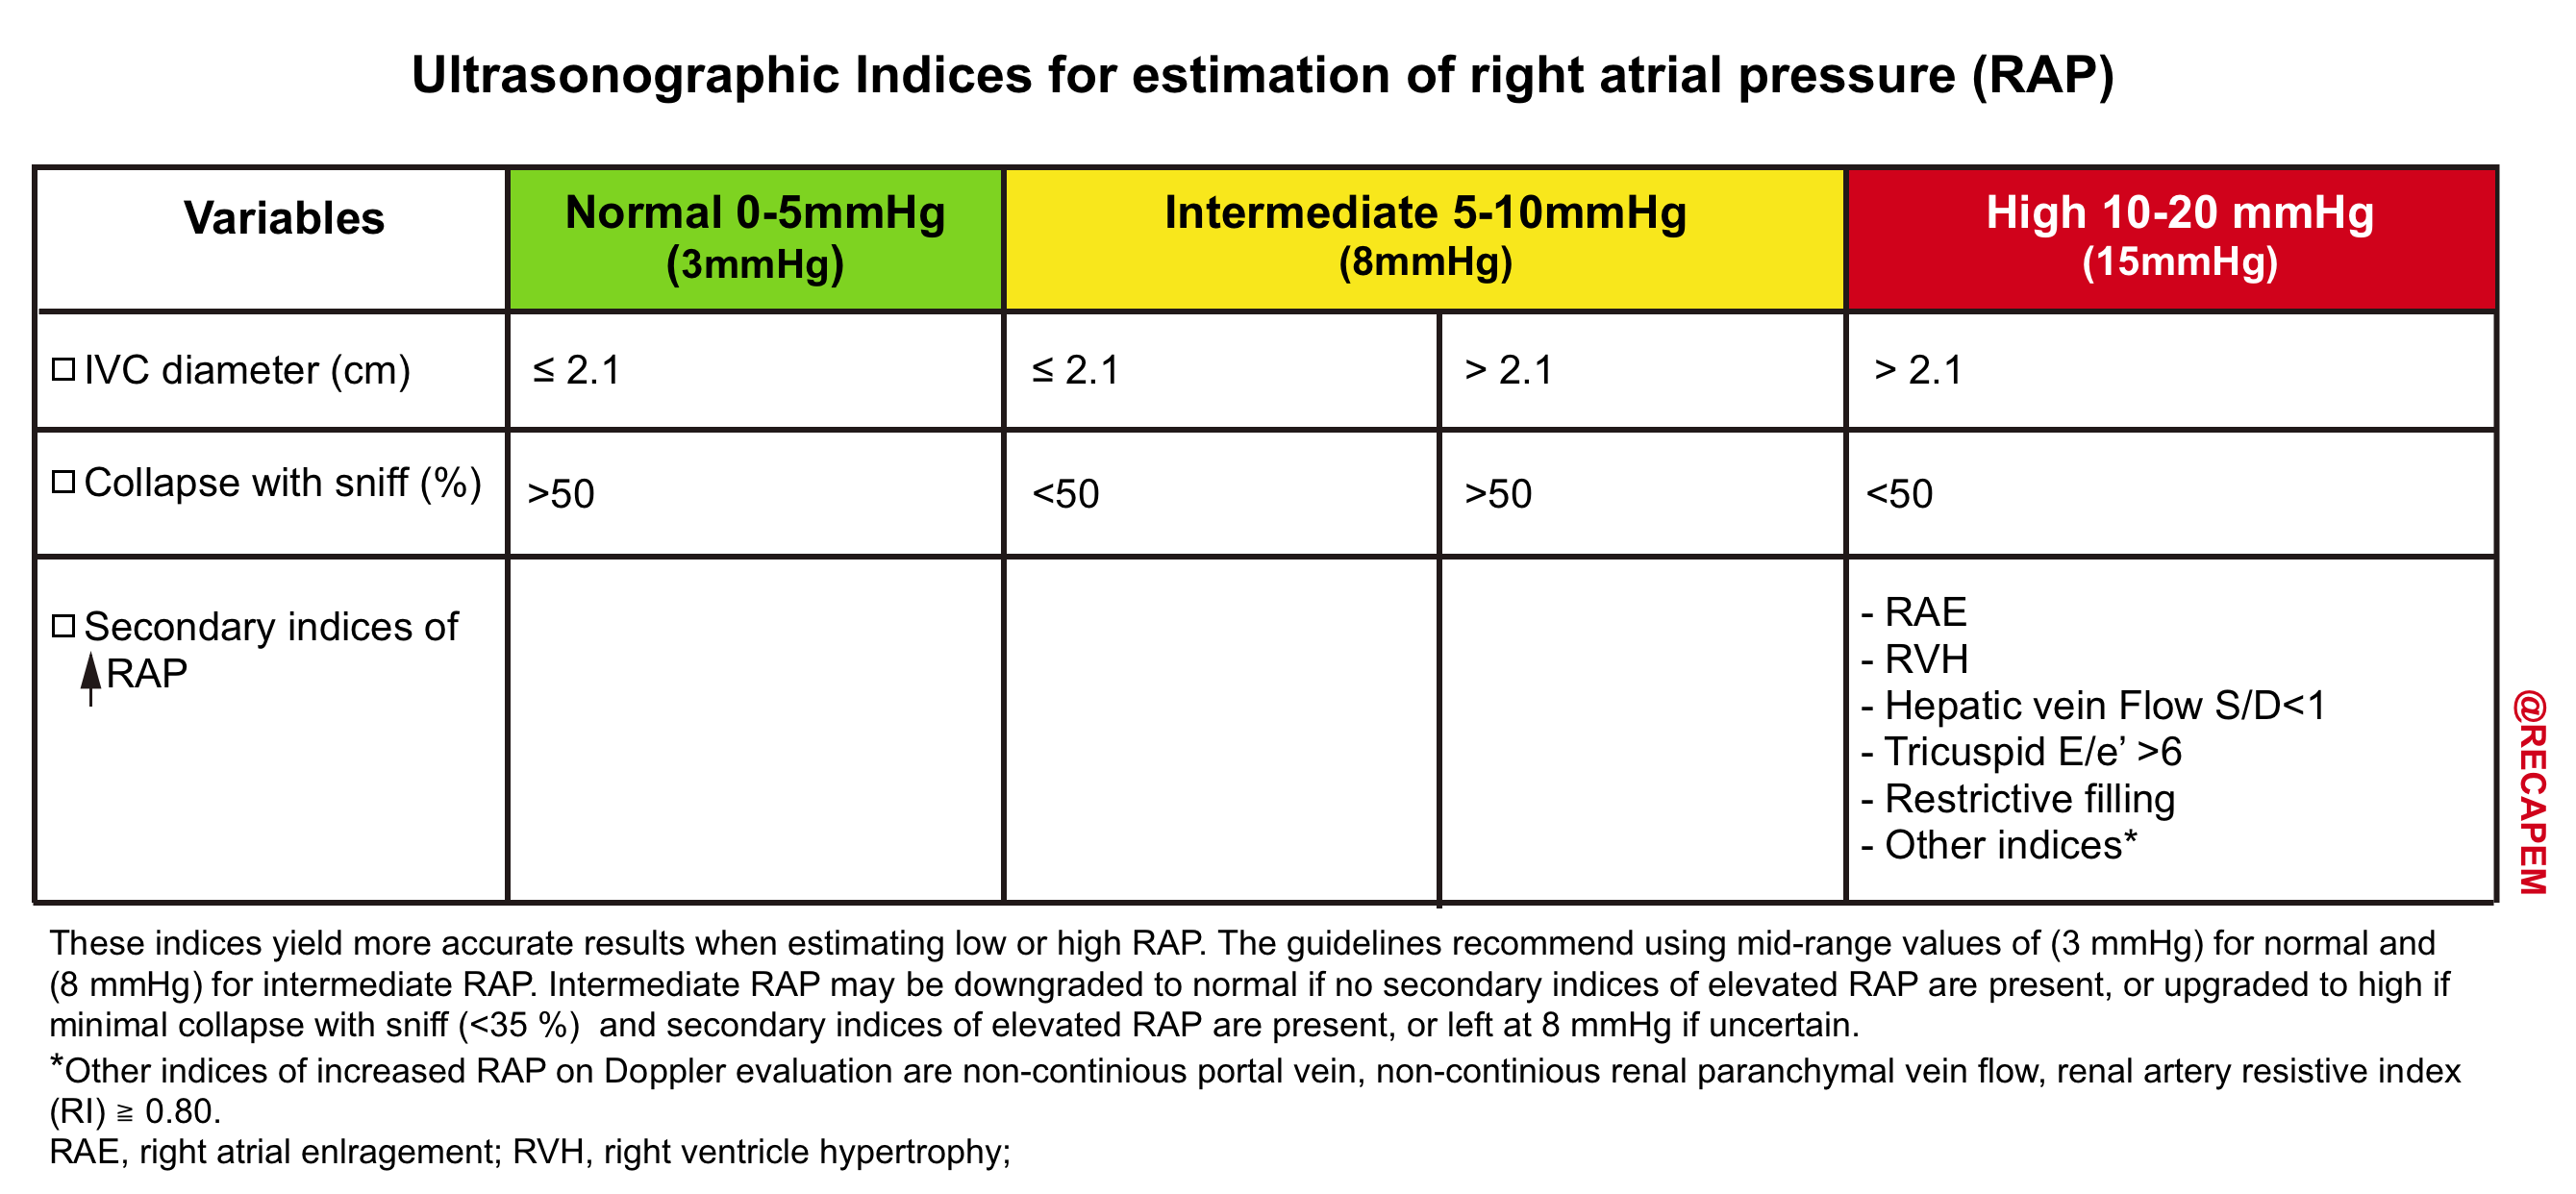
| IVC indices more closely correlates to RAP when at extreme range. When IVC measure lies in the intermediate range, a more comprehensive ultrasound exam is helpful to determine the true status of RAP 5 |
Doppler ultrasonography: Ultrasound Modalities
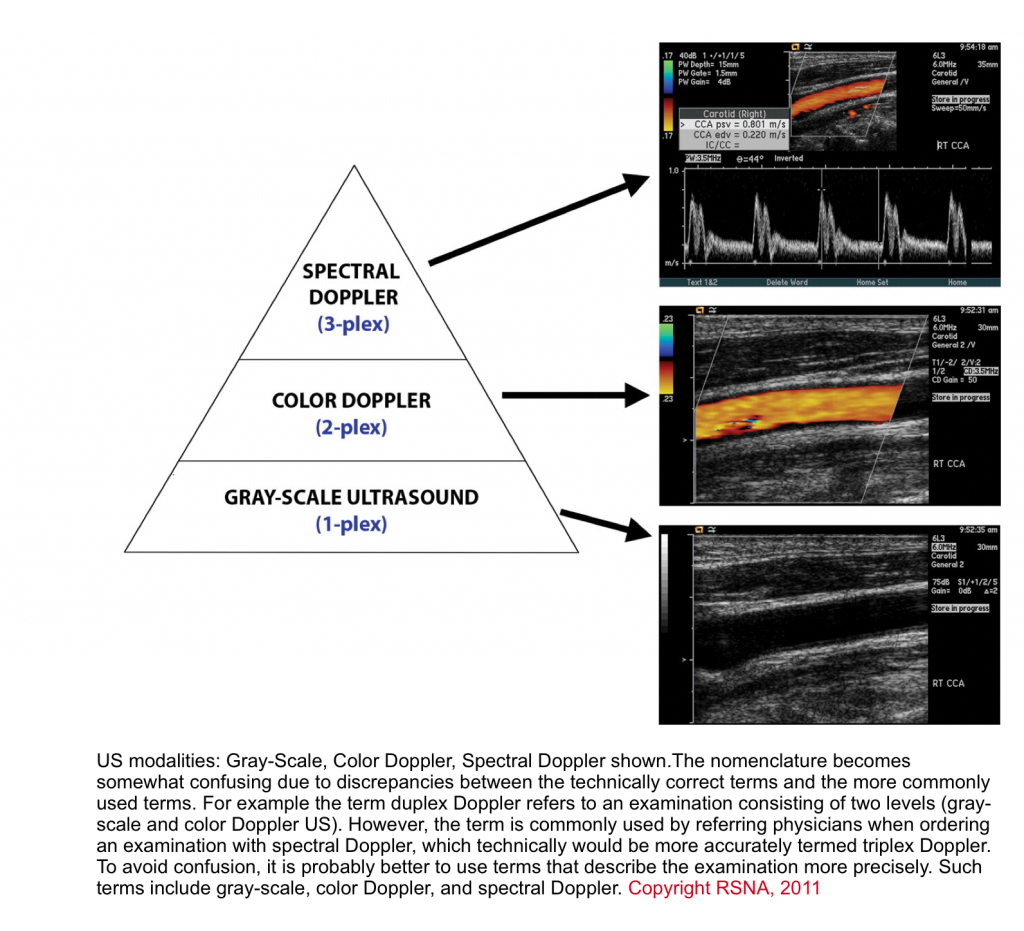
Three basic levels of ultrasound can be performed (figure below), with each level adding information to the preceding level.
- The first level is the traditional standard brightness mode (B-mode) gray-scale examination, in which no Doppler is used.
- The second level superimposes a Color Doppler interrogation region of interest. This produces an image that shows blood flow in vessels.
- The third level superimposes a small interrogation region, called a sample volume, over a vessel of interest. Targeted interrogation of the vessel produces a spectral Doppler waveform.3
The technical aspects for acquisition of the image is beyond the scope of this discussion, however some basic principles in interrogating Doppler images are reviewed here.
- By enlarge, Doppler sonography give valuable information regarding:
- Demonstration of flow
- Flow direction
- Flow pattern (laminar, turbulent)
- Flow profile (monophasic, triphasic)
- Flow velocity
- Flow direction with respect to the probe
- On Color Doppler US, flow moving towards the probe appears red, and flow directing away appears blue. On the spectral Doppler, the flow waveform appears above the baseline if flow is directing toward the probe, and below the baseline if it’s moving away from the probe.
- The general features of the spectral waveform are shown below.
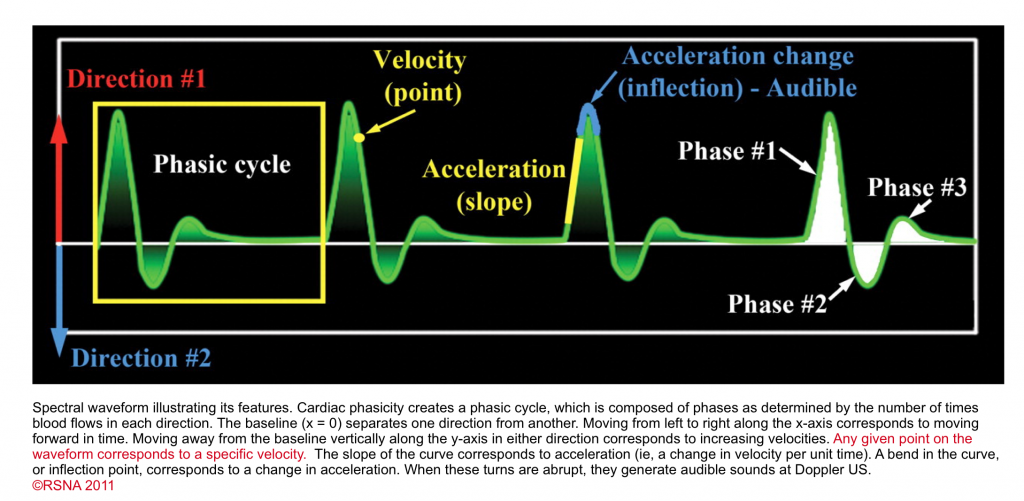
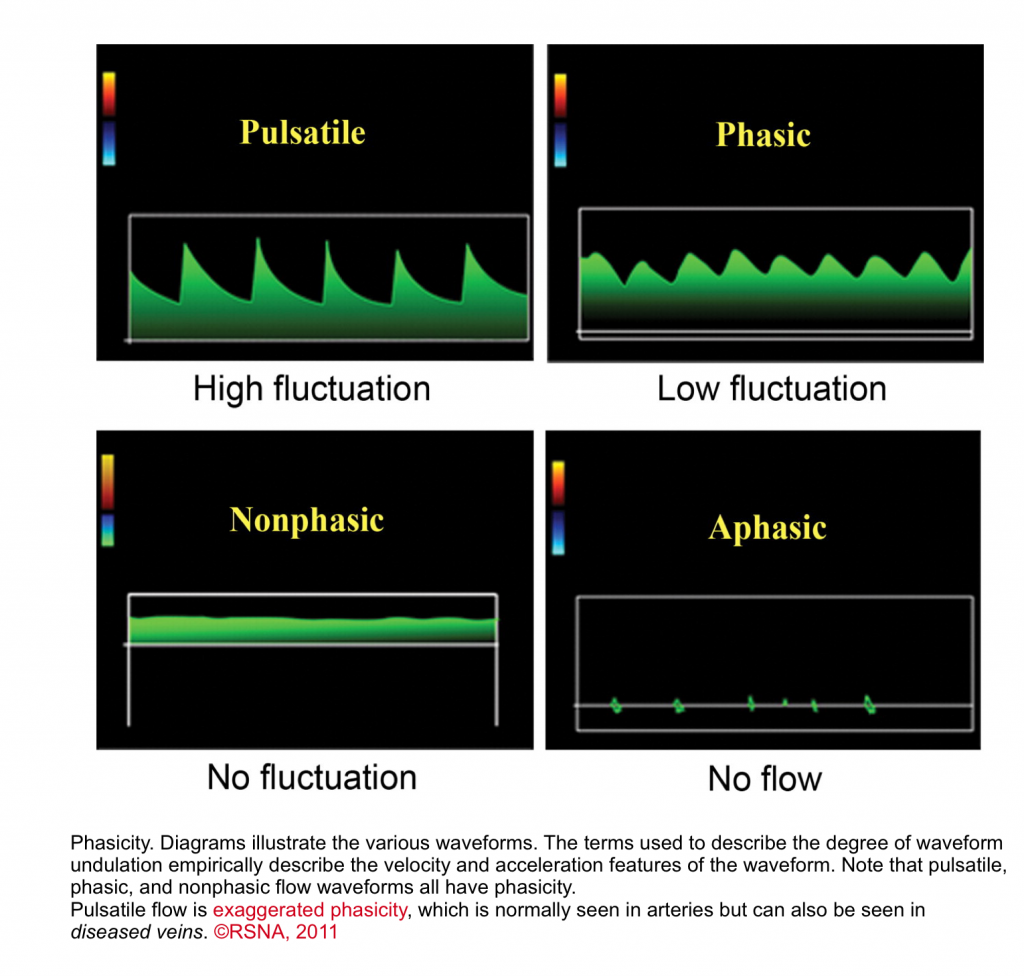
- Phasicity
- Cardiac cycles produce pressure fluctuation which in turn causes changes in velocity and acceleration of waveform on spectral Doppler. In other words, the waveform has phasicity. This finding is either present or absent but is not quantifiable with a number.
- If there is absolutely no flow (i.e. no velocity), there is no phase, and the waveform may be called aphasic. As long as there is flow, there is some form of phasicity.
- Phasic waveform: When there is a change in velocity and acceleration, the flow is called phasic.
- Nonphasic waveform
- When there is flow, but without any change in velocity or acceleration of the flow, the waveform appears flat. Nonphasic flow does in fact have a phase; however, the phase has no velocity variation (nonphasic could be thought of as meaning “nonvariation”).
- Pulsatile waveform
- When there is a marked change in velocity and acceleration, it is called pulsatile waveform as in normal arteries.3
- Nonphasic waveform
- Cardiac cycles produce pressure fluctuation which in turn causes changes in velocity and acceleration of waveform on spectral Doppler. In other words, the waveform has phasicity. This finding is either present or absent but is not quantifiable with a number.
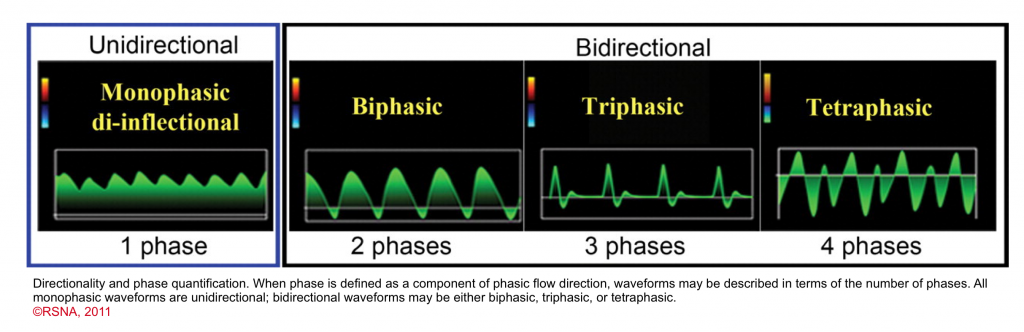
- Phase quantification
- In the presence of discrete change in direction of the flow, the waveform can be called biphasic, triphasic, tetraphasic.
- Arterial flow vs. venous flow
- Normal arterial flows are pulsatile with rapid acceleration of waveform.
- The spectral waveform varies depending on Flow pattern (laminar, turbulent), and resistance to the flow.
- Venous flow: Is the focus of discussion here.
- Veins are capacitance systems with no intrinsic pulsation properties (i.e. passive flow).
- As mentioned above, in physiologic states, there are phasicity (minor velocity change) and augmentation (external compression leads to augmentation of the flow) in all veins in our body.
- As long as flow is present, there is phasicity even in the smallest vein in the human body.
- A useful framework for differentiation of spectral waveform in venous system is to categorize the venous flow into 3 major types:
- Central veins
- These veins (IVC, IJV and hepatic vein) are close to the right atrium, and their spectral waveform reflects right-sided cardiac activity.
- Peripheral veins
- These vascular beds (e.g. intra-renal vein and upper/lower limb veins) are more distal to the heart and therefore the tracing will not directly reflect RAP variations.
- Their spectral waveforms appear flatish. The velocity of the flow is lower relative to the large central veins.
- Veins in between
- These include veins which their waveform does not perfectly match to any of the above two, and have unique spectral properties. Examples include portal vein and splenic vein.
- Central veins
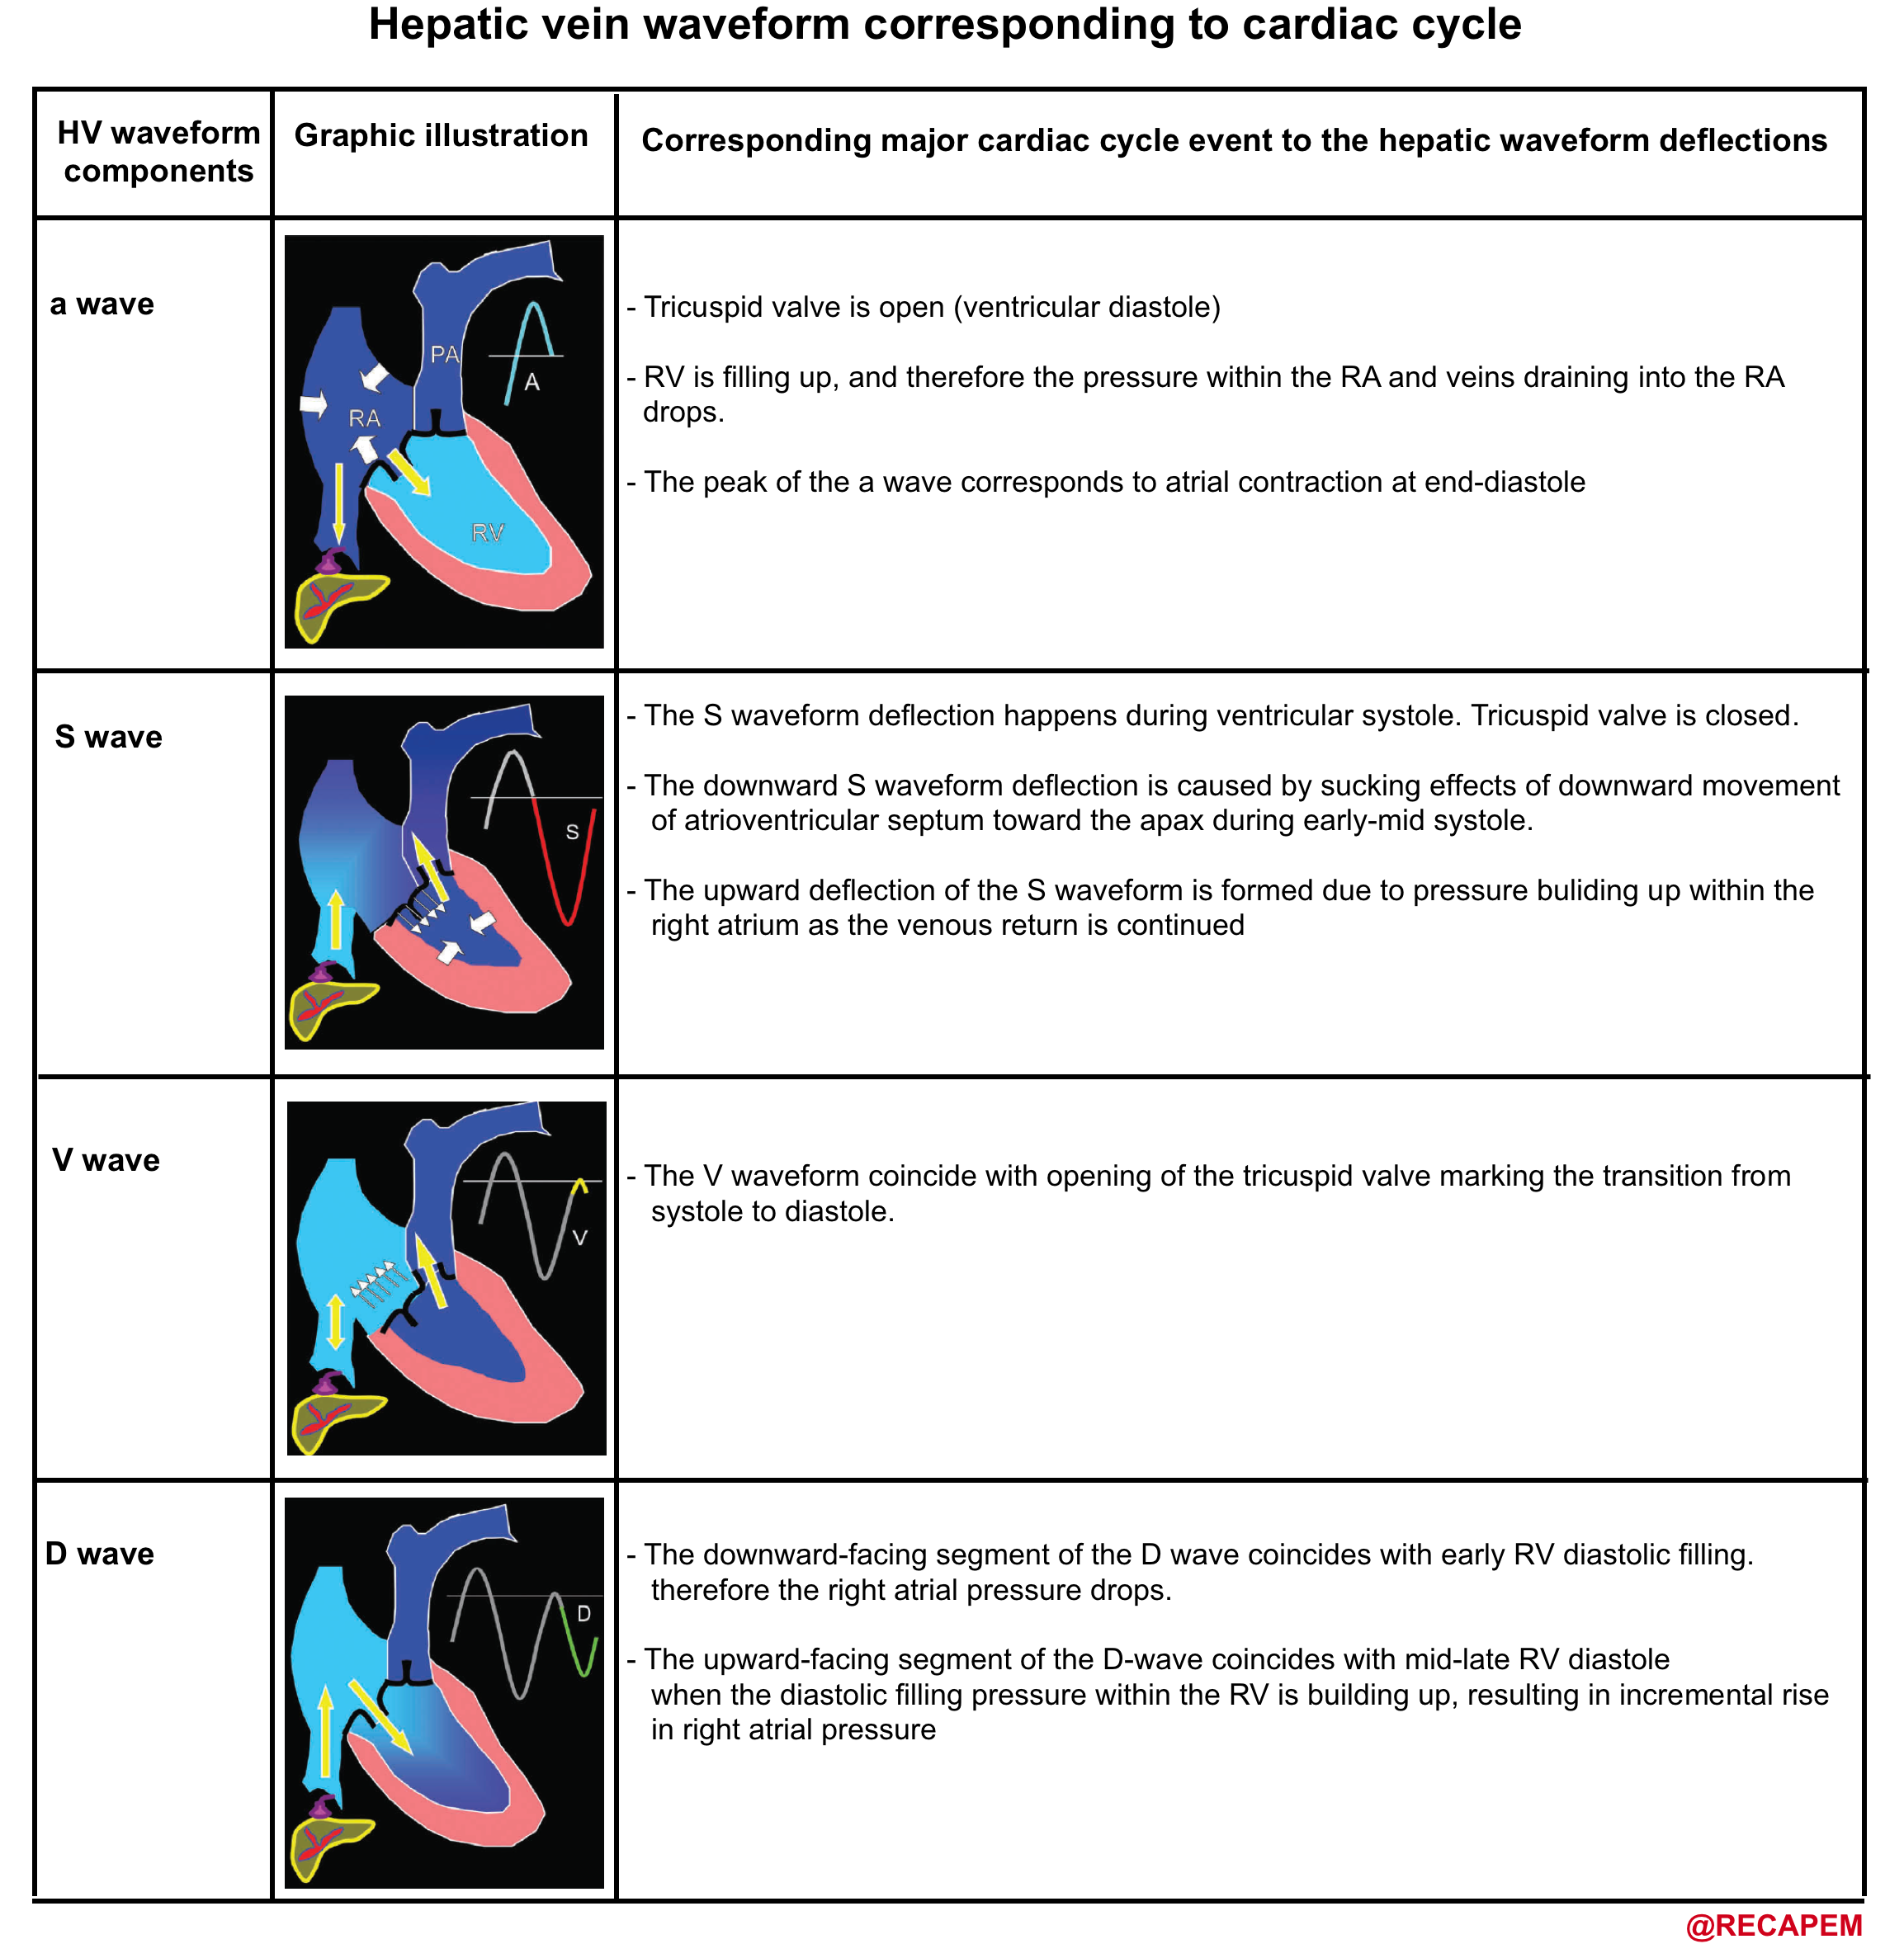
- How does the spectral waveform of IVC, hepatic vein look like in a healthy physiologic state?
- As discussed, these veins are central veins with their spectral waveform reflecting right-sided cardiac activity.
- The corresponding Waveform in the central vein with cardiac cycle is shown below.
-
- How can the Doppler study of the venous systems monitor the increased right atrial pressure?
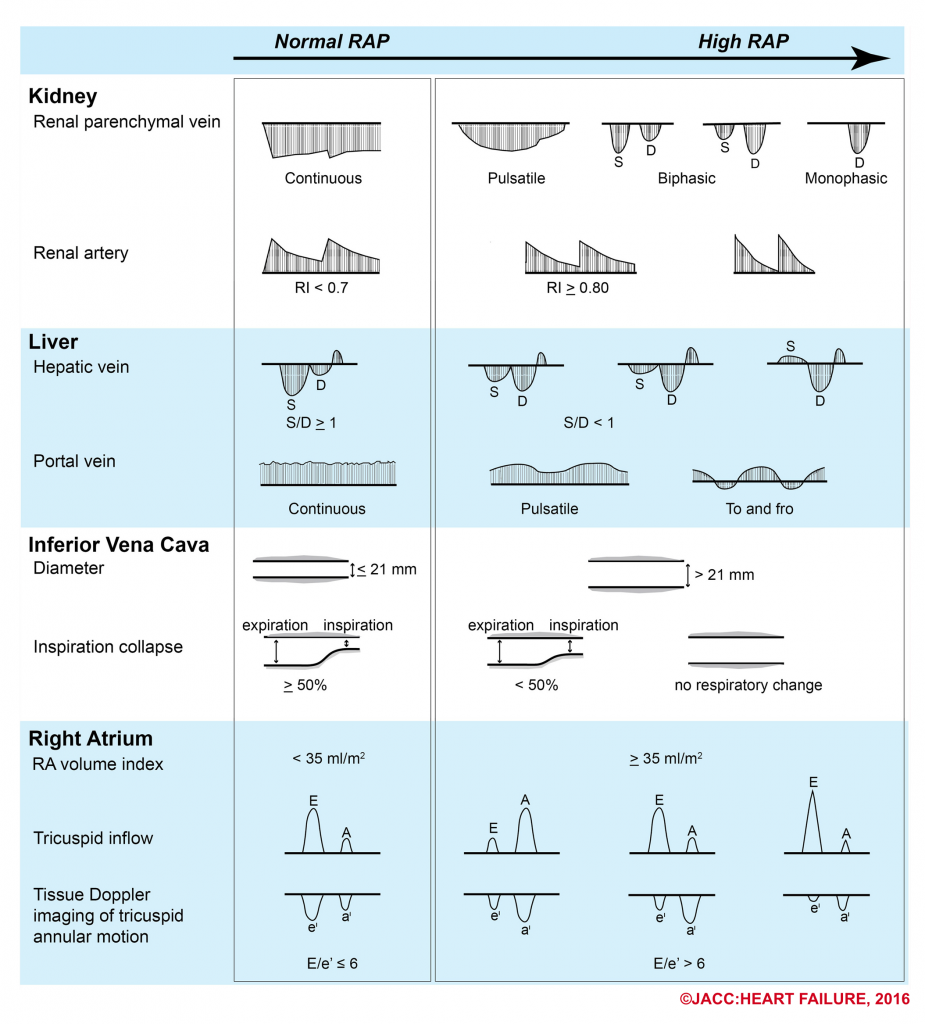
- Blood flow from the central veins (e.g. SVC, IVC, HV) into the right atrium is biphasic, with the largest forward flow occurring during ventricular systole.
- At low or normal right atrial pressures(RAPs), there is systolic predominance in the central venous flow, such that the systolic flow is greater than the diastolic flow.
- As RAP increases, the pressure is transmitted to the central veins, resulting in blunting of the forward systolic flow, reduced venous collapse with inspiration, and eventually venous dilatation.
- The following figure illustrates the ultrasound patterns across the spectrum of right atrial pressure.4
- How can the Doppler study of the venous systems monitor the increased right atrial pressure?
-
- How does portal venous Doppler waveform changes in response to increasing RAP?
- Portal vein is not a central vein nor is a peripheral vein. The flow within the portal vein is toward the liver throughout the entire cardiac cycle.
- It does not reflect the right-sided cardiac activity since it is isolated from the right heart by hepatic sinusoid.
- The normal Doppler waveform of portal vein is therefore continuous with minor fluctuation (wavy appearance).
- In the state of increased RAP, the portal vein flow becomes pulsatile (increased pulsatility fraction), and with increasing RAP, may become to-and-fro pattern (illustrated above).
- How does portal venous Doppler waveform changes in response to increasing RAP?
Introduction to basic cardiovascular physiology
The goal of reviewing cardiovascular physiology here is to build a clinically useful mental model that allows clinicians to better understand what is wrong with their patients and what to do about them. In practice, critical patients often have multiple coexisting hemodynamic derangements that do not fit well into a structured fixed algorithmic model.
| Guyton key statement When a change occurs in the hemodynamics of the circulatory system one cannot predict what will happen to the cardiac output unless he takes into consideration both the effect of this change on the ability of the heart to pump blood and also the tendency for blood to return to the heart from the blood vessel. |
Basic cardiovascular physiology
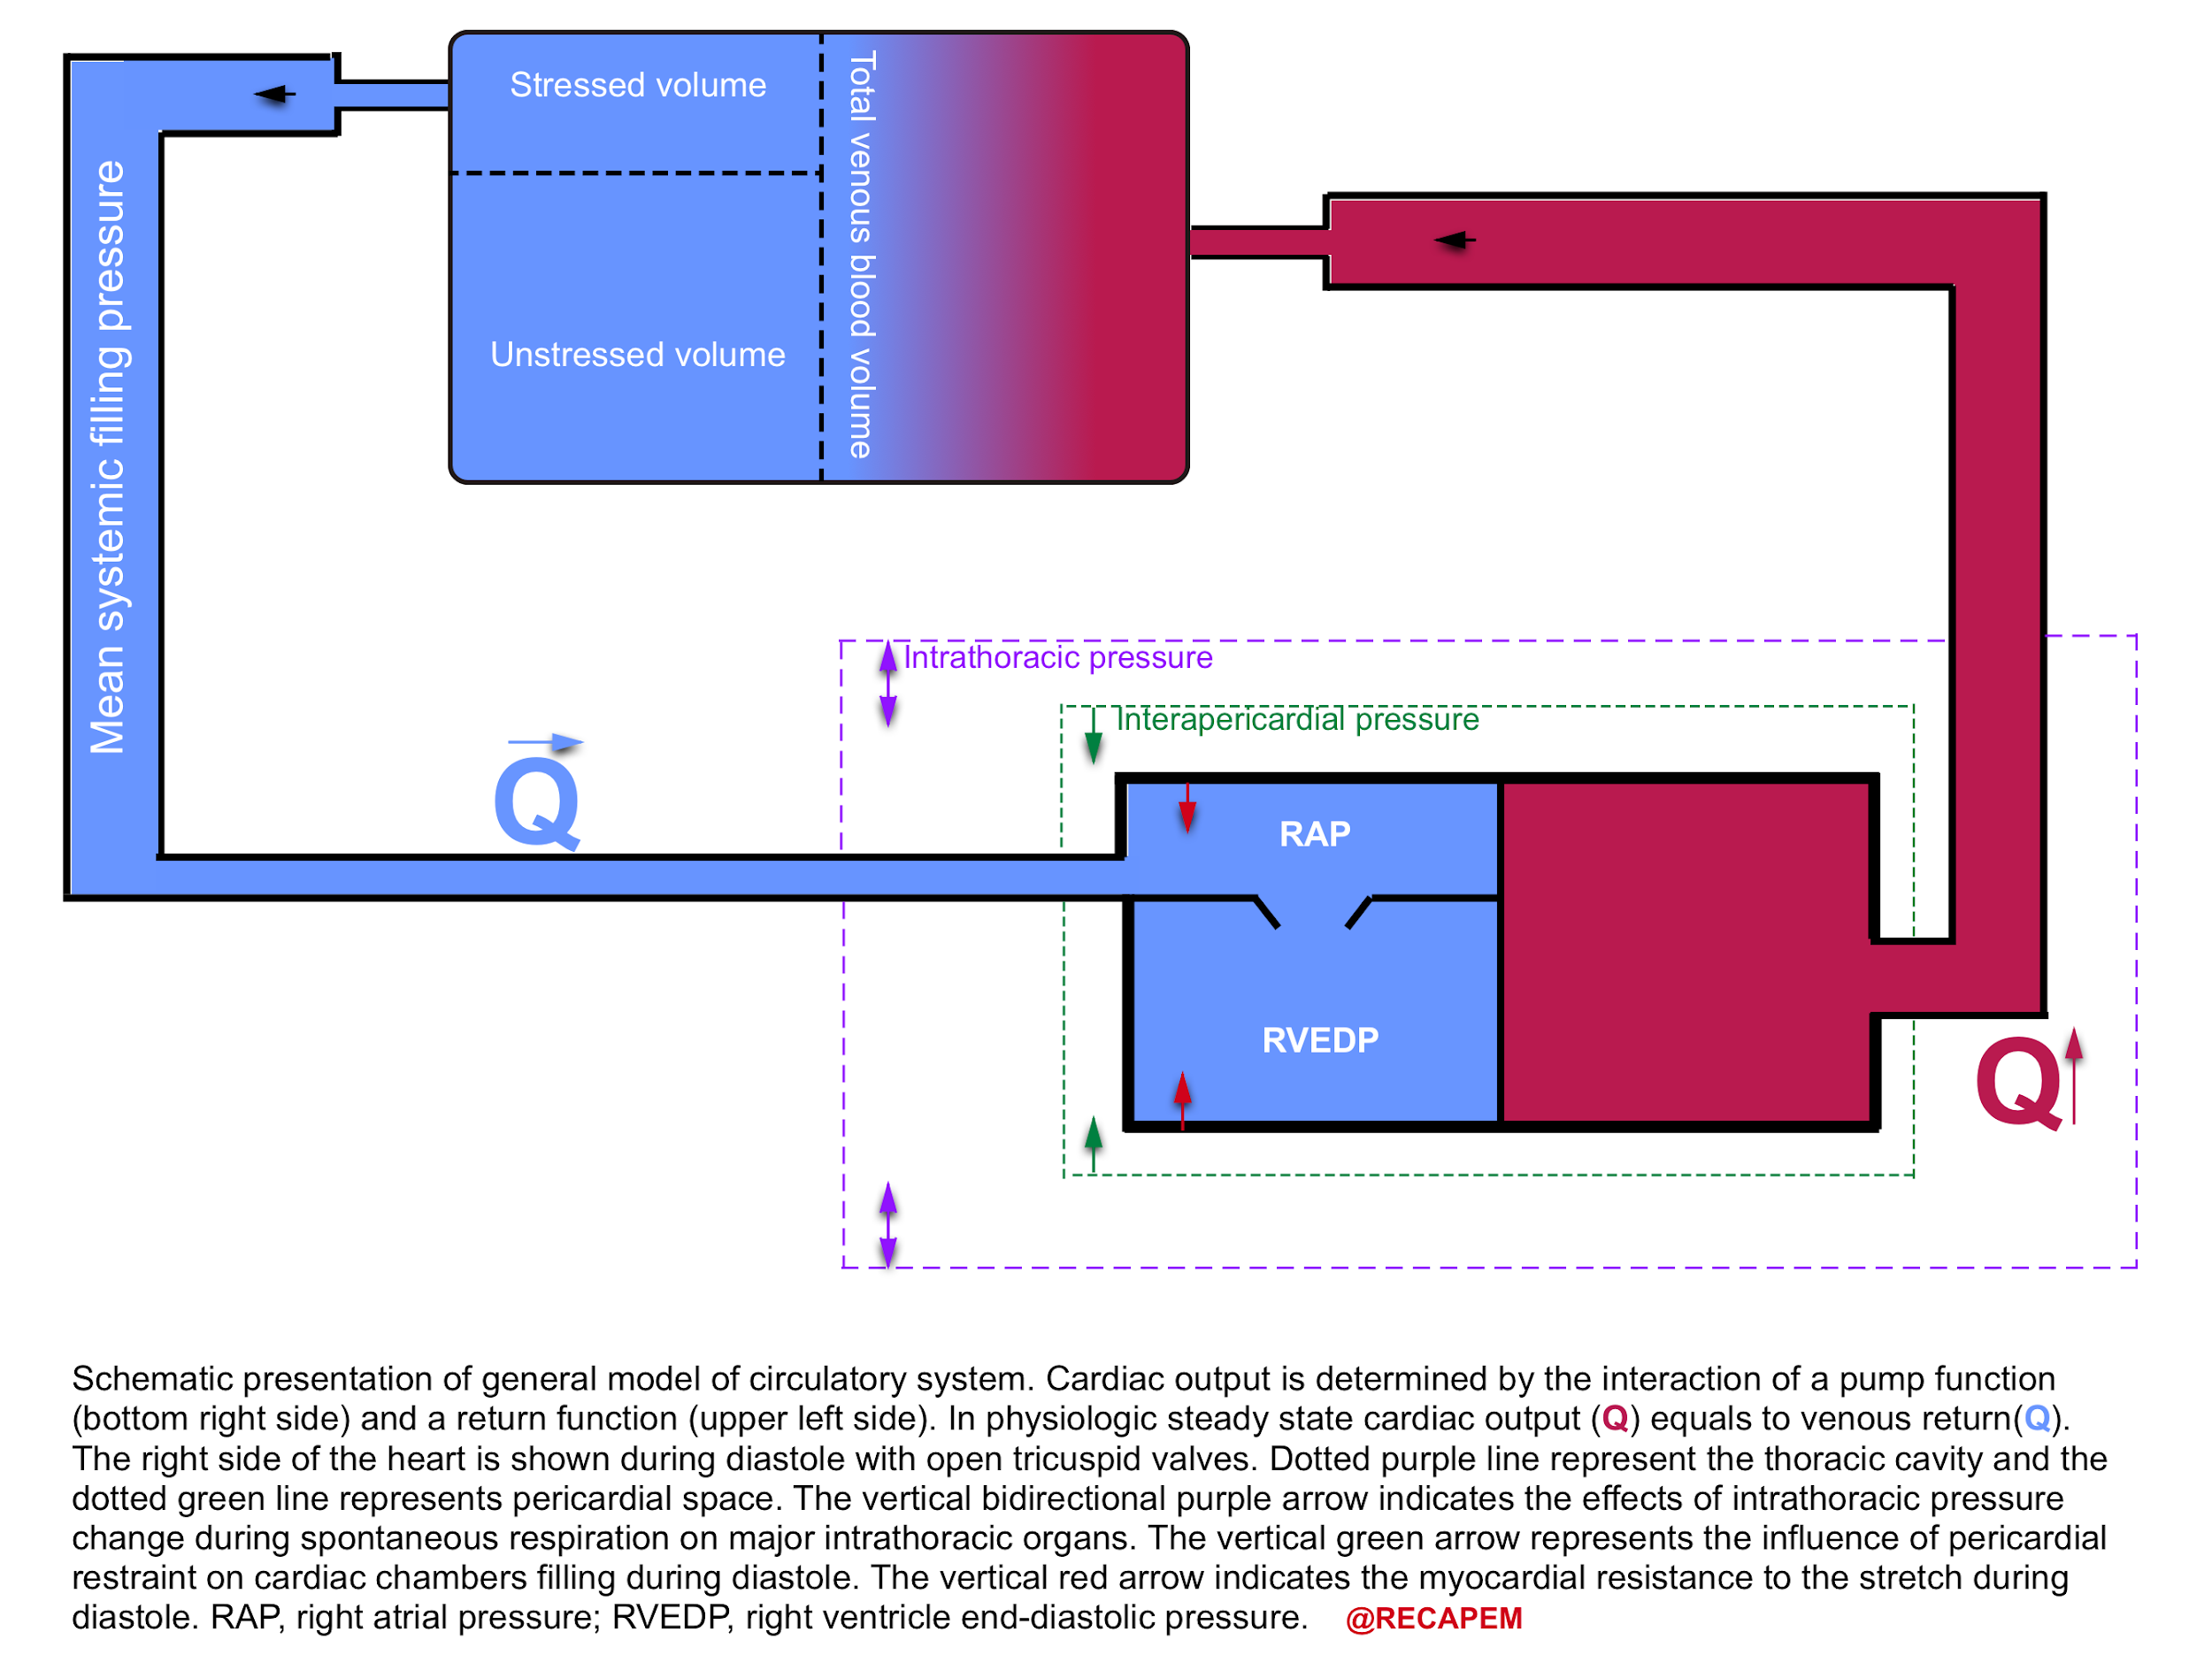
The heart will pump as much as it receives blood, that is to say if venous return to the heart is decreased, the cardiac output will be reduced. The general model of the circulatory system is depicted below.
- The cardiac output is determined by the interaction of pump function (bottom left side) and the return function (upper right side).6
- In physiologic steady state, the cardiac output equals venous return. Hope this makes sense to you!
Definition of stressed and unstressed volume
- Most of the intravascular blood volume sits in the venous system.
- In contrast to the arteries, the veins have a floppy wall with a tendency to collapse.
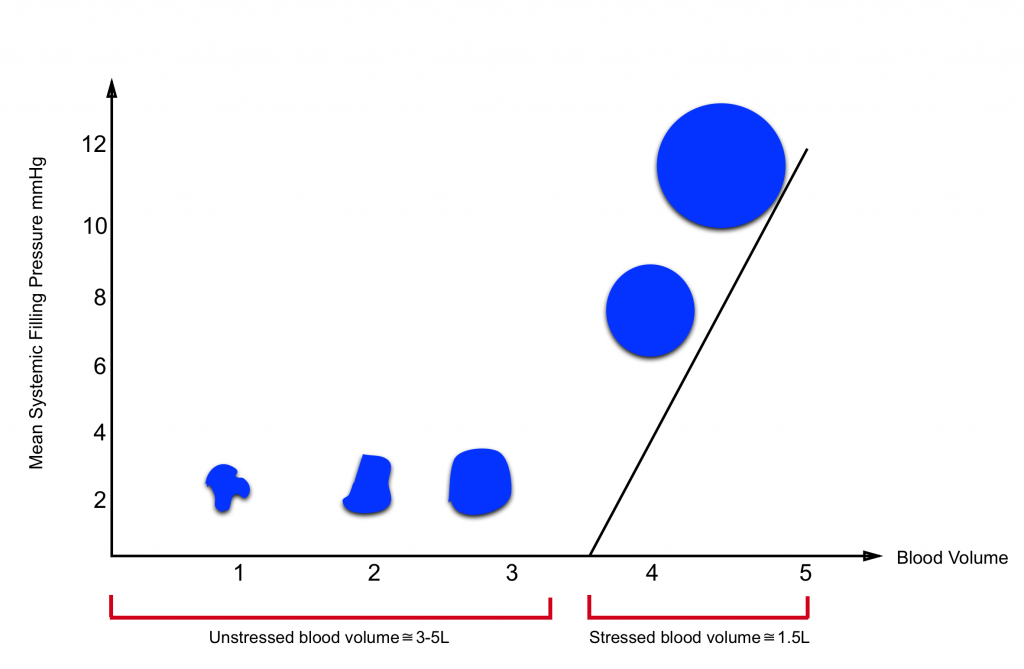
- Under resting conditions, most of the intravascular blood volume sits in these floppy veins and is called unstressed volume.
- This proportion of blood volume does not stretch vascular walls, hence there is not enough pressure for driving blood up to the right heart.
- In contrast, the amount of volume sitting in non-floppy veins is the actual amount of intravascular volume that has enough pressure to be driven up to the heart. This is called stressed volume.
- Please note that the venous system is a compliant compartment and is capable of reserving the blood without producing high pressure (figure below).
- In a single vein, the amount of volume should reach a certain point, beyond which the intravenous pressure is built up and blood can be driven up to the right heart (the steep part of the curve).7
| Clinical pearl In distributive shock state e.g. sepsis, the peripheral vasodilation contributes to shifting the physiologic stressed volume to unstressed volume. As such the venous return is decreased. Since the vessels are leaking, fluid boluses will not resolve the underlying primary problem. Earlier institutions of vasopressor will optimize stressed volume and lead to earlier stabilization of hemodynamic. |
- What is mean systemic filling pressure (MSFP)? 8
-
- As simple as it can be said, it is the pressure within the venous system which drives up the blood to the right heart (i.e. filling pressure). It is roughly around 8-12 mmHg.
- The filling pressure depends on
- Stressed volume
- Venous capacitance
- Note that unstressed volume does not contribute to MSFP.
- What factors influence venous return?
- As the name implies, venous return refers to volume of the blood returning back to the heart (flow). It depends on following factors:9
- Pressure within the venous system (MSFP)
- Venous resistance
- Intrathoracic pressure
- Intra-abdominal pressure
- Right atrial pressure
- Please note that systemic blood pressure does not affect venous return.
- As the name implies, venous return refers to volume of the blood returning back to the heart (flow). It depends on following factors:9
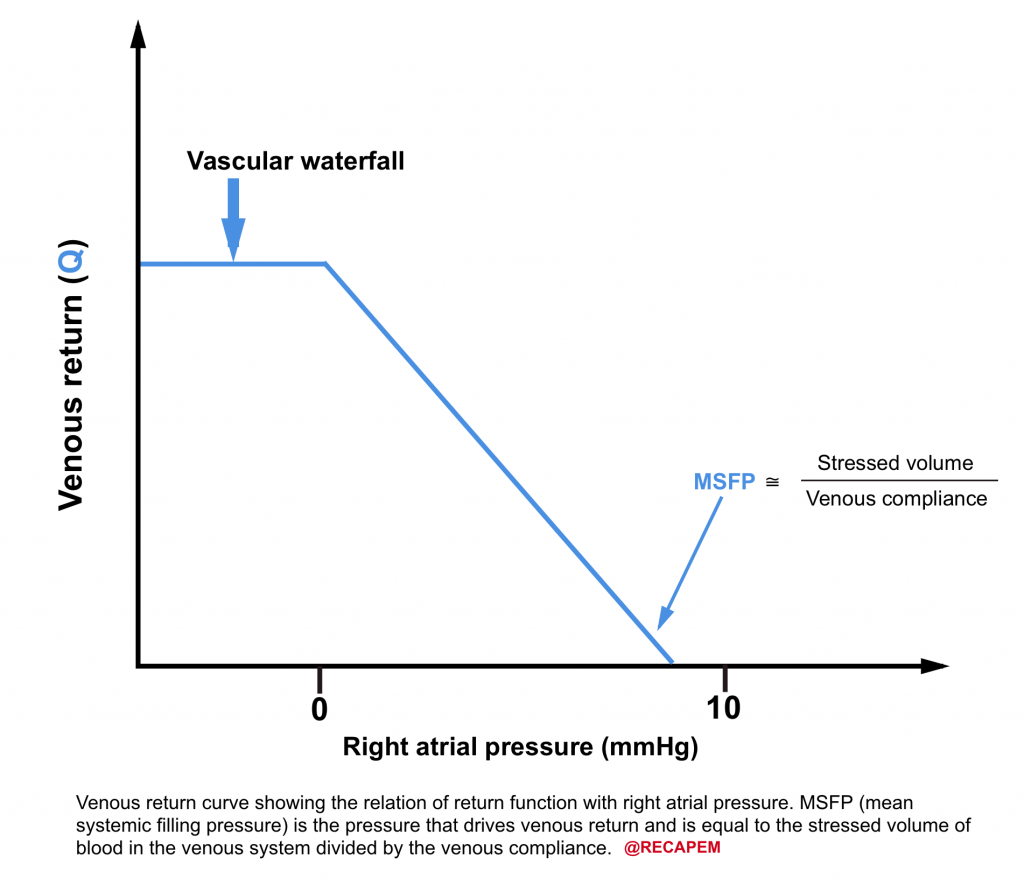
- Venous return curve is shown below.
- As the right atrial pressure decreases, the venous return increases.
- When RAP falls below zero, the venous return is maximized and will not increase further no matter how low the RAP is, due to collapse of the systemic veins.
| 💡Clinical tip 👉The ultrasonographic appearance of the vascular waterfall is a completely collapsed IVC. |
Clinical significance of IVC evaluation
The importance of IVC indices is that they indicate how the heart is interacting with the return of the blood to the heart.
The criticism has been made that IVC evaluation is not useful because it does not represent volume status, but why would one consider this in the first place??
- First, as mentioned above, stressed blood volume is only about 30% of total blood volume under resting condition and the rest of the volume resides within the unstressed compartment of the venous system (70%).
- Changes in the proportion of stressed to unstressed volume can change venous return and thus change IVC measures without a change in total blood volume.10
- In vasoplegia (e.g. sepsis) this proportion is altered so that more volume is shifted to the unstressed compartment due to vasodilation. As such IVC looks empty despite that total blood volume is unchanged.
- Changes in the proportion of stressed to unstressed volume can change venous return and thus change IVC measures without a change in total blood volume.10
- Second, the elastic recoil from the veins passes through a resistance in downstream veins. Changes in this resistance will alter the relation of total blood volume to IVC indices.11
- In abdominal compartment syndrome the resistance to venous outflow is increased, therefore IVC almost looks empty despite the fact that patients often have volume overload.
- Third, If there is an upstream resistant to IVC drainage (Increased RAP, intrapericardial pressure, and or intrathoracic pressure), the return function is impaired, cardiac output can be altered, and the relation of IVC metrics to blood volume are also changed.
- Therefore, the IVC looks engorged while the total blood volume could be unchanged or even decreased. This can be seen in clinical situations such as pulmonary hypertension, pulmonary embolism, tricuspid regurgitation, right ventricular dysfunction, cardiac tamponade, positive pressure ventilation, tension pneumothorax, hemothorax, etc.
Multi-oragn POUCUS: IVC evaluation
Objective
- Readers should be able to recognize the diagnostic importance of IVC evaluation.
Traditional question
- Does IVC measurement correlate to volume status?
The caveats in interpreting IVC measures for predicting volume status have been explored above. However i should emphasize the crucial diagnostic value of IVC evaluation as part of the multi-organ POCUS in patients with life threatening conditions. This information if supplemented to other measurements of POCUS , can potentially narrow the differential diagnosis.
The essential cardiovascular physiology for integrating clinical information and point of care labs and ultrasonographic information in approach to diagnosis of unstable patients is discussed below.
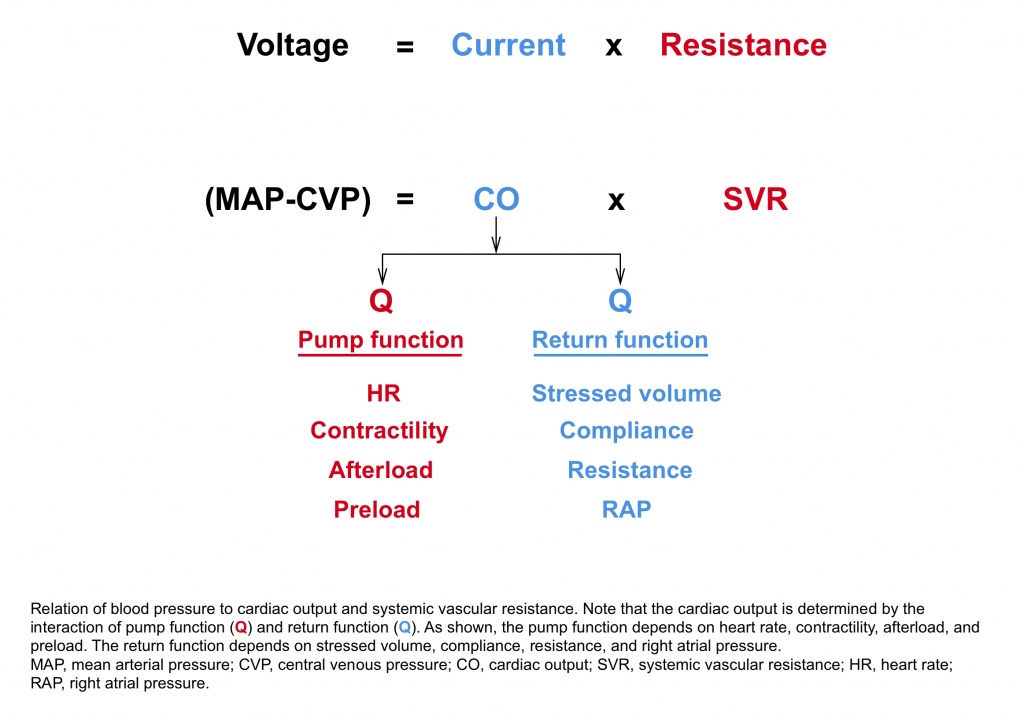
As described by Poieseuille’s law, blood pressure is approximately equal to the product of cardiac output and systemic vascular resistance.12
| At the most basic levels clinical signs of adequate cardiac output can often be sufficient. This includes 👉Normal level of consciousness 👉Warm extremities 👉Adequate urine output Presence of normal lab values for tissue perfusion such as blood lactate and normal base excess are reassuring. |
- If MAP is low, but cardiac output is normal or elevated.
- The primary reason for low MAP is reduced systemic vascular resistance. The possible causes include
- Sepsis
- Cardioactive drug overdose e.g beta blocker intoxication
- Neurogenic shock
- The primary reason for low MAP is reduced systemic vascular resistance. The possible causes include
- If MAP is low, and cardiac output is decreased.
- IVC evaluation can be helpful to determine if a decrease in cardiac function or a decrease in venous return is the primary problem.
- If the IVC is plumped, the primary problem could be decreased cardiac function, caused by:
- Heart rate/rhythm issues: Extreme bradycardia, tachydysrhythmia.
- ↑RV afterload: example include pulmonary embolism, pulmonary hypertension
- ↑LV afterload: SCAPE
- ↓Contractility: Cardiomyopathy, acute MI
- If the IVC is virtual, the primary problem could be venous return, and providing more volume will probably solve the problem (e.g late hemorrhagic shock)
- If the IVC is plumped, the primary problem could be decreased cardiac function, caused by:
- IVC evaluation can be helpful to determine if a decrease in cardiac function or a decrease in venous return is the primary problem.
Clinical scenario #1
- A 45-year-old woman with past medical history of DVT presented with shortness of the breath. She looked pale, diaphoretic with respiratory discomfort.
- Initial set of vitals showed BP 80/60, HR 140, RR 30, SO2 90% room air.
- ECG showed RBBB.
- Drug history: warfarin
- While initial resuscitative measures were ongoing, POCUS performed.
- Echo is shows evidence of RV strain and a large snake-like mobile clot within RA (clot-in-transit).
- Other findings include virtual IVC, absence of B-lines, and pleural effusion in lung exam.
- No peritoneal free fluid, abdominal aorta measured 3cm in diameter without internal echogenicity.
- How do you interpret your POCUS findings?
- Patient clinical presentation and finding of clot in transit (CIT) in POCUS, is highly suggestive for massive pulmonary embolism (MPE). It is not unusual that patients on antithrombotic medications develop new VTE events.
- In the presence of MPE, one would expect to see a plumped IVC due to increased RAP.
- In this case the presence of virtual IVC makes one to consider volume loss.
- Upon placement of NGT, almost 2L of coffee ground vomitus were noticed.
- IVC evaluation is crucially informative especially in critically ill patients. In this case, Interventional radiology clot extraction was considered.
- Patient clinical presentation and finding of clot in transit (CIT) in POCUS, is highly suggestive for massive pulmonary embolism (MPE). It is not unusual that patients on antithrombotic medications develop new VTE events.
Clinical scenario #2
- A 50-year-old man with a past medical history of cirrhosis presented to the hospital with mild general abdominal discomfort. He complained of difficulty in breathing while lying supine.
- Extremities are warm, and edematous.
- Vitals BP 85/40 (MAP55), HR 110, RR 25, SO2 90% room air, T 36.8 C, BS 90 mg/dL, intact sensorium.
- ECG showed low voltage limb leads, nonspecific ST-T changes.
- POCUS:
- Hyperkinetic left ventricle, No evidence for right heart strain, no pericardial effusion.
- IVC was not visualized.
- The Lung exam was A-profile.
- Abdominal aorta 3.5 cm in diameter without intraluminal echogenicity
- How would you interpret this clinical information?
- Low MAP, Shock index (HR/SBP) >1, virtual IVC, and hyperkinetic LV may make you consider the shock state.
- Algorithmic approach to hemodynamic derangement at bedside may enable one to perform a structured evaluation easy and fast, however they fail when approaching complicated patients with multifactorial shock as in the previous scenario. Oftentimes patients defy simple categorization as in this case, that’s why grasping the basic concept of cardiovascular physiology will help you to figure out what’s wrong with your patient.
- First: The hemodynamic profile of patients with advanced cirrhosis resemble distributive shock (low MAP, warm extremities, etc) due to chronic vasodilation. Their MAP is often in low range at baseline, which is per se, not clinically significant.
- Second, cirrhosis is a sodium-avid state (volume overload) by the time they develop possible superimposed conditions e.g.hemorrhage or sepsis.
- In this case, there are clinical signs of volume overload e.g. extremities edema, ascites.
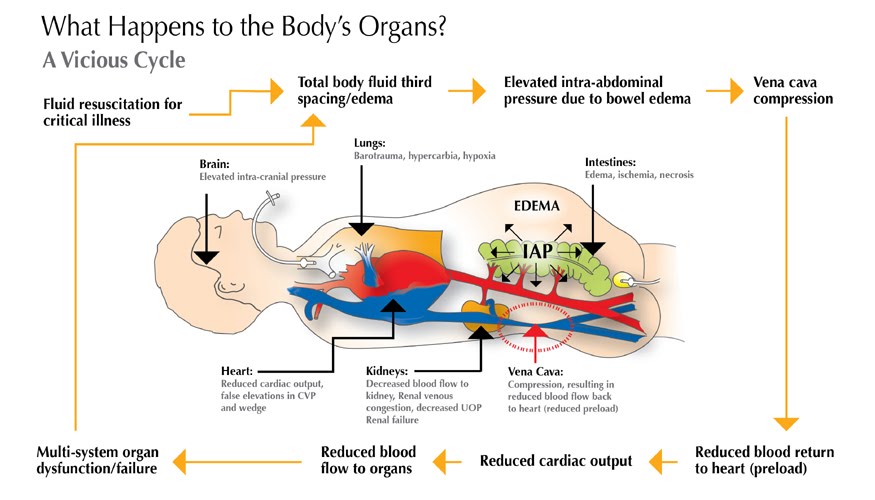
- How do you interpret virtual IVC in this setting?
- As explored in basic cardiovascular physiology, increased intra abdominal pressure 13 14 reduces venous return to the right heart and IVC appears virtual as shown below.
- In this case, comprehensive labs were sent, and abdominal paracentesis was performed. This led to improvement of the patient’s respiratory status, and in the serial IVC US, it measured 1.9 cm with <50% collapsibility index.
Hemodynamic Monitoring and Fluid Responsiveness
Objective
- Readers should be able to recognize the significance of the serial IVC evaluation in hemodynamic assessment of the patients.
Traditional clinical questions
- Can IVC serial measurement accurately answer ‘fluid responsiveness’ in my patient?
- Does IVC measurement more accurately determine the ‘fluid responsiveness’ of my patient compared to the more invasive measurement of CVP?
Everyday in the ED, or critical care unit, we are faced with this challenging question ‘Does My Patient Benefit From Fluid Administration’?
- First, let’s explore the rationale for giving fluid boluses and its possible beneficial effects on hemodynamics.
- There’s no doubt that fluid boluses administration in patients at extremis, with frank volume loss (e.g. profuse diarrhea) and other clinical situations where it is given based on physiologic-deriven thoughtful reasons could be potentially beneficial.
- However, giving fluid boluses based on algorithmic and other incentives which are not based on a patient’s physiologic deriven reasons should be discouraged. Here this issue is explored.
| Historically, physicians believe in blood shedding as a curative option for almost all illnesses. In recent years, this myth was replaced with administration of fluid boluses! |
There are arguably several reasons that make routine fixed-dose fluid bolus administration almost a moot point!
- The goal of hemodynamic resuscitation is to restore tissue perfusion, which is for the most part regulated by the microcirculatory function.
- Although optimizing macrocirculation metrics (e.g. MAP) may improve microcirculatory function, recent studies revealed that this is not always the case.
- In fact in certain situations such as sepsis, the coherence between the macro and microcirculation is lost 15 .In such situations, fluid boluses may hit the already injured glycocalyx molecule more and hence contributing to the worsening tissue perfusion and development of interstitial edema; while dubiously;the systemic blood pressure may look fabulous 16. More on this, here.
- The beneficial effects of fluid boluses (if any) on hemodynamic metrics are transient.
- Only about 30% of the crystalloid fluid boluses will remain intravascularly, if ever remained. Therefore it is not a permanent solution to the problem (rather it is an excuse for delaying more definitive treatment options!).
- The rationale for fluid boluse is to increase cardiac output (CO) via optimizing preload.
- This ↑”CO” and MAP could be beneficial only if translated into ↑oxygen delivery, and ↑issue oxygen utilization.
- Notice that increasing preload is one of the therapeutic options for increasing “CO” (if ever it works!), while there are several other more definitive options for augmenting “CO” such as optimizing heart rate, afterload, and cardiac contractility.
- Several studies have shown that maximizing “CO”, and MAP does not always lead to improved patient outcomes.17 18 19 20
- This ↑”CO” and MAP could be beneficial only if translated into ↑oxygen delivery, and ↑issue oxygen utilization.
| Determining fluid responsiveness is not a simple measure which can be precisely predictable by evaluation of IVC indices. Moreover, determining fluid tolerance may need to be answered first (more on these, here). |
Are IVC indices more accurate than CVP invasive measurement regarding the fluid responsiveness of my patient?
- Several recent studies have shown that there is a very poor relationship between CVP and blood volume as well as the inability of serial measurement of CVP to predict the hemodynamic response to a fluid challenge.21 22
- Since both CVP, and IVC measure the same thing (RAP), it will take the clinical utility of IVC for determining volume status under the question!
- The Data regarding performance of IVC indices for predicting fluid responsiveness are not informative yet, and more information is required for addressing this issue.
- Several studies have shown so far that IVC diameter variations ‘may’ be correlated with fluid responsiveness. Clearly the static diameter of IVC has been shown useless.
Clinical case #3
- A 67-year-old woman with past medical history of HTN, ischemic heart disease, heart failure, presented to the hospital with shortness of the breath and mild epigastric discomfort.
- She was in respiratory distress with diaphoresis and cold edematous extremities.
- Current vitals are: BP 110 /75, HR 100, RR 28, SO2 90% room air.
- ECG: Low voltage limb leads, nonspecific ST-T changes.
- POCUS
- The echo and IVC US shown below.
- B-profile on lung exam, no pleural effusion.
- No peritoneal free fluid, Abdominal aortic diameter 3.5 cm.

- Echo shows global hypokinesia, and estimated EF 20%. No pericardial effusion as well. IVC has no respiratory collapse.
- Patient was managed for acute decompensated heart failure with supplemental oxygen, nitroglycerine infusion and a diuretic challenge.
- After 4 hours, the patient was drowsy, not using accessory muscles of respiration, extremities are edematous and cold. Scant amount of dark-yellow urine was noticed in the urine bag.
- New vitals: BP 85/50 (off the NTG drip), HR 120, RR 22, SO2 96% on supplemental oxygen.
- POCUS showed scattered B-lines on lung exam, estimated EF 30%. No new finding in abdominal US.
- IVC is shown below.
- How do you interpret this information?
- Acute volume loss may be masked by acute decompensated heart failure. Serial examination of IVC would be revealing following improvement of cardiac performance.
- In this case, the initial complaint of epigastric pain, drug history and worsening clinical and hemodynamics as well as virtual IVC on the second exam, prompted the clinician to search for potential sources of volume loss.
- Following placement of NGT, 1L of coffee ground vomitus was emptied.
- In critically ill patients often multiple hemodynamic insults coexist and sometimes initial POCUS evaluation is unrevealing for the potential causes of hemodynamic instability. Serial exams integrated with clinical information would be helpful to guide clinicians toward appropriate decision making.
Clinical scenario #4
- A 66-year-old man with PMH of prostate cancer is admitted with septic shock due to pyelonephritis.
- He has received four liters of crystalloid and antibiotics.
- After 4 hours of resuscitation, vitals are: MAP 55, HR 130. He is producing very little urine.
- POCUS showed:
- Hyperkinetic LV, No RV strain, No pericardial effusion.
- IVC not visualized.
- Presence of pleural sliding, absence of pleural effusion and A-profile in lung exam.
- No peritoneal free fluid, abdominal aortic diameter 3cm.
- Is administration of more boluses warranted at this time?
- The IVC is virtual and LV is underfilled. The ‘Tank is empty’!
- The traditional teaching is to continue aggressive volume resuscitation in this patient. However as explained above, in distributive shock systemic vasodilation causes shifting the stressed volume to unstressed volume, leading to ↓mean systemic filling pressure. There is also extravasation of fluid out of the vasculature (“third spacing”), further reducing the stressed volume in the venous system.
- The return function of the heart is decreased (↓pressure within the systemic veins and right atrium), and the pump function is operating on the vascular waterfall (virtual IVC).
- In Fact, the total blood volume is not changed, rather the stressed volume is reduced.
- Fluid administration may transiently improve preload, but as systemic veins are leaking, fluid is not held intravascularly, and more interstitial edema formation will further impair tissue perfusion.
- Early institution of vasopressor will resolve the underlying primary problem and will raise the MSFP without further fluid blouse and tissue perfusion insult.
RECAP
- IVC evaluation can be informative in the context of multiorgan POCUS, if one has grasped the essential cardiovascular physiology, and is able to integrate these information with clinical presentation of the patient.
- The clinical significance of the IVC relies on its revealing interaction between the venous return and the heart.
- Intermediate IVC indices are not accurate in estimating RAP. More comprehensive US exams including Doppler study of hepatic vein, portal vein, renal parenchymal vein and renal arterial flow often provide supplementary data that may upgrade or downgrade the estimated RAP.
- The return function of the heart can be altered in different clinical situations wherein the total blood volume remains the same.
- IVC measures are not a good surrogate for volume status. In conditions such as pulmonary embolism, pulmonary arterial hypertension, etc. where the RAP is increased due to increased upstream resistance, IVC appears engorged while the underlying problem is not volume overload. In contrast, during systemic vasodilatory state such as sepsis, the IVC appears virtual while the total blood volume is not changed.
Going further
- ICU Fundamentals: Fluid Resuscitation(EM:RAP)
- Mythbusting: (Empty IVC + hyperkinetic heart) does not equal volume depletion(PULMCRIT)
- Myth-busting the fluid bolus(PulmCrit)
- Why we fail at hemodynamics: The flaw of averages & the swan’s curse(PulmCrit)
References
1. Smillie RP, Shetty M, Boyer AC, Madrazo B, Jafri SZ. Imaging evaluation of the inferior vena cava. Radiographics. 2015;35(2):578-592. doi:10.1148/rg.352140136
2. Beigel R, Cercek B, Luo H, Siegel RJ. Noninvasive evaluation of right atrial pressure. J Am Soc Echocardiogr. 2013;26(9):1033-1042. doi:10.1016/j.echo.2013.06.004
3. McNaughton DA, Abu-Yousef MM. Doppler US of the liver made simple [published correction appears in Radiographics. 2011 May-Jun;31(3):904]. Radiographics. 2011;31(1):161-188. doi:10.1148/rg.311105093
4. Tang WH, Kitai T. Intrarenal Venous Flow: A Window Into the Congestive Kidney Failure Phenotype of Heart Failure?. JACC Heart Fail. 2016;4(8):683-686. doi:10.1016/j.jchf.2016.05.009
5. Beaubien-Souligny W, Rola P, Haycock K, et al. Quantifying systemic congestion with Point-Of-Care ultrasound: development of the venous excess ultrasound grading system. Ultrasound J. 2020;12(1):16. Published 2020 Apr 9. doi:10.1186/s13089-020-00163-w
6. Magder S. Right Atrial Pressure in the Critically Ill: How to Measure, What Is the Value, What Are the Limitations?. Chest. 2017;151(4):908-916. doi:10.1016/j.chest.2016.10.026
7. Shen T, Baker K. Venous return and clinical hemodynamics: how the body works during acute hemorrhage. Adv Physiol Educ. 2015;39(4):267-271. doi:10.1152/advan.00050.2015
8. Henderson WR, Griesdale DE, Walley KR, Sheel AW. Clinical review: Guyton–the role of mean circulatory filling pressure and right atrial pressure in controlling cardiac output. Crit Care. 2010;14(6):243. doi:10.1186/cc9247
9. Funk DJ, Jacobsohn E, Kumar A. Role of the venous return in critical illness and shock: part II-shock and mechanical ventilation. Crit Care Med. 2013;41(2):573-579. doi:10.1097/CCM.0b013e31827bfc25
10. Spiegel R. Stressed vs. unstressed volume and its relevance to critical care practitioners. Clin Exp Emerg Med. 2016;3(1):52-54. Published 2016 Mar 31. doi:10.15441/ceem.16.128
11. Magder S. Understanding central venous pressure: not a preload index?. Curr Opin Crit Care. 2015;21(5):369-375. doi:10.1097/MCC.0000000000000238
12. Magder S. Bench-to-bedside review: An approach to hemodynamic monitoring–Guyton at the bedside. Crit Care. 2012;16(5):236. Published 2012 Oct 29. doi:10.1186/cc11395
13. Beck R, Halberthal M, Zonis Z, Shoshani G, Hayari L, Bar-Joseph G. Abdominal compartment syndrome in children. Pediatr Crit Care Med. 2001;2(1):51-56. doi:10.1097/00130478-200101000-00011
14. Maluso P, Olson J, Sarani B. Abdominal Compartment Hypertension and Abdominal Compartment Syndrome. Crit Care Clin. 2016;32(2):213-222. doi:10.1016/j.ccc.2015.12.001
15. Ince C. Hemodynamic coherence and the rationale for monitoring the microcirculation. Crit Care. 2015;19 Suppl 3(Suppl 3):S8. doi:10.1186/cc14726
16. Chelazzi C, Villa G, Mancinelli P, De Gaudio AR, Adembri C. Glycocalyx and sepsis-induced alterations in vascular permeability. Crit Care. 2015;19(1):26. Published 2015 Jan 28. doi:10.1186/s13054-015-0741-z
17. Woolley T, Thompson P, Kirkman E, et al. Trauma Hemostasis and Oxygenation Research Network position paper on the role of hypotensive resuscitation as part of remote damage control resuscitation. J Trauma Acute Care Surg. 2018;84(6S Suppl 1):S3-S13.
Hylands M, Moller MH, Asfar P, et al. A systematic review of vasopressor blood pressure targets in critically ill adults with hypotension. Une revue systématique des cibles de tension artérielle sous vasopresseurs chez des adultes gravement malades atteints d’hypotension. Can J Anaesth. 2017;64(7):703-715. doi:10.1007/s12630-017-0877-1
18. Lamontagne F, Day AG, Meade MO, et al. Pooled analysis of higher versus lower blood pressure targets for vasopressor therapy septic and vasodilatory shock. Intensive Care Med. 2018;44(1):12-21. doi:10.1007/s00134-017-5016-5
19. Cerqueira RM, Andrade L, Correia MR, Fernandes CD, Manso MC. Risk factors for in-hospital mortality in cirrhotic patients with esophageal variceal bleeding. Eur J Gastroenterol Hepatol. 2012;24(5):551-557. doi:10.1097/MEG.0b013e3283510448
20. Marik PE, Baram M, Vahid B. Does central venous pressure predict fluid responsiveness? A systematic review of the literature and the tale of seven mares. Chest. 2008;134(1):172-178. doi:10.1378/chest.07-2331
21. Marik PE, Cavallazzi R. Does the central venous pressure predict fluid responsiveness? An updated meta-analysis and a plea for some common sense. Crit Care Med. 2013;41(7):1774-1781. doi:10.1097/CCM.0b013e31828a25fd

Add comment